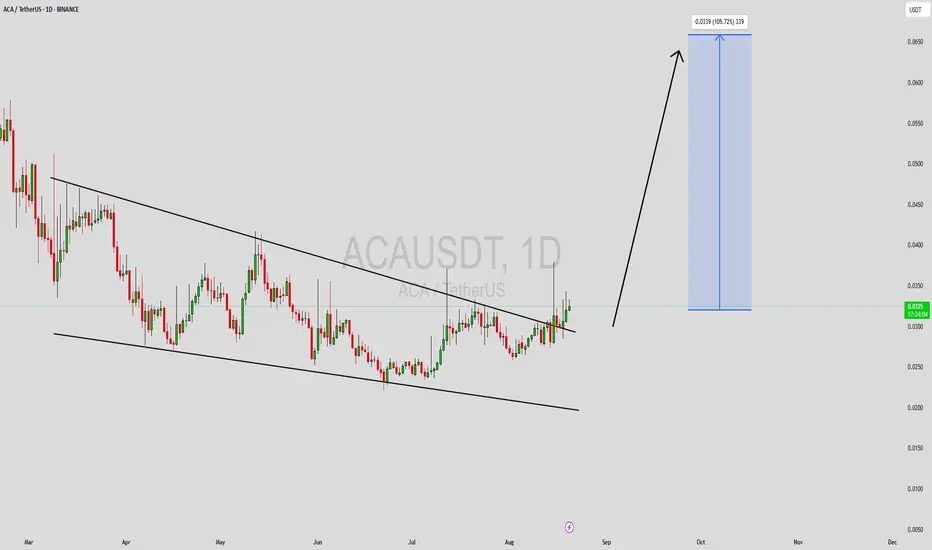
ACAUSDT Forming Falling WedgeACAUSDT is currently displaying a classic falling wedge pattern, which is widely recognized as a bullish reversal signal in technical analysis. This pattern suggests that while the price has been in a downtrend, the momentum is weakening, and a breakout to the upside is increasingly likely. With the narrowing price range and clear descending structure, ACAUSDT could be gearing up for a significant breakout, projecting a potential gain of 90% to 100% in the upcoming sessions.
Trading volume remains supportive, showing strong interest among both retail and institutional traders. This steady volume behavior within a wedge pattern often precedes a powerful bullish impulse. It indicates accumulation is taking place while weaker hands exit, setting the stage for a breakout rally once a key resistance level is breached.
From a technical standpoint, falling wedges typically act as launchpads during market bottoms. In ACA’s case, the overall market sentiment around innovative DeFi projects further enhances its rebound potential. If ACA can sustain its current support zone and break above the wedge resistance with volume confirmation, traders could see substantial upside in a short time frame.
✅ Show your support by hitting the like button and
✅ Leaving a comment below! (What is You opinion about this Coin)
Your feedback and engagement keep me inspired to share more insightful market analysis with you!
Acabtclong
#ACA/USDT#ACA
The price is moving in a descending channel on the 1-hour frame and is adhering to it well and is heading to break it strongly upwards and retest it
We have a bounce from the lower limit of the descending channel, this support is at a price of 0.0340
We have a downtrend on the RSI indicator that is about to break and retest, which supports the rise
We have a trend to stabilize above the moving average 100
Entry price 0.0377
First target 0.0404
Second target 0.0435
Third target 0.0474

#ACA/USDT#ACA
The price is moving in a descending channel on the 4-hour frame and we are about to break it
We have a bounce from a major support area in green at 0.475
We have a downtrend on the RSI indicator that has been broken upwards
We have a trend to stabilize above the moving average 100 which supports the rise
Entry price 0.0705
First target 0.1083
Second target 0.1345
Third target 0.1695

ACAUSDT 800% PotentialACAUSDT Technical Analysis Update
Buy zone : Below $0.058
Stop loss : $0.0430
Take Profit 1 : $0.0740
Take Profit 2 : $0.112
Take Profit 3 : $0.225
Take Profit 4 : $0.55
Spot trade.
Always Keep StopLoss
Thanks
Hexa

$ACA/#BTC [#Acala Token]: BBand_Breakout_&_Resistance_Breakout◳◱ Hey crypto lovers, we've identified bullish signals on the $ACA / $BTC chart through the detection of both a Bollinger Band and a Resistance Breakout. The Bollinger Band indicates a potential bullish trend as the price has moved outside of the upper band, while the Resistance Breakout confirms this trend by showing the price breaking above a key resistance level. Given the alignment of these signals, it may be a good idea to consider entering a long position and targeting higher levels. Our analysis indicates that the key resistance levels are at 0.00000636 | 0.00000686 | 0.00000791 and the major support zones are at 0.00000531 | 0.00000476 | 0.00000371. However, it is important to also consider other factors such as overall market conditions and other technical indicators before making a trade decision.
◰◲ Technical Metrics :
▣ Mrkt Price: 0.00000624 ₿
▣ 24HVol: 19.545 ₿
▣ 24hChng: 4.874%
◲◰ Pivot Points - Levels :
◥ Resistance: 0.00000636 | 0.00000686 | 0.00000791
◢ Support: 0.00000531 | 0.00000476 | 0.00000371
◱◳ Indicators recommendation :
▣ Oscillators: NEUTRAL
▣ Moving Averages: STRONG_BUY
◰◲ Technical Indicators Summary : BUY
◳◰ Market Sentiment Index :
▣ News sentiment score is N/A
▣ Twitter sentiment score is N/A
▣ Reddit sentiment score is N/A
▣ In-depth ACABTC technical analysis on Tradingview TA page
▣ What do you think of this analysis? Share your insights and let's discuss in the comments below. Your like, follow and support would be greatly appreciated!
◲ Disclaimer
Please note that the information and publications provided are for informational purposes only and should not be construed as financial, investment, trading, or any other type of advice or recommendation. We encourage you to conduct your own research and consult with a qualified professional before making any financial decisions. The use of the information provided is solely at your own risk.
▣ Welcome to the home of charting big: TradingView
Benefit from a ton of financial analysis features, instruments and data. Have a look around, and if you do choose to go with an upgraded plan, you'll get up to $30.
Discover it here - affiliate link -
