#ACE/USDT LONG#ACE
The price is moving in a descending channel on the 1-hour timeframe. It has reached the lower boundary and is heading towards breaking above it, with a retest of the upper boundary expected.
We have a downtrend on the RSI indicator, which has reached near the lower boundary, and an upward rebound is expected.
There is a key support zone in green at 0.270. The price has bounced from this zone multiple times and is expected to bounce again.
We have a trend towards stability above the 100-period moving average, as we are moving close to it, which supports the upward movement.
Entry price: 0.276
First target: 0.286
Second target: 0.298
Third target: 0.312
Stop loss: Below the support zone in green.
Don't forget a simple thing: capital management.
For inquiries, please leave a comment.
Thank you.
ACE

ACEUSDT UPDATE#ACE
UPDATE
ACE Technical Setup
Pattern: Falling Wedge Pattern
Current Price: $0.292
Target Price: $0.361
Target % Gain: 138.99%
Technical Analysis: ACE is breaking out of a falling wedge pattern on the 1D chart, signaling bullish potential. The price has recently surged above the resistance trendline, supported by an increase in volume. The setup is validated as the price approaches key resistance areas.
Time Frame: 1D
Risk Management Tip: Always use proper risk management.

ACEUSDT Forming Falling WedgeACEUSDT is forming a clear falling wedge pattern, a classic bullish reversal signal that often indicates an upcoming breakout. The price has been consolidating within a narrowing range, suggesting that selling pressure is weakening while buyers are beginning to regain control. With consistent volume confirming accumulation at lower levels, the setup hints at a potential bullish breakout soon. The projected move could lead to an impressive gain of around 90% to 100% once the price breaks above the wedge resistance.
This falling wedge pattern is typically seen at the end of downtrends or corrective phases, and it represents a potential shift in market sentiment from bearish to bullish. Traders closely watching ACEUSDT are noting the strengthening momentum as it nears a breakout zone. The good trading volume adds confidence to this pattern, showing that market participants are positioning early in anticipation of a reversal.
Investors’ growing interest in ACEUSDT reflects rising confidence in the project’s long-term fundamentals and current technical strength. If the breakout confirms with sustained volume, this could mark the start of a fresh bullish leg. Traders might find this a valuable setup for medium-term gains, especially as the wedge pattern completes and buying momentum accelerates.
✅ Show your support by hitting the like button and
✅ Leaving a comment below! (What is your opinion about this Coin?)
Your feedback and engagement keep me inspired to share more insightful market analysis with you!
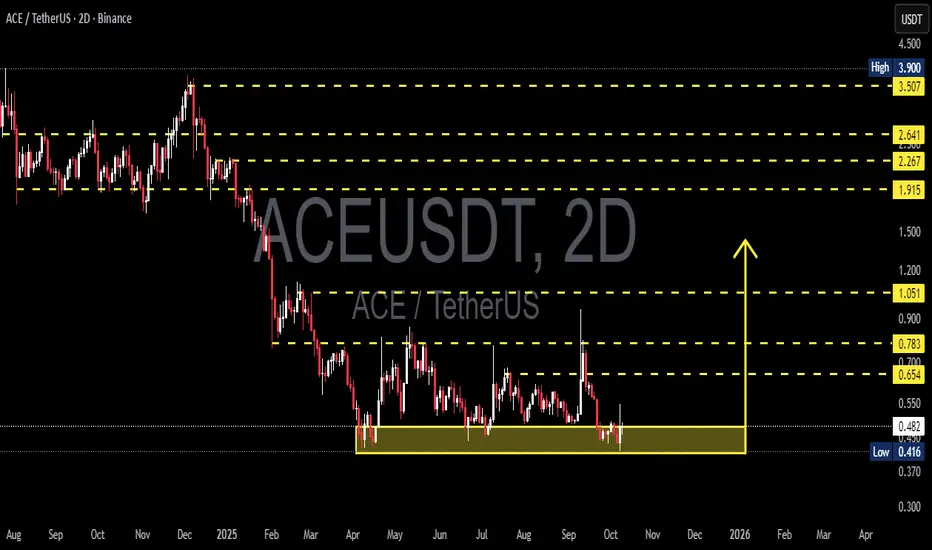
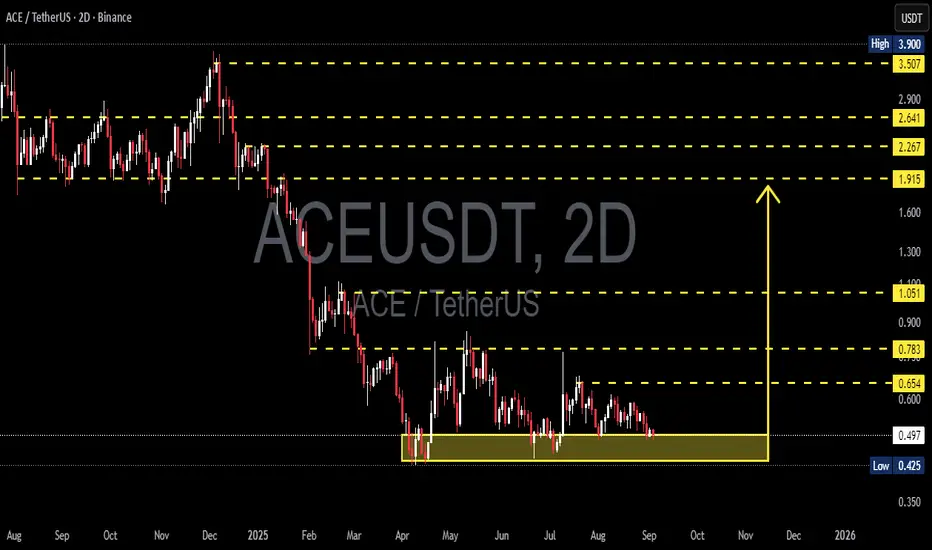
ACE/USDT — Accumulation Zone! Bulls for a Major Reversal?ACE is currently trading above its key demand zone between 0.416 and 0.479 USDT — an area that has consistently absorbed selling pressure throughout 2025.
Each touch of this yellow zone has produced a strong rebound and long lower wicks, signaling aggressive accumulation by buyers or larger market participants.
After a prolonged downtrend from the 3.9 USDT level, price has entered a sideways structure, forming a potential accumulation base — a typical setup that often precedes a major trend reversal.
---
Pattern & Structure Overview:
Primary Trend: Long-term bearish.
Current Phase: Accumulation/sideways range.
Key Demand Zone: 0.416–0.479 USDT (yellow box).
Nearest Resistance Levels: 0.654 → 0.783 → 1.051 → 1.915.
Volume Behavior: Low at the base, with spikes on rallies — hinting at smart money accumulation.
---
Bullish Scenario:
If ACE can hold above the yellow zone and confirm a 2D close above 0.654 USDT with a noticeable volume surge, this could spark a strong reversal rally toward 0.783 → 1.051 → 1.915.
A breakout above these levels would mark a structural shift from distribution to accumulation — the early stage of a bullish trend.
🎯 Bullish Targets:
T1 → 0.654
T2 → 0.783
T3 → 1.051
T4 (extension target) → 1.915
📈 Bullish Narrative:
This accumulation phase could be the calm before the storm — if demand continues to build, ACE may deliver a sharp upside move that catches the market off guard.
---
Bearish Scenario:
If the price breaks down below 0.416 with a clean 2D close and strong selling volume, it would confirm a continuation of the bearish trend.
In that case, ACE may extend its decline toward the psychological zone below 0.38 USDT or even lower, depending on market sentiment.
📉 Bearish Narrative:
Losing this critical demand zone would expose the market to another leg down — turning the current range into a failed accumulation and confirming further weakness.
---
Strategic Takeaway:
ACE is now at a critical inflection point — where accumulation could transform into a new bullish phase, or failure could resume the macro downtrend.
This 0.416–0.479 zone is the battlefield between bulls and bears, and the next decisive 2D candle close will likely define the trend for the weeks ahead.
Smart traders will wait for clear confirmation before committing.
A strong rejection means a potential reversal.
A confirmed breakdown means continuation of the trend.
#ACEUSDT #CryptoAnalysis #TechnicalAnalysis #PriceAction #AccumulationZone #TrendReversal #CryptoTrading #Altcoins #SwingTrade #SupportAndResistance #CryptoMarket
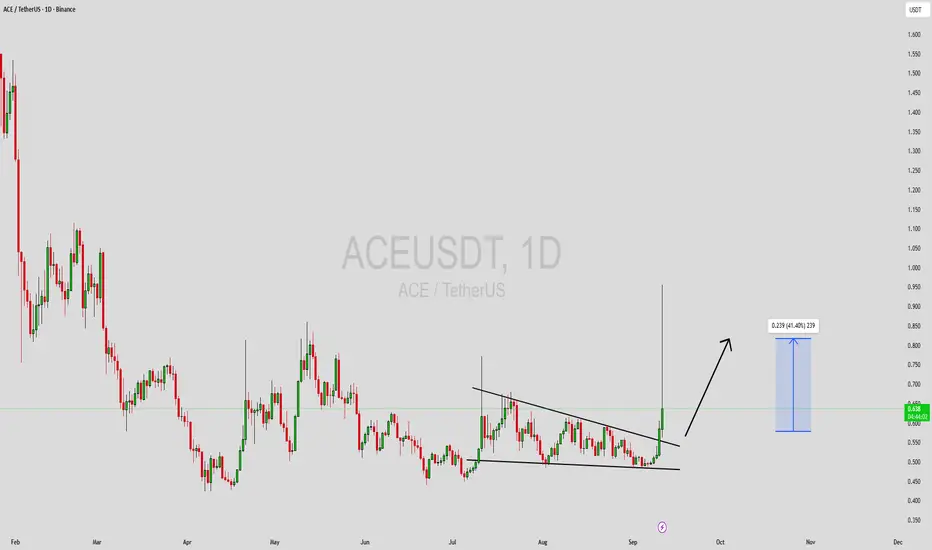
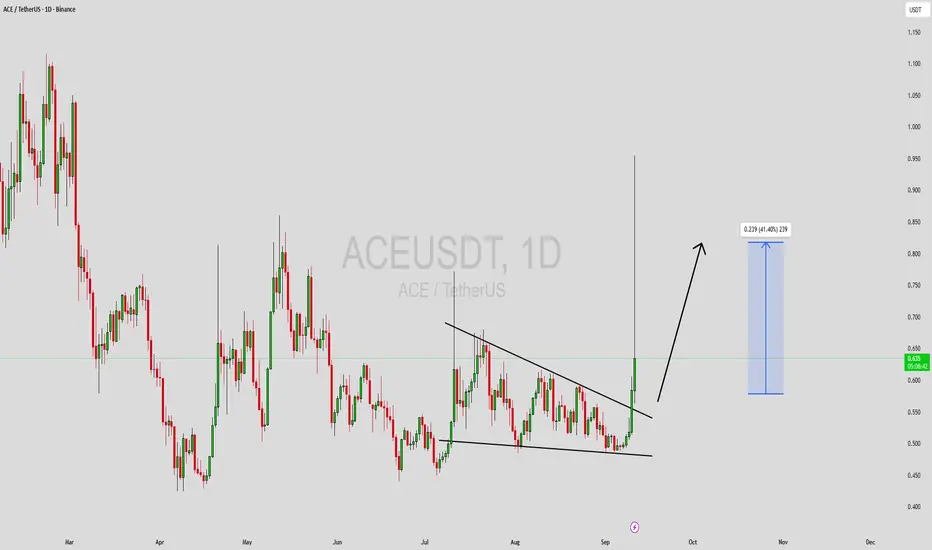
ACEUSDT Forming Falling WedgeACEUSDT is currently trading within a falling wedge pattern, a bullish technical setup that often precedes a reversal to the upside. This pattern forms as the price consolidates with lower highs and lower lows, but with diminishing bearish pressure. The narrowing price action signals that sellers are losing control while buyers are preparing to step in strongly. With good trading volume supporting the move, ACEUSDT is showing early signs of strength that could soon trigger a breakout.
The expected gain projection of 30% to 40%+ fits well with the wedge breakout scenario. Historically, falling wedge patterns combined with healthy volume often lead to significant price surges once resistance levels are breached. For ACEUSDT, a confirmed breakout could open the door to higher price zones, offering traders an opportunity to capitalize on short- to mid-term momentum.
Investor interest in this project is steadily growing, further adding confidence to the bullish outlook. Market sentiment and liquidity both indicate that ACEUSDT is gaining attention from both retail and institutional participants. This combination of technical and fundamental strength makes the pair an appealing setup for traders closely watching the crypto markets.
✅ Show your support by hitting the like button and
✅ Leaving a comment below! (What is You opinion about this Coin)
Your feedback and engagement keep me inspired to share more insightful market analysis with you!
ACE/USDT – Between Critical Support and Potential Rebound🔎 Overview
ACE/USDT is currently sitting at a make-or-break zone. After a prolonged decline from the $3.9 peak, the price has been consolidating for months inside the demand zone $0.425–$0.496.
This area has been tested multiple times since April 2025, making it a key historical support. The mid-term structure still shows lower highs (bearish), but the sideways action could evolve into either an accumulation base (bullish setup) or a distribution phase before a deeper breakdown.
---
📍 Key Levels
Critical Support Zone: $0.425 – $0.496 (yellow box)
Nearest Resistance: $0.654
Next Resistances: $0.783 – $1.051
Mid-term Targets: $1.915 – $2.267 – $2.641
Macro Resistance: $3.507 – $3.900
---
📈 Bullish Scenario
1. Trigger: Price holds above $0.425 and breaks out with a confirmed 2D close above $0.654.
2. Confirmation: Successful retest of $0.654 as new support + strong buying volume.
3. Upside Targets:
$0.654 (initial)
$0.783 (next)
$1.051 (conservative mid-term)
If momentum expands, recovery towards $1.9+ is on the table.
✨ Bullish Narrative: "The $0.425–$0.496 zone could act as an accumulation base where smart money positions quietly. A confirmed breakout could trigger a meaningful trend reversal."
---
📉 Bearish Scenario
1. Trigger: A 2D close below $0.425.
2. Immediate Impact: Breakdown of long-held demand → fast drop towards $0.30 (psychological zone).
3. Extended Risk: Continued selling pressure could drag price further into $0.20–$0.15 levels.
⚠️ Bearish Narrative: "If this multi-month support fails, confidence in the base collapses. A breakdown could extend the bearish cycle and push ACE much lower."
---
📊 Structure & Pattern
Sideways Base: Range-bound between $0.425–$0.65 → market indecision.
Multi-bottom retests: Repeated touches at $0.425–$0.496 strengthen the zone’s importance.
Lower highs: Bearish structure intact until higher highs are formed above $0.654–$0.783.
Reversal Confirmation: Only validated if price breaks out and sustains above key resistance with strong volume.
---
🎯 Conclusion
ACE is at a critical decision point:
Holding this zone → opens room for a rebound towards $0.65–$0.78.
Breaking below $0.425 → exposes downside risk towards $0.30 and potentially lower.
For traders, this area offers a favorable risk/reward setup if managed with strict stop losses and confirmed breakouts.
---
#ACE #ACEUSDT #Crypto #Altcoin #TechnicalAnalysis #SupportResistance #PriceAction #SwingTrade #RiskManagement
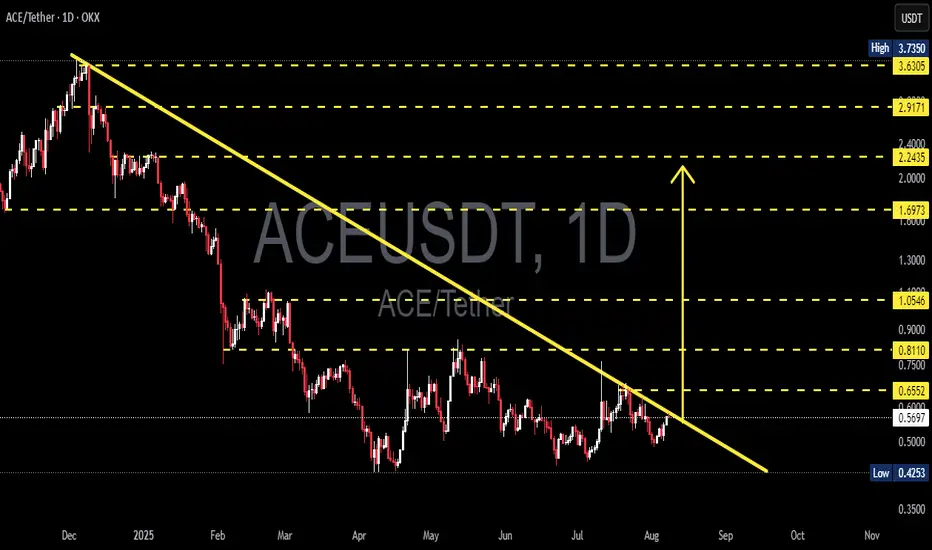
ACE/USDT Testing Long-Term Downtrend – Will It Break Out?Chart Overview:
The ACE/USDT pair on the 1D (Daily) timeframe is currently in a prolonged downtrend that has persisted since early 2025. The price has consistently formed lower highs, and it's been contained under a well-respected descending trendline (yellow line).
Currently, ACE is approaching a key decision point near the trendline resistance zone ($0.57–$0.60). What happens at this level will likely determine the next major move.
---
🟢 Bullish Scenario: Breakout Ahead?
If the price successfully breaks above the descending trendline and confirms with a daily close above $0.6552, we could see a trend reversal from bearish to bullish. Key resistance levels to watch for potential upside targets are:
1. $0.8110 – psychological and structural resistance
2. $1.0546 – strong previous resistance
3. $1.6973 – mid-term bullish target
4. $2.2435 and $2.9171 – extended bullish targets if momentum continues
Confirmation should be supported by increasing volume and RSI breaking above 50.
---
🔴 Bearish Scenario: Another Rejection?
If the price fails to break the trendline and gets rejected, ACE/USDT may resume its downward trajectory and test the following support levels:
1. $0.5691 – immediate support
2. $0.5000 – psychological support
3. $0.4253 – historical low and potential demand zone
This scenario would reaffirm continued bearish dominance and prolong the current downtrend.
---
📊 Pattern Analysis: Descending Trendline
The dominant pattern here is a descending resistance trendline, showing clear selling pressure and bearish market structure.
A breakout would signal the first major higher high in months – a potential trend reversal signal.
---
🎯 Conclusion & Strategy:
ACE is at a crucial inflection point.
Traders should wait for confirmation before entering a breakout trade.
If a breakout occurs, consider a buy-the-breakout strategy with a stop-loss below the trendline.
If rejected, a short/rejection play toward lower support zones could be viable.
#ACEUSDT #CryptoAnalysis #Altcoins #TechnicalAnalysis #BreakoutTrade #BearishScenario #BullishScenario #DescendingTrendline
ACE/USDT – Breaking Out of the Falling Wedge? Potential Reversal📝 Technical Analysis Overview:
The ACE/USDT pair on the daily timeframe (1D – Binance) is showing signs of a potential breakout from a long-standing falling wedge pattern, suggesting a possible trend reversal to the upside.
🔍 Key Technical Highlights:
1. Falling Wedge Pattern:
A clearly defined falling wedge has formed from the December 2024 peak near $3.742, down to the current consolidation zone between $0.425–$0.514.
This yellow support box represents a strong demand zone, with repeated price reactions since April 2025.
2. Major Support and Resistance Levels:
Strong Support: $0.425 – $0.514 (accumulation zone)
Potential Resistance / Upside Targets:
$0.622
$0.756
$1.053
$1.339
$1.703
$2.254
$2.882
$3.623 (just below the previous high at $3.742)
3. Bullish Breakout Scenario:
A confirmed breakout above the descending trendline and resistance at $0.622 could trigger a bullish move toward higher targets.
The first key breakout confirmation would be a daily close above $0.756 with increasing volume.
4. Early Signals & Validation:
A breakout with strong momentum followed by a successful retest of the trendline would validate the bullish setup.
Watch for high volume and candle structure during the breakout phase to avoid fakeouts.
📌 Summary:
ACE is currently testing the final stage of a bullish falling wedge. A successful breakout could lead to a strong trend reversal with targets beyond $1.0 and higher. This setup offers a good risk/reward opportunity for bullish traders—confirmation is key.

AUD/USD Trade Zone!Firstly, we are in a news market right now and news is everything to understanding price action.
After a busy international weekend, AUD/USD opened strong to the sell side. We got the first initial push down last week when Iran attacked Israel. Then, this weekend, Trump struck Iran.
With Trump striking Iran, markets opened bearish initially. After the good news of Iran and Israel coming to peace, we are seeing markets start to rebound a bit.
Where we are currently in the markets is a good structural spot to make some moves. The market has been following a downtrend structure following the Lower-Low, Lower-High pattern and we are currently at the next lower high if the market is going to respect its current market structure.
I am preparing for sells in an overbought market, which is unsure of future international tensions. I am either waiting for a structure break where the gold line indicates or for the market to respect the current structure to play to the low side.
I will be back with future updates.

ACEUSDT 1D AnalysisACE ~ 1D Analysis
#ACE is attempting to break through this resistance line. A full-body candle close above this resistance line will confirm a continued bullish trend with a minimum target of 10%+.

ACE (SPOT - INVEST )BINANCE:ACEUSDT
ACE / USDT
(4H + 1D) time frames
analysis tools
____________
SMC
FVG
Trend lines
Fibonacci
Support & resistance
MACD Cross
EMA Cross
______________________________________________________________
Golden Advices.
********************
* Please calculate your losses before any entry.
* Do not enter any trade you find it not suitable for you.
* No FOMO - No Rush , it is a long journey.
Useful Tags.
****************
My total posts
www.tradingview.com
AUD/USD Bullish Trade Set Up! A lot of Confirmation! Tap In Now!We are seeing AUD/USD rebound from a 4-day bearish push to .61300 to new highs around the .62000 level. The .62000 level has been holding strong as a resistance level; four separate times it has held the market below it.
It has now broken back above previous lows and is now retesting to the support line and is looking to move around the .61800 level.
We are also hovering between the 50 and 200 EMA levels, with the EMAs starting to converge.
Another sign we see is an inverse shoulder head shoulder on the 1 hour. The low of the right shoulder is the black box at .61700, and we don't want to see the market break below that point. If it breaks below the black low box, it is an indication of bearish strength.
Move Summary: We want to see it make a move to break through the .62000 level to break into more buy territory and create new highs. A break above the 200 EMA would be another signal for bullish confirmation. Our target will be the MONEY box for a 3:1 trade.
Like, Comment, and Follow if you agree with this Idea! Let's Connect!

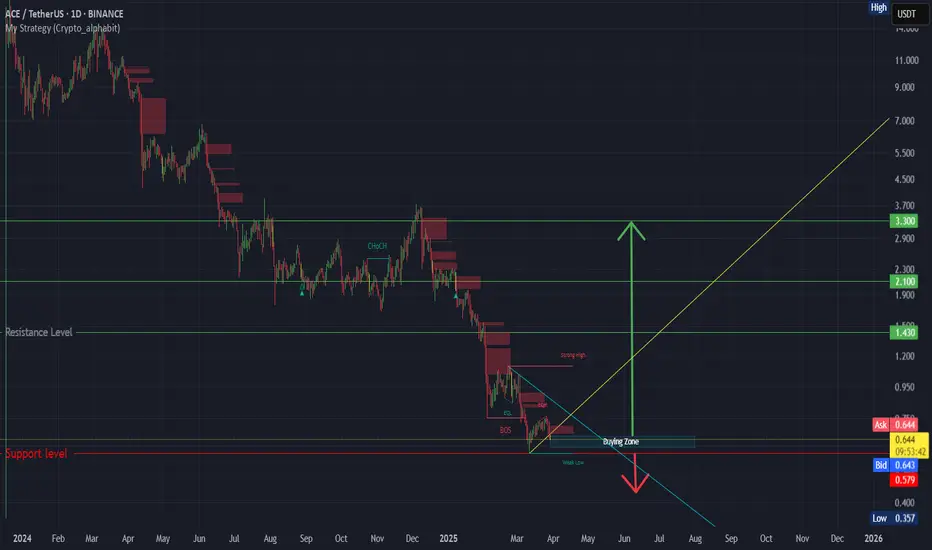
#ACE (SPOT) IN ( 1.700- 2.200) T.(8.000) SL(1.671)BINANCE:ACEUSDT
#ACE / USDT
Entry( 1.700- 2.200)
SL 1D close below 1.671
T1 3.300
T2 4.000
T3 4.800
T4 5.800
T5 8.000
______________________________________________________________
Golden Advices.
********************
* collect the coin slowly in the entry range.
* Please calculate your losses before the entry.
* Do not enter any trade you find it not suitable for you.
* No FOMO - No Rush , it is a long journey.
Useful Tags.
****************
My total posts
www.tradingview.com
**********************************************************************************************
#Manta #OMNI #DYM #AI #IO #XAI #ACE #NFP #RAD #WLD #ORDI #BLUR #SUI #VOXEL #AEVO #VITE #APE #RDNT #FLUX #NMR #VANRY #TRB #HBAR #DGB #XEC #ERN #ALT #IO #ACA #HIVE #ASTR #ARDR #PIXEL #LTO #AERGO #SCRT #ATA #HOOK #FLOW #KSM #HFT #MINA #DATA #SC #JOE #RDNT #IQ #CFX #BICO #CTSI #KMD #FXS #DEGO #FORTH #AST #PORTAL #CYBER #RIF #ENJ #ZIL #APT #GALA #STEEM #ONE #LINK #NTRN #COTI #RENDER #ICX #IMX #ALICE #PYR #PORTAL #GRT #GMT #IDEX #NEAR #ICP #ETH #QTUM #VET #QNT #API3 #BURGER #MOVR #SKL #BAND #ETHFI #SAND #IOTX #T #GTC #PDA #GMX #REZ #DUSK #BNX #SPELL #POWR #JOE #TIA #TFUEL #HOT #AVAX #WAXP #OGN #AXS #GALA #ONE #SYS #SCRT #DGB #LIT #QI #FIL

Trading opportunity for ACEUSDTBased on technical factors there is a Buy position in :
📊 ACEUSDT
🔵 Buy Now
🪫Stop loss 1.980
🔋Target 2.400
📏 R/R 1.8
💸RISK : 1%
We hope it is profitable for you ❤️
Please support our activity with your likes👍 and comments📝

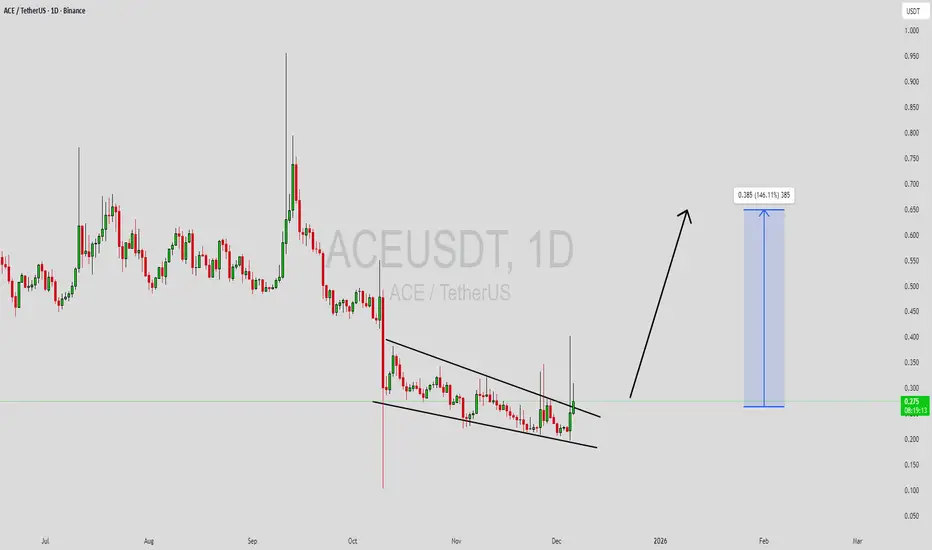
ACE LOOKS BULLISH (1D)It looks like it is going to finish the big C wave which is a triangle and enter the D wave.
Wave D is bullish.
We have two entry points marked on the chart.
The target can be the red box.
Closing a daily candle below the invalidation level will violate this analysis
For risk management, please don't forget stop loss and capital management
Comment if you have any questions
Thank You

ACE: Bullish Momentum Ready to Take Off! **🚀 ACE: Bullish Momentum Ready to Take Off! 📈🔥**
**Why You Shouldn’t Miss This Opportunity:**
ACE is showing **strong bullish momentum** across multiple timeframes, and the chart is loaded with powerful signals pointing to a **potential breakout**! Whether you're eyeing a **swing trade** or looking for a **BTST** play, this stock is primed for gains. Here's why:
**🔥 Key Technicals:**
- **Strong Bullish Candle**: Daily, Weekly, and Monthly charts all flashing **Long White Candles**, signaling bullish strength across the board!
- **RSI Breakout**: RSI at **65**, confirming strength and breaking key resistance.
- **Volume Surge**: A **volume breakout** confirms price action is supported with high interest.
- **Stochastic at 98** and **CCI at 152**: Overbought territory, but indicating strong upward pressure.
- **MACD Bullish**: Continuing to support the bullish trend.
- **Donchian Band**: A **new high** created—possibility of a **major breakout**.
- **Bollinger Bands**: Positive breakout, signaling further upward movement.
- **EMA 50**: Price trending up with a **bullish crossover** forming—short-term strength.
- **EMA 100 & 200**: Choppy markets, but the short-term trend remains strong.
**📅 Latest Signal:**
- **Long White Candle** patterns forming on **Daily**, **Weekly**, and **Monthly** charts.
- **Bullish Engulfing** pattern on the **Monthly** chart, reinforcing strong upward momentum.
**💥 Why It’s a Strong Pick:**
With a **technical rating of strong bullish**, ACE is gearing up for possible **short-term gains**. The breakout setup is confirmed by multiple bullish signals, and it's showing strength across both price and volume. Whether you’re a **swing trader** or looking to capitalize on **BTST** opportunities, ACE is one to watch!
**🚨 Take Action NOW:**
Don't let this breakout pass you by! Set your alerts, add ACE to your watchlist, and stay ahead of the curve.
👉 **Add ACE to your watchlist now** and position yourself for the next big move!
🔔 **Set your alerts** for the breakout, and get ready for possible upside!

Acent ( Ace )Ace usdt Daily analysis
Time frame daily
Risk rewards ratio >2.5 👈 👌
Target 0.006
Look at the chart. We have 3 resistance area shows by red boxes. In entrance we have 2 resistance boxes . Small box in big ones that makes strong resistance area.
But if Ace can break this 3 resistance boxes , it can pump to 0.15$ without any strong resistance. So 0.15$ is my second target

ACE Long 15m Sl -9.33%ACE Long Setup
Reason:
Strong Bullish Momentum.
Breakout Confirmation done on HTF
Resting in Golden Pocket.
All technical indicators Suggesting bullish Sign
Possible in very short term.
Best Regard,
Crypto Panda
BINANCE:ACEUSDT
BINANCE:ACEUSDT.P
BYBIT:ACEUSDT.P

ACEUSDT 1WACE ~ 2D
#ACE Back to retesting this support block. So far this support block continues to keep the price from falling lower. If you still have Conviction on this coin,. This support block would be a very good buying place for now. with a target of 20%++

ACEUSDT Trend Line Breakout!ACEUSDT Technical Analysis update
ACEUSDT is breaking its trend resistance line after 140 days of consolidation. Once the breakout is confirmed on the daily chart, we can expect a strong bullish move. The price has touched the 1.80 level multiple times and bounced back to resistance, but this time it has broken through the resistance line.

ACE Looks BullishOn a larger scale, ACE is inside a large diametrical, which is now at the end of wave C.
Wave C is a triangle.
By maintaining the green range and KEY level, it can move to the red box.
Closing a daily candle below the invalidation level will violate this analysis.
For risk management, please don't forget stop loss and capital management
Comment if you have any questions
Thank You
