#ACE/USDT Forming Bullish Momentum#ACE
The price is moving within a descending channel on the hourly timeframe. It has reached the lower boundary and is heading towards a breakout, with a retest of the upper boundary expected.
The Relative Strength Index (RSI) is showing a downward trend, approaching the lower boundary, and an upward bounce is anticipated.
There is a key support zone in green at 0.245. The price has bounced from this level several times and is expected to bounce again.
The indicator is showing a trend towards consolidation above the 100-period moving average, which we are approaching, supporting the upward move.
Entry Price: 0.251
Target 1: 0.261
Target 2: 0.273
Target 3: 0.287
Stop Loss: Below the green support zone.
Remember this simple thing: Money management.
For any questions, please leave a comment.
Thank you.
Acebtc

#ACE/USDT LONG#ACE
The price is moving in a descending channel on the 1-hour timeframe. It has reached the lower boundary and is heading towards breaking above it, with a retest of the upper boundary expected.
We have a downtrend on the RSI indicator, which has reached near the lower boundary, and an upward rebound is expected.
There is a key support zone in green at 0.270. The price has bounced from this zone multiple times and is expected to bounce again.
We have a trend towards stability above the 100-period moving average, as we are moving close to it, which supports the upward movement.
Entry price: 0.276
First target: 0.286
Second target: 0.298
Third target: 0.312
Stop loss: Below the support zone in green.
Don't forget a simple thing: capital management.
For inquiries, please leave a comment.
Thank you.

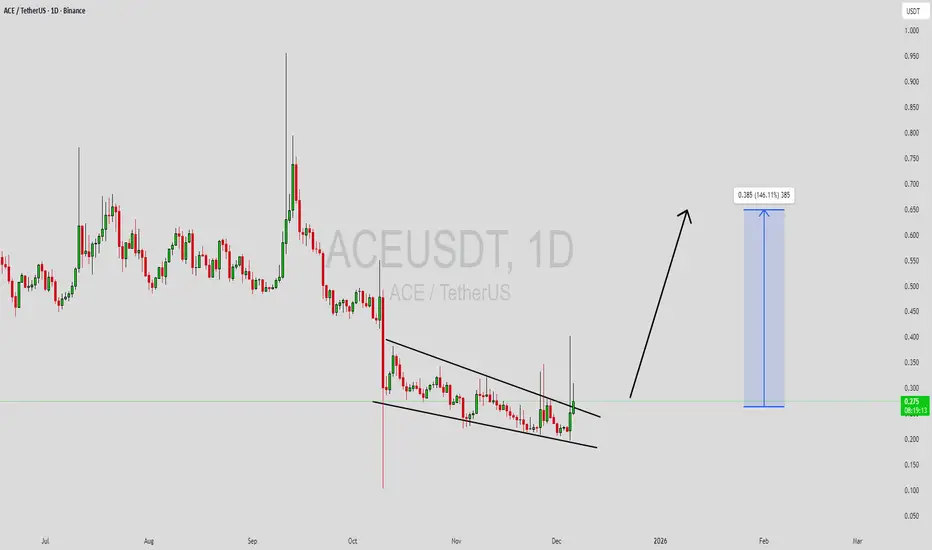
ACEUSDT Forming Falling WedgeACEUSDT is forming a clear falling wedge pattern, a classic bullish reversal signal that often indicates an upcoming breakout. The price has been consolidating within a narrowing range, suggesting that selling pressure is weakening while buyers are beginning to regain control. With consistent volume confirming accumulation at lower levels, the setup hints at a potential bullish breakout soon. The projected move could lead to an impressive gain of around 90% to 100% once the price breaks above the wedge resistance.
This falling wedge pattern is typically seen at the end of downtrends or corrective phases, and it represents a potential shift in market sentiment from bearish to bullish. Traders closely watching ACEUSDT are noting the strengthening momentum as it nears a breakout zone. The good trading volume adds confidence to this pattern, showing that market participants are positioning early in anticipation of a reversal.
Investors’ growing interest in ACEUSDT reflects rising confidence in the project’s long-term fundamentals and current technical strength. If the breakout confirms with sustained volume, this could mark the start of a fresh bullish leg. Traders might find this a valuable setup for medium-term gains, especially as the wedge pattern completes and buying momentum accelerates.
✅ Show your support by hitting the like button and
✅ Leaving a comment below! (What is your opinion about this Coin?)
Your feedback and engagement keep me inspired to share more insightful market analysis with you!
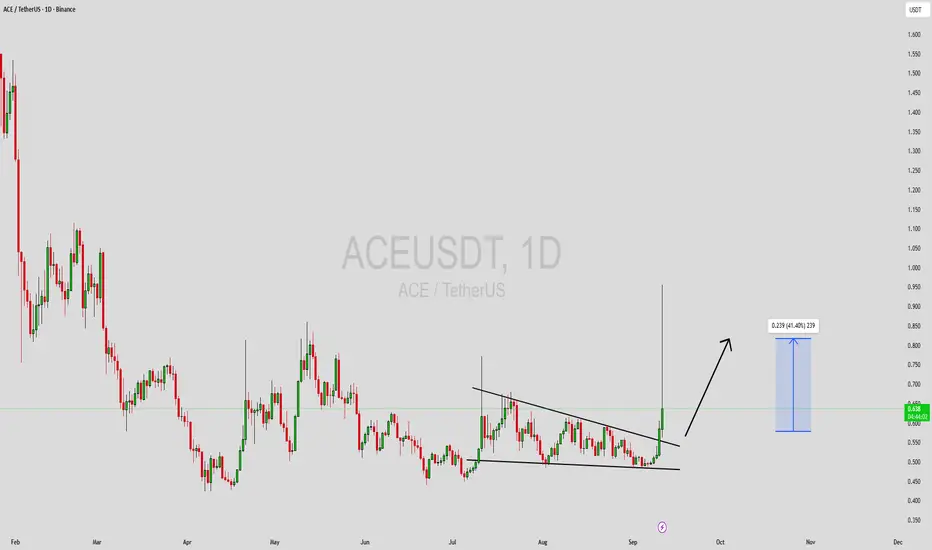
ACEUSDT Forming Falling WedgeACEUSDT is currently trading within a falling wedge pattern, a bullish technical setup that often precedes a reversal to the upside. This pattern forms as the price consolidates with lower highs and lower lows, but with diminishing bearish pressure. The narrowing price action signals that sellers are losing control while buyers are preparing to step in strongly. With good trading volume supporting the move, ACEUSDT is showing early signs of strength that could soon trigger a breakout.
The expected gain projection of 30% to 40%+ fits well with the wedge breakout scenario. Historically, falling wedge patterns combined with healthy volume often lead to significant price surges once resistance levels are breached. For ACEUSDT, a confirmed breakout could open the door to higher price zones, offering traders an opportunity to capitalize on short- to mid-term momentum.
Investor interest in this project is steadily growing, further adding confidence to the bullish outlook. Market sentiment and liquidity both indicate that ACEUSDT is gaining attention from both retail and institutional participants. This combination of technical and fundamental strength makes the pair an appealing setup for traders closely watching the crypto markets.
✅ Show your support by hitting the like button and
✅ Leaving a comment below! (What is You opinion about this Coin)
Your feedback and engagement keep me inspired to share more insightful market analysis with you!
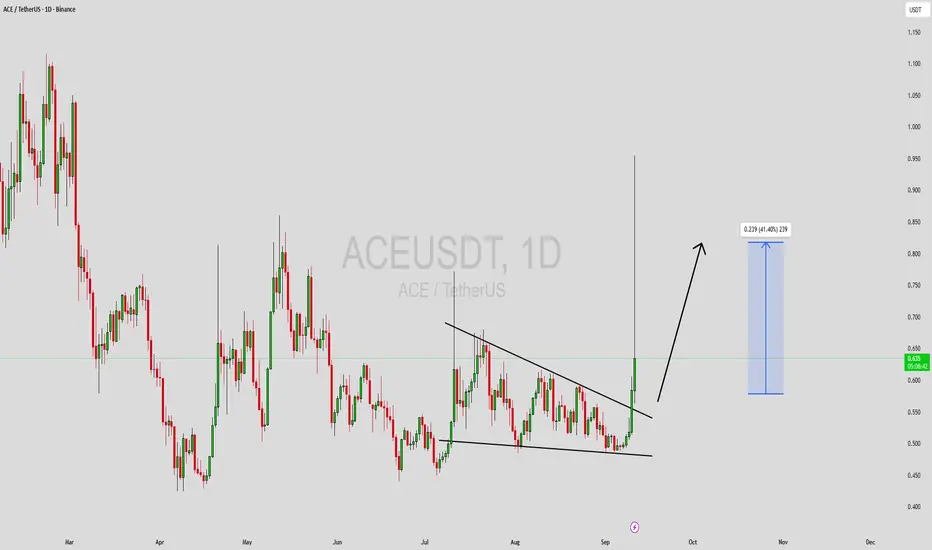
ACEUSDT Forming Falling WedgeACEUSDT is currently trading within a falling wedge pattern, a bullish technical setup that often precedes a reversal to the upside. This pattern forms as the price consolidates with lower highs and lower lows, but with diminishing bearish pressure. The narrowing price action signals that sellers are losing control while buyers are preparing to step in strongly. With good trading volume supporting the move, ACEUSDT is showing early signs of strength that could soon trigger a breakout.
The expected gain projection of 30% to 40%+ fits well with the wedge breakout scenario. Historically, falling wedge patterns combined with healthy volume often lead to significant price surges once resistance levels are breached. For ACEUSDT, a confirmed breakout could open the door to higher price zones, offering traders an opportunity to capitalize on short- to mid-term momentum.
Investor interest in this project is steadily growing, further adding confidence to the bullish outlook. Market sentiment and liquidity both indicate that ACEUSDT is gaining attention from both retail and institutional participants. This combination of technical and fundamental strength makes the pair an appealing setup for traders closely watching the crypto markets.
✅ Show your support by hitting the like button and
✅ Leaving a comment below! (What is You opinion about this Coin)
Your feedback and engagement keep me inspired to share more insightful market analysis with you!
ACE LOOKS BULLISH (1D)It looks like it is going to finish the big C wave which is a triangle and enter the D wave.
Wave D is bullish.
We have two entry points marked on the chart.
The target can be the red box.
Closing a daily candle below the invalidation level will violate this analysis
For risk management, please don't forget stop loss and capital management
Comment if you have any questions
Thank You

ACE Looks BullishOn a larger scale, ACE is inside a large diametrical, which is now at the end of wave C.
Wave C is a triangle.
By maintaining the green range and KEY level, it can move to the red box.
Closing a daily candle below the invalidation level will violate this analysis.
For risk management, please don't forget stop loss and capital management
Comment if you have any questions
Thank You

ACE looks bullishIt seems that wave E of the ACE diametric has ended and the price is entering wave F of this diametric.
By maintaining the green range, it can move towards the red box.
Closing a daily candle below the invalidation level will violate this analysis.
For risk management, please don't forget stop loss and capital management
Comment if you have any questions
Thank You

ACE looks bearishFrom where we placed the red arrow on the chart, the ACE correction has started.
The pattern seems to be a diametric and we are now at the end of wave D.
By maintaining the red range, it can enter the E wave.
The targets are clear on the chart.
Closing a daily candle above the invalidation level will violate the analysis
For risk management, please don't forget stop loss and capital management
When we reach the first target, save some profit and then change the stop to entry
Comment if you have any questions
Thank You

#ACE/USDT#ACE
The price is moving within a bearish channel on a 12-hour frame and is strongly committed to it.
We have a support area at 4.40 and we bounced from it at the lower border of the channel
We have a tendency to stabilize above the Moving Average 100
We have an upward trend on the RSI indicator that supports the rise and gives greater momentum
Entry price is 5.50
First target 6.45
Second goal 7.47
Third goal 8.57

#ACE/USDT#ACE
The price is moving in a horizontal triangle for 1 day and we have a green support area at level 11
We have a higher stability moving average of 100
Now we have a nice breakout coming up
Our RSI indicator has a well reliable upward trend
Entry price is 12.26
First target 13.71
Second goal 15.12
Third goal 17

#ACEUSDT LONG#ACE
The price has been moving in a downward channel since December 20, 2023
The price is expected to bounce up again and break the pattern upward
In successive upward waves
Current price 9.10
First goal 9.54
Second goal 10.54
Third goal 11.88

#ACE/USDT#ACE
The price is moving in a bearish channel on the 4-hour frame
Currently, we have touched the upper border of the channel, and some correction is expected
We have oversold conditions on the MACD indicator
Entry price is 8.00
The first target is 8.85
The second goal is 10.277
Third goal 11.81

ACEUSDT Resistance Breakout!ACEUSDT Technical analysis update
ACE price has broken through its trend resistance line and is currently trading above its 100 and 200-day EMAs. This could indicate a potential uptrend
Buy zone : Below $9.34
Stop loss : $8.75
Regards
Hexa

ACEUSDT Technical Analysis
⏳ Spot
💎 ACEUSDT has formed asymmetrical triangle. After the breakout it is expected to go for a Pullback and retest the support zone. After the Bullish setup forms we can open or trades.
🌐 Tradingview
💵 Invest Only 5% of your Portfolio
🎳 Entry Now or from 0.14650 to 0.12529
☕️ TP1 0.16537
🍺 TP2 0.19186
🍻 TP3 0.22971
🍾 TP4 0.28042
🍷 TP5 0.34000
🍸 TP6
🍹 TP7
🎁 TP8
🚫 SL 0.12529 to 0.11188
Good Luck 🎲
Check the Links in Description and If you LIKE this analysis, Please support our page and Ideas by hitting the LIKE 👍 button. ❤️ Your Support is really appreciated! ❤️
Traders, if you have your own opinion about it, please write your own in the comment box. We will be glad for this.
Feel free to request any pair/instrument analysis or ask any questions in the comment section below.
We will have more FREE forecasts in TradingView soon
Have a profitable day 😊👍🏻

Ace - Good TradeACE Browser is rated above Chrome and Brave. Worth taking a small risk with this super micro cap token.
