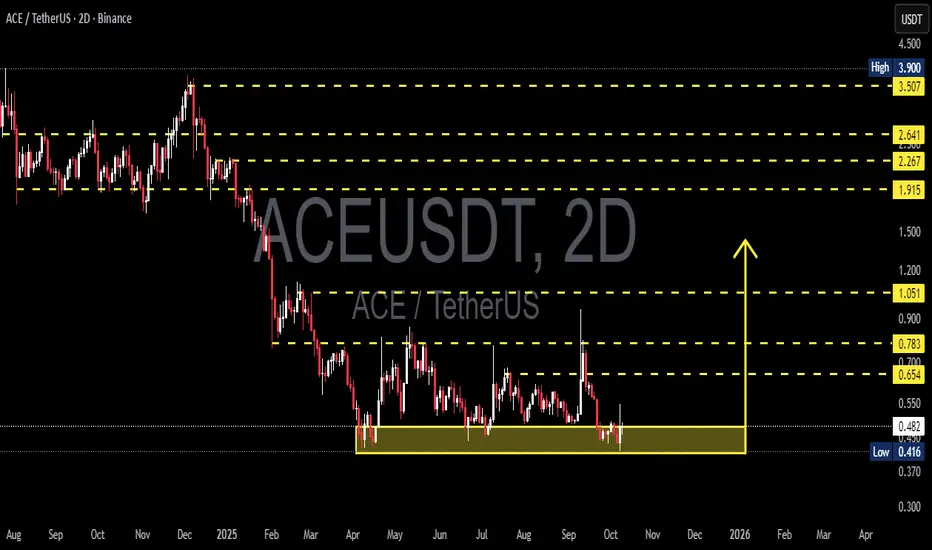
ACE/USDT — Accumulation Zone! Bulls for a Major Reversal?ACE is currently trading above its key demand zone between 0.416 and 0.479 USDT — an area that has consistently absorbed selling pressure throughout 2025.
Each touch of this yellow zone has produced a strong rebound and long lower wicks, signaling aggressive accumulation by buyers or larger market participants.
After a prolonged downtrend from the 3.9 USDT level, price has entered a sideways structure, forming a potential accumulation base — a typical setup that often precedes a major trend reversal.
---
Pattern & Structure Overview:
Primary Trend: Long-term bearish.
Current Phase: Accumulation/sideways range.
Key Demand Zone: 0.416–0.479 USDT (yellow box).
Nearest Resistance Levels: 0.654 → 0.783 → 1.051 → 1.915.
Volume Behavior: Low at the base, with spikes on rallies — hinting at smart money accumulation.
---
Bullish Scenario:
If ACE can hold above the yellow zone and confirm a 2D close above 0.654 USDT with a noticeable volume surge, this could spark a strong reversal rally toward 0.783 → 1.051 → 1.915.
A breakout above these levels would mark a structural shift from distribution to accumulation — the early stage of a bullish trend.
🎯 Bullish Targets:
T1 → 0.654
T2 → 0.783
T3 → 1.051
T4 (extension target) → 1.915
📈 Bullish Narrative:
This accumulation phase could be the calm before the storm — if demand continues to build, ACE may deliver a sharp upside move that catches the market off guard.
---
Bearish Scenario:
If the price breaks down below 0.416 with a clean 2D close and strong selling volume, it would confirm a continuation of the bearish trend.
In that case, ACE may extend its decline toward the psychological zone below 0.38 USDT or even lower, depending on market sentiment.
📉 Bearish Narrative:
Losing this critical demand zone would expose the market to another leg down — turning the current range into a failed accumulation and confirming further weakness.
---
Strategic Takeaway:
ACE is now at a critical inflection point — where accumulation could transform into a new bullish phase, or failure could resume the macro downtrend.
This 0.416–0.479 zone is the battlefield between bulls and bears, and the next decisive 2D candle close will likely define the trend for the weeks ahead.
Smart traders will wait for clear confirmation before committing.
A strong rejection means a potential reversal.
A confirmed breakdown means continuation of the trend.
#ACEUSDT #CryptoAnalysis #TechnicalAnalysis #PriceAction #AccumulationZone #TrendReversal #CryptoTrading #Altcoins #SwingTrade #SupportAndResistance #CryptoMarket
Acesignals
ACE/USDT Testing Long-Term Downtrend – Will It Break Out?Chart Overview:
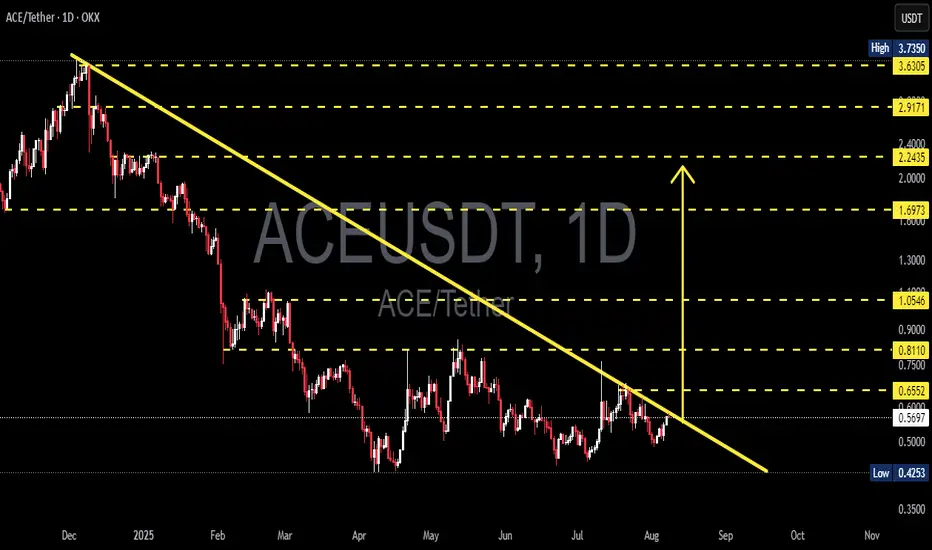
The ACE/USDT pair on the 1D (Daily) timeframe is currently in a prolonged downtrend that has persisted since early 2025. The price has consistently formed lower highs, and it's been contained under a well-respected descending trendline (yellow line).
Currently, ACE is approaching a key decision point near the trendline resistance zone ($0.57–$0.60). What happens at this level will likely determine the next major move.
---
🟢 Bullish Scenario: Breakout Ahead?
If the price successfully breaks above the descending trendline and confirms with a daily close above $0.6552, we could see a trend reversal from bearish to bullish. Key resistance levels to watch for potential upside targets are:
1. $0.8110 – psychological and structural resistance
2. $1.0546 – strong previous resistance
3. $1.6973 – mid-term bullish target
4. $2.2435 and $2.9171 – extended bullish targets if momentum continues
Confirmation should be supported by increasing volume and RSI breaking above 50.
---
🔴 Bearish Scenario: Another Rejection?
If the price fails to break the trendline and gets rejected, ACE/USDT may resume its downward trajectory and test the following support levels:
1. $0.5691 – immediate support
2. $0.5000 – psychological support
3. $0.4253 – historical low and potential demand zone
This scenario would reaffirm continued bearish dominance and prolong the current downtrend.
---
📊 Pattern Analysis: Descending Trendline
The dominant pattern here is a descending resistance trendline, showing clear selling pressure and bearish market structure.
A breakout would signal the first major higher high in months – a potential trend reversal signal.
---
🎯 Conclusion & Strategy:
ACE is at a crucial inflection point.
Traders should wait for confirmation before entering a breakout trade.
If a breakout occurs, consider a buy-the-breakout strategy with a stop-loss below the trendline.
If rejected, a short/rejection play toward lower support zones could be viable.
#ACEUSDT #CryptoAnalysis #Altcoins #TechnicalAnalysis #BreakoutTrade #BearishScenario #BullishScenario #DescendingTrendline
ACE/USDT – Breaking Out of the Falling Wedge? Potential Reversal📝 Technical Analysis Overview:
The ACE/USDT pair on the daily timeframe (1D – Binance) is showing signs of a potential breakout from a long-standing falling wedge pattern, suggesting a possible trend reversal to the upside.
🔍 Key Technical Highlights:
1. Falling Wedge Pattern:
A clearly defined falling wedge has formed from the December 2024 peak near $3.742, down to the current consolidation zone between $0.425–$0.514.
This yellow support box represents a strong demand zone, with repeated price reactions since April 2025.
2. Major Support and Resistance Levels:
Strong Support: $0.425 – $0.514 (accumulation zone)
Potential Resistance / Upside Targets:
$0.622
$0.756
$1.053
$1.339
$1.703
$2.254
$2.882
$3.623 (just below the previous high at $3.742)
3. Bullish Breakout Scenario:
A confirmed breakout above the descending trendline and resistance at $0.622 could trigger a bullish move toward higher targets.
The first key breakout confirmation would be a daily close above $0.756 with increasing volume.
4. Early Signals & Validation:
A breakout with strong momentum followed by a successful retest of the trendline would validate the bullish setup.
Watch for high volume and candle structure during the breakout phase to avoid fakeouts.
📌 Summary:
ACE is currently testing the final stage of a bullish falling wedge. A successful breakout could lead to a strong trend reversal with targets beyond $1.0 and higher. This setup offers a good risk/reward opportunity for bullish traders—confirmation is key.

ACEUSDT 1D AnalysisACE ~ 1D Analysis
#ACE is attempting to break through this resistance line. A full-body candle close above this resistance line will confirm a continued bullish trend with a minimum target of 10%+.

#ACE (SPOT) IN ( 1.700- 2.200) T.(8.000) SL(1.671)BINANCE:ACEUSDT
#ACE / USDT
Entry( 1.700- 2.200)
SL 1D close below 1.671
T1 3.300
T2 4.000
T3 4.800
T4 5.800
T5 8.000
______________________________________________________________
Golden Advices.
********************
* collect the coin slowly in the entry range.
* Please calculate your losses before the entry.
* Do not enter any trade you find it not suitable for you.
* No FOMO - No Rush , it is a long journey.
Useful Tags.
****************
My total posts
www.tradingview.com
**********************************************************************************************
#Manta #OMNI #DYM #AI #IO #XAI #ACE #NFP #RAD #WLD #ORDI #BLUR #SUI #VOXEL #AEVO #VITE #APE #RDNT #FLUX #NMR #VANRY #TRB #HBAR #DGB #XEC #ERN #ALT #IO #ACA #HIVE #ASTR #ARDR #PIXEL #LTO #AERGO #SCRT #ATA #HOOK #FLOW #KSM #HFT #MINA #DATA #SC #JOE #RDNT #IQ #CFX #BICO #CTSI #KMD #FXS #DEGO #FORTH #AST #PORTAL #CYBER #RIF #ENJ #ZIL #APT #GALA #STEEM #ONE #LINK #NTRN #COTI #RENDER #ICX #IMX #ALICE #PYR #PORTAL #GRT #GMT #IDEX #NEAR #ICP #ETH #QTUM #VET #QNT #API3 #BURGER #MOVR #SKL #BAND #ETHFI #SAND #IOTX #T #GTC #PDA #GMX #REZ #DUSK #BNX #SPELL #POWR #JOE #TIA #TFUEL #HOT #AVAX #WAXP #OGN #AXS #GALA #ONE #SYS #SCRT #DGB #LIT #QI #FIL

ACEUSDT 1WACE ~ 2D
#ACE Back to retesting this support block. So far this support block continues to keep the price from falling lower. If you still have Conviction on this coin,. This support block would be a very good buying place for now. with a target of 20%++
