ACH/USDT — Multi-Year Support Zone, Bounce or Breakdown?🔎 Overview
ACH/USDT is currently consolidating within a multi-year demand zone around ~0.01811 (highlighted in yellow). This level has acted as a strong support multiple times, producing significant reactions whenever price touched it.
However, each bounce from this area has been weaker than the last, forming lower highs — a clear sign of persistent selling pressure. Structurally, this resembles a descending triangle, where sellers are consistently pushing from above while buyers defend the same support zone.
This puts ACH at a critical crossroads:
Will buyers defend the support again and trigger a strong rebound?
Or will sellers finally break it down, opening the path toward new lows?
---
📌 Key Technical Levels
Main demand zone (support): 0.01811
Next supports if breakdown: 0.01400 → 0.00950 → historical low 0.00720
Major resistances (bullish targets):
0.02263
0.02867
0.03441
0.04075
0.04500
0.05059
---
📈 Bullish Scenario
Trigger: Weekly close above 0.02263 or a confirmed breakout from the lower-high structure.
Implication: Buyers successfully defend the multi-year demand zone and regain short-term control.
Targets: 0.02867 → 0.03441 → 0.04075 → 0.05059
Note: A sustainable breakout will require strong buying volume; otherwise, it risks being another failed rally.
---
📉 Bearish Scenario
Trigger: Weekly close below the 0.01811 demand zone.
Implication: Descending triangle confirms to the downside, signaling potential mid-term breakdown.
Targets: 0.01400 → 0.00950 → possibly retesting the historical low at 0.00720.
Note: A breakdown here could trigger capitulation, since this zone has long been a critical stronghold for buyers.
---
📊 Pattern & Sentiment
Dominant pattern: Descending Triangle (neutral-to-bearish bias).
Short-term sentiment: Neutral, awaiting reaction at the demand zone.
Mid-term sentiment: Bearish leaning, as repeated tests of support increase breakdown risk.
Catalysts: A broader crypto market recovery (BTC/ETH rally) could fuel upside, while weak market conditions may accelerate a breakdown.
---
📌 Conclusion
ACH/USDT is standing at a make-or-break zone. The multi-year support around 0.01811 is the last stronghold for buyers. A solid bounce could spark rallies toward 0.02867 and higher, but if the support breaks, a deep correction toward the historical lows near 0.00720 becomes likely.
Strategy:
Bullish traders: Wait for confirmed weekly breakout & retest.
Bearish traders: Watch for a confirmed weekly breakdown below 0.01811.
Neutral traders: Stay patient, as this zone may define ACH’s direction for the coming months.
---
#ACHUSDT #ACH #AlchemyPay #Crypto #Altcoin #ChartAnalysis #TechnicalAnalysis #SupportResistance #DescendingTriangle #BreakoutOrBreakdown
Achusdc

ACH/USDT at a Historical Pivot Zone — Is a Major Reversal🔍 In-Depth Weekly Chart Analysis of ACH/USDT
ACH/USDT is currently retesting a critical historical demand zone between $0.01876 – $0.02263, which has consistently acted as a major accumulation area since late 2022. This zone has served as the launchpad for multiple bullish moves in the past and is now being tested once again.
Interestingly, price action appears to be forming a long-term consolidation base, potentially a triple bottom pattern or a classic accumulation phase, which often precedes significant impulsive rallies.
✅ Bullish Scenario (High-Probability Reversal)
If price successfully:
1. Holds above $0.01876, and
2. Breaks above minor resistances at $0.02263 and $0.02867
Then a bullish reversal is likely, with price targeting the following resistance levels:
🔸 $0.02867 — structural resistance
🔸 $0.03441 — neckline zone of the accumulation pattern
🔸 $0.04075 — key psychological level
🔸 $0.05059 — full measured move target from the base pattern
Should momentum and market sentiment align, ACH could even test the $0.065–$0.098 range, especially if volume supports a breakout continuation.
Key confirmation: A weekly close above $0.02867 with strong volume would signal a clear breakout from accumulation.
❌ Bearish Scenario (Breakdown from Critical Support)
On the flip side, if price fails to hold:
A weekly breakdown and close below $0.01876 will invalidate the bullish structure.
This could lead to a decline toward:
$0.01400 — minor support
$0.01000 – $0.00720 — historical bottom zone
This would likely reflect a capitulation phase, particularly if accompanied by negative macro sentiment across the broader crypto market.
📈 Technical Pattern Structure
📌 Triple Bottom + Long-Term Accumulation = Early Reversal Signal
📌 Multiple rejections off the support zone = Buyer defense still strong
📌 Increasing volume near lows = Signs of smart money accumulation
📌 Formation of higher lows in the coming weeks will reinforce bullish momentum
💬 Market Psychology Insight
After prolonged sideways action, many retail traders tend to exit
This creates ideal conditions for smart money to accumulate quietly
A breakout from this zone could trigger mass FOMO, accelerating price action
🧠 Conclusion
ACH/USDT currently offers a highly attractive risk-to-reward setup, especially for swing traders and medium-term investors. The zone being tested is a make-or-break level that could dictate the next major trend. A confirmed breakout could mark the beginning of a powerful expansion phase.
#ACHUSDT #CryptoAnalysis #AltcoinReversal #BullishSetup #TechnicalAnalysis #TripleBottom #BreakoutTrade #SwingTradeOpportunity #CryptoOpportunities

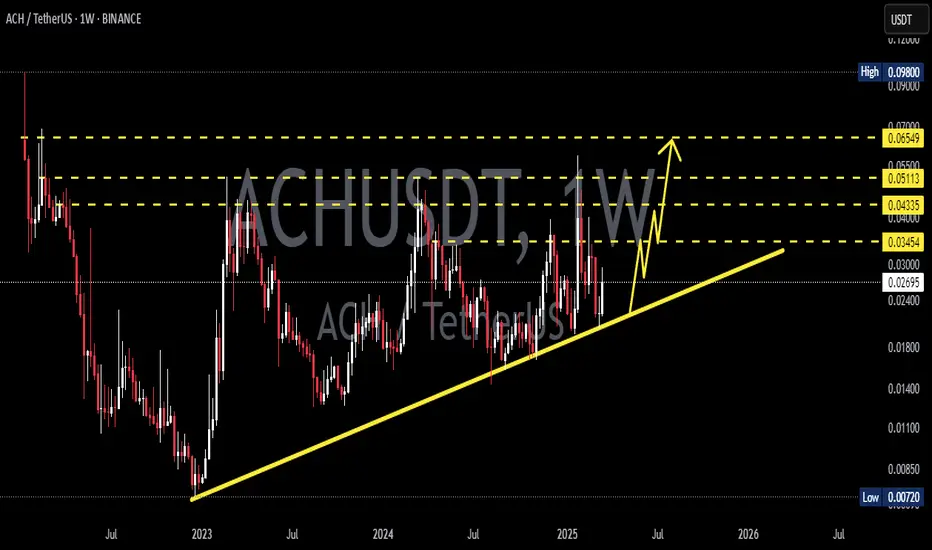
ACHUSDT 1W AnalysisACH ~ 1W Analysis
#ACH This trade is very high risk. Buy from here if you still have confidence in this coin with a short term target of 20%+.

ACHUSDT 1WACH ~ 1W Analysis
#ACH This coin is still in a bullish trend. Buy when re -testing this support with a short -term target of at least 15%+.