ACTUSDT UPDATE#ACT
UPDATE
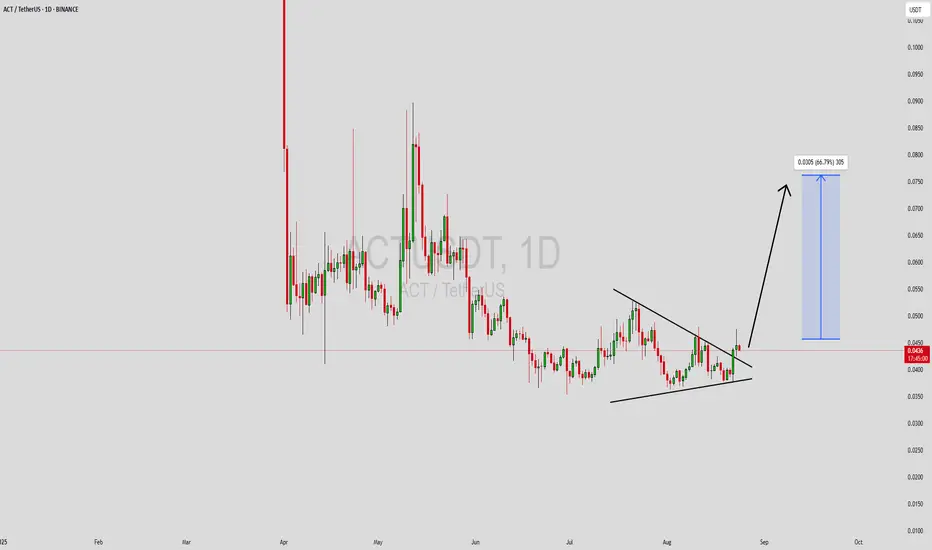
ACT Technical Setup
Pattern: Bullish Falling Wedge Pattern
Current Price: $0.00542
Target Price: $0.00760
Target % Gain: 40.29%
NASDAQ:ACT is breaking out of a falling wedge pattern on the 1D timeframe. Current price is $0.00542 with a target near $0.00760, showing about 40% potential upside. The breakout confirms bullish momentum with structure favoring continuation. Always use proper risk management.
Time Frame: 1D
Risk Management Tip: Always use proper risk management.
ACTBTC

ACTUSDT Forming Bullish PennantACTUSDT is showing a bullish pennant pattern on the charts, which is typically considered a continuation signal of upward momentum. After a strong upward move, the price is now consolidating within a tight range, forming a pennant structure. This kind of setup often precedes another breakout to the upside, backed by good trading volume and renewed market confidence.
The current volume activity suggests that buyers are maintaining control, and a breakout from this formation could lead to a significant rally. With expectations of a 50% to 60%+ gain, ACTUSDT is positioning itself as a strong candidate for traders looking for short- to mid-term bullish opportunities. Investors should closely monitor resistance zones, as a confirmed breakout above them could fuel rapid price expansion.
Market interest in ACTUSDT has been rising, with more traders recognizing its technical strength. As momentum builds and the pennant nears completion, volatility could increase, giving investors opportunities to benefit from sharp price movements. The alignment of bullish technical patterns with growing investor participation creates a favorable environment for sustained growth.
✅ Show your support by hitting the like button and
✅ Leaving a comment below! (What is You opinion about this Coin)
Your feedback and engagement keep me inspired to share more insightful market analysis with you!
#ACT/USDT#ACT
The price is moving in a descending channel on the 1-hour frame and is expected to continue upwards
We have a trend to stabilize above the moving average 100 again
We have a descending trend on the RSI indicator that supports the rise by breaking it upwards
We have a support area at the lower limit of the channel at a price of 0.1923
Entry price 0.2150
First target 0.2240
Second target 0.2345
Third target 0.2488

ACT ANALYSIS (4H)ACT is in a major correction. This correction is a large-degree diametric. It now appears to have entered the bearish G wave.
The price is pulling back into zones where sell orders exist to complete wave G.
A daily candle closing above the invalidation level will invalidate this analysis.
For risk management, please don't forget stop loss and capital management
Comment if you have any questions
Thank You

ACT | These Pumps are Fun?PumpFun & Meme Mania
ACT is a meme token operating on the Solana blockchain, initially launched on Pumpfun and endorsed by AI. ACT stands out by reimagining user interactions with AI, moving beyond the traditional one on one assistant model to establish a collaborative peer network.
The current price of Act I: The AI Prophecy is $0.62, reflecting a 25% increase in the past 24 hours thanks to Binance listings. ACT has a circulating supply of 948.25 million tokens, with a maximum supply of 1 billion.The token was first issued on October 19 and has been hovering around a $20 million market cap over the weekend.
The token's 24 hour trading volume is $977 million, and it is actively traded across 28 markets and 20 exchanges, with Binance being the most prominent.Currently, Act I: The AI Prophecy holds a 0.02% share of the total cryptocurrency market, boasting a market capitalization of $616 million
In this cycle, meme tokens dominate and create extreme volatility, as their creators are often already planning the next meme project. Remember to set a stop-loss and avoid going all-in!
Which meme coins are you bullish on?
