ACT/USDT — End of the Downtrend or the Start of a New Rally?ACT is sitting at one of its most critical moments in months. After being trapped in a brutal multi-month downtrend, price is finally pushing into the main descending trendline, a level that has rejected every bullish attempt since late 2024.
If this wall breaks, the entire market structure for ACT could shift.
---
✨ What’s Really Happening on the Chart?
1. The Multi-Month Downtrend Is Losing Strength
The descending yellow trendline has been the dominant resistance for nearly a year. Now, however:
Candles are getting smaller
Volatility is compressing
Selling pressure is fading
Price is moving sideways near resistance
This is classic behavior of a late-stage downtrend, right before one of two outcomes:
A major breakout — or
A final capitulation drop.
---
✨ Pattern in Play: A Compression Falling Wedge
The current structure resembles a falling wedge compression, one of the strongest classical reversal setups because:
Historically bullish
Breakouts often move fast
Targets align perfectly with existing supply zones
Key upside targets are already visible:
0.03420
0.05198
0.08290
These levels are the logical destinations if a breakout confirms.
---
📈 BULLISH SCENARIO — (High-Probability Reversal Setup)
A bullish reversal becomes meaningful only if:
✔ Price closes above the descending trendline on the 2D timeframe
This signals the first real shift in control.
✔ Successful retest → price bounces from the breakout zone
This is usually the safest entry.
✔ Volume expands during breakout
No volume = high risk of a fakeout.
If these conditions align, ACT could rally toward:
🎯 0.03420
🎯 0.05198
🎯 0.08290
These are the structural targets derived from the wedge breakout.
---
📉 BEARISH SCENARIO — (If the Trendline Rejects Again)
If price once again fails to break the trendline:
Downtrend remains intact
Lower prices become likely
Momentum stays bearish
Critical support zones:
⚠ 0.015 → 0.010
Losing this range opens the door toward:
⚠ Historical Low: 0.00601
This is the ultimate downside if capitulation returns.
---
💡 Core Takeaway
ACT is sitting exactly at its decision point:
Breakout = a new trend and strong upside momentum.
Rejection = continuation of the long-term downtrend.
The descending yellow trendline is the key to everything.
---
#ACTUSDT #ACT #CryptoBreakout #TrendReversal #AltcoinWatch #PriceAction #CryptoAnalysis #ChartPattern #FallingWedge
ACTUSDT

ACTUSDT UPDATE#ACT
UPDATE
ACT Technical Setup
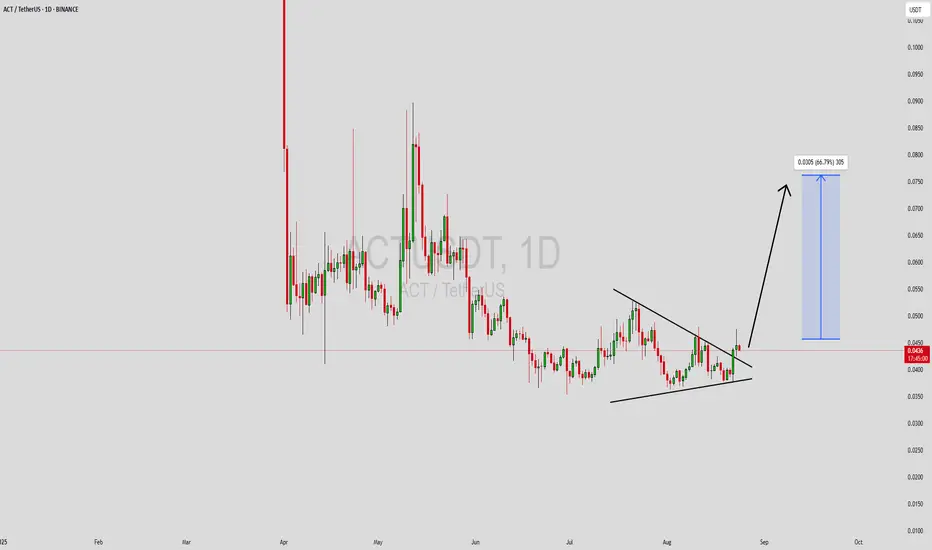
Pattern: Bullish Falling Wedge Pattern
Current Price: $0.00542
Target Price: $0.00760
Target % Gain: 40.29%
NASDAQ:ACT is breaking out of a falling wedge pattern on the 1D timeframe. Current price is $0.00542 with a target near $0.00760, showing about 40% potential upside. The breakout confirms bullish momentum with structure favoring continuation. Always use proper risk management.
Time Frame: 1D
Risk Management Tip: Always use proper risk management.

$ACT Ignite the Comeback! Thrilling 4-Hour Trading SetupBINANCE:ACTUSDT
NASDAQ:ACT Ignite the Comeback! Thrilling 4-Hour Trading Setup
Price Action Description
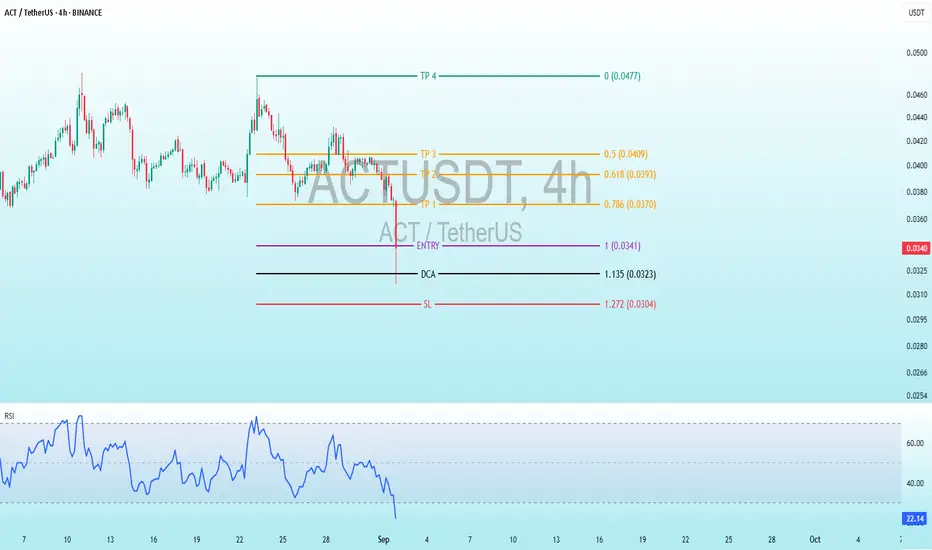
Historical Trend: The price began around 0.04-0.05 USDT in mid-August, with a gradual decline punctuated by choppy movements. A sharp drop occurred in early September, pushing it toward the current level of 0.0341 USDT.
Recent Movement: A significant red candlestick around September 2 marks a drop from approximately 0.05-0.06 USDT to 0.0341 USDT (current price), suggesting strong selling pressure or a market event. The price has stabilized near this low, with smaller candles hinting at consolidation.
Current Price: Approximately 0.0341 USDT, down about 30-40% from mid-August highs, suggesting potential oversold conditions.
Volatility: High, as evident from the long wicks and large candle bodies during the recent drop, though volume data is not visible.
Key Technical Levels
Entry: Set at 0.0341 USDT, the suggested point to enter a long position, matching the current price of 0.0341 USDT, indicating an immediate buy opportunity.
TP (Take Profit): Targets are 0.0370 USDT for the first profit take, followed by 0.0393 USDT, 0.0409 USDT, and the highest goal at 0.0477 USDT, providing a range of exit points for potential gains.
DCA: Positioned at 0.0322 USDT, a level to add to the trade if the price dips slightly, helping to average down the entry cost.
SL (Stop Loss): Placed at 0.0316 USDT, the cutoff to exit the trade if the price falls, limiting losses and protecting the position.
Fibonacci Context: These levels likely derive from a Fibonacci retracement or extension tool applied to the recent drop from 0.05-0.06 USDT to 0.0341 USDT, suggesting a potential reversal zone for a long setup.
Risk-Reward: Risk from 0.0341 to 0.0316 is 0.0025 USDT, with rewards to 0.0370 (0.0029, RR 1.16:1) and up to 0.0477 (0.0136, RR ~5.44:1), indicating a favorable setup if the bounce occurs.
Indicators Analysis
RSI (Relative Strength Index): Current value is 22.36, below 30, signaling oversold conditions and a potential rebound. The line has trended downward sharply with the recent drop, showing momentum weakening, but no clear bullish divergence yet. The RSI scale (0-100) marks overbought above 70, not relevant here.
Potential Trading Implications and Risks
Bullish Case: The setup suggests a bottom-fishing opportunity post-drop, supported by oversold RSI. A rebound to take-profit levels is plausible if the broader crypto market stabilizes or if positive news emerges for Achain (e.g., network upgrades).
Bearish Case: The recent sharp decline and lack of immediate recovery indicate ongoing selling pressure. Breaking below 0.0316 (SL) could lead to further declines toward 0.03 USDT or lower.
Risks: High volatility due to ACT’s lower market cap, lack of volume data (limiting liquidity insight), and subjective Fib levels. Use risk management (e.g., 1-2% account risk).
Suggestions: Confirm with bullish patterns (e.g., hammer) at 0.0341 or RSI crossing above 30.
ACTUSDT Forming Bullish PennantACTUSDT is showing a bullish pennant pattern on the charts, which is typically considered a continuation signal of upward momentum. After a strong upward move, the price is now consolidating within a tight range, forming a pennant structure. This kind of setup often precedes another breakout to the upside, backed by good trading volume and renewed market confidence.
The current volume activity suggests that buyers are maintaining control, and a breakout from this formation could lead to a significant rally. With expectations of a 50% to 60%+ gain, ACTUSDT is positioning itself as a strong candidate for traders looking for short- to mid-term bullish opportunities. Investors should closely monitor resistance zones, as a confirmed breakout above them could fuel rapid price expansion.
Market interest in ACTUSDT has been rising, with more traders recognizing its technical strength. As momentum builds and the pennant nears completion, volatility could increase, giving investors opportunities to benefit from sharp price movements. The alignment of bullish technical patterns with growing investor participation creates a favorable environment for sustained growth.
✅ Show your support by hitting the like button and
✅ Leaving a comment below! (What is You opinion about this Coin)
Your feedback and engagement keep me inspired to share more insightful market analysis with you!
ACTUSDT Forming Classic Falling Wedge ACTUSDT is currently exhibiting a classic falling wedge pattern on the chart—a bullish reversal setup known for its high probability of a breakout to the upside. After a consistent downtrend, the price action has started to compress within converging trendlines, suggesting that selling pressure is diminishing. A breakout above the wedge's resistance line could trigger a sharp price surge. Technical traders often look to such formations for potential entries, especially when combined with growing volume and renewed market sentiment.
Volume analysis reveals a notable uptick in recent sessions, signaling that investors are beginning to accumulate ACTUSDT. This increased interest could be due to fundamental news or broader market momentum returning to altcoins. When volume expands near the apex of a falling wedge, it usually reinforces the validity of the pattern and strengthens the breakout potential. With this setup, the projected move points to a possible gain of 140% to 150%, aligning with previous key resistance levels that the price could retest post-breakout.
On a momentum front, indicators like RSI and MACD are starting to turn bullish, offering early signs of a reversal. The price is also holding above short-term support zones, suggesting the formation of a base. The combination of technical structure, volume dynamics, and improving sentiment makes ACTUSDT a strong contender for a breakout move in the near term. Such opportunities are especially attractive in trending markets where capital rotates quickly into coins showing strong chart setups.
Given this confluence of bullish signals, ACTUSDT could become a leading performer in the altcoin space over the coming weeks. Traders and investors are advised to keep a close watch for breakout confirmation and subsequent retest levels, which could offer optimal entry points for both short-term gains and medium-term swing setups.
✅ Show your support by hitting the like button and
✅ Leaving a comment below! (What is You opinion about this Coin)
Your feedback and engagement keep me inspired to share more insightful market analysis with you!

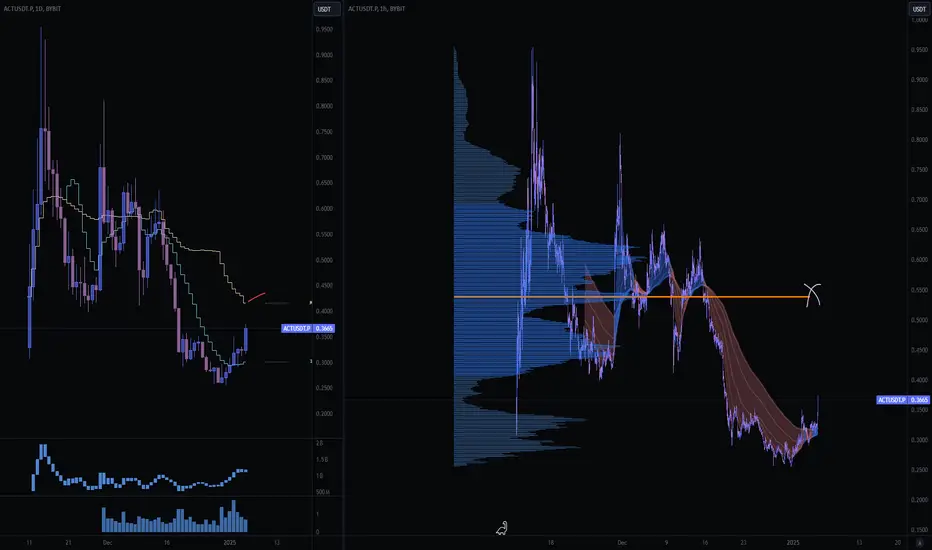
Public trade #5 - #ACT price analysis ( Act I: The AI Prophec )Nowadays, the #ACT coin is quite hype.
And most platforms display the OKX:ACTUSDT chart as circled above.
What do you think of this full price chart of #ACTUSDT presented by us?)
Scary, isn't it?)
👀 We are going to watch this asset for now #ActITheAIProphecy
And we would dare to buy not earlier than if the price falls into the Buy zone $0.024 - $0.036 - $0.048
_____________________
Did you like our analysis? Leave a comment, like, and follow to get more

The AI Prophecy: Marketwide Bullishness ProofThis is a chart and pair that I showed you recently. Why am I showing it to you again?
This is the proof.
The Altcoins market is bullish and the Altcoins market can only be bullish when Bitcoin is either growing or set to grow.
Notice the last five days, how did Bitcoin perform?
When Bitcoin crashes, everything crashes but, look at this divergence between Bitcoin and many Altcoins.
Look at the last five days for ACTUSDT, or many others, and what do you see?
➖ This pair remains strong and trading above EMA13.
➖ This pair is super-bullish, above a consolidation pattern and ready to grow.
➖ This pair broke out of a downtrend is now ready to move up.
This and other Altcoins cannot grow while Bitcoin goes down toward 40K, that's not how Bitcoin/Crypto works.
The market grows when Bitcoin grows.
What this chart reveals is a hidden bullish bias, the bottom is already in. We are going up now.
Hold patiently. Feel secure and feel safe because Cryptocurrency is set to grow like never before.
Thanks a lot for your continued support.
Namaste.

#ACT/USDT#ACT
The price is moving in a descending channel on the 1-hour frame and is expected to continue upwards
We have a trend to stabilize above the moving average 100 again
We have a descending trend on the RSI indicator that supports the rise by breaking it upwards
We have a support area at the lower limit of the channel at a price of 0.1923
Entry price 0.2150
First target 0.2240
Second target 0.2345
Third target 0.2488

ACTUSDT 1WACT ~ 1W Analysis
#ACT Buy after successfully penetrating this resistance line, with a short -term target of at least 15%+.
Reason, The seller's pressure seems to have been completed.

ACT ANALYSIS (4H)ACT is in a major correction. This correction is a large-degree diametric. It now appears to have entered the bearish G wave.
The price is pulling back into zones where sell orders exist to complete wave G.
A daily candle closing above the invalidation level will invalidate this analysis.
For risk management, please don't forget stop loss and capital management
Comment if you have any questions
Thank You

ACT ANALYSIS📊 #ACT Analysis
✅There is a formation of Descending Channel Pattern in daily chart. Currently #ACT is in bearish way.
After a breakout of the pattern and major resistance level we would see a bullish momentum otherwise the price will drop more 🧐
👀Current Price: $0.1968
⚡️What to do ?
👀Keep an eye on #ACT price action and volume. We can trade according to the chart and make some profits⚡️⚡️
#ACT #Cryptocurrency #Breakout #TechnicalAnalysis #DYOR

ACT Coin NEXT POSSIBLE MOVES AND TRADE SETUPS !!NASDAQ:ACT Coin Update & Next Possible Moves!!
• Right now NASDAQ:ACT Coin price trading in a falling wedge on 1D Tf & overall structure look bearish.
• but once its break its resistance trendline then minimum 30% bounce back expected.
• Let's see what happened.
Warning : That's just my analysis DYOR Before taking ant action🚨

Trading opportunity for ACTUSDTBased on technical factors there is a Sell position in :
📊 ACTUSDT
🔴 Sell Now
🪫Stop loss 0.238000
🔋Target 0.114000
📏 R/R 2
💸RISK : 1%
We hope it is profitable for you ❤️
Please support our activity with your likes👍 and comments📝

$ACT - Long SetupAltcoins have been down so bad from their highs, but I'm still expecting high volatility this week.
Just taking this one with a tight stoploss just below 0.15 (low)
Long at current market price (cmp) , dca level at 0.165
Targets:
tp1 - 0.20
tp2 - 0.25
tp3 - 0.32

Trading opportunity for ACTUSDTBased on technical factors there is a Buy position in :
📊 ACTUSDT
🔵 Buy Now
🪫Stop loss 0.243000
🔋Target 0.287000
📏 R/R 2
💸RISK : 1%
We hope it is profitable for you ❤️
Please support our activity with your likes👍 and comments📝

ACTUSDT 12HACT ~ 12H
#ACT If you still have Conviction on the coin,. This support block would be a very good buying place for now.

ACTUSDT UPDATEACTUSDT is a cryptocurrency trading at $0.4312. Its target price is $0.8000, indicating a potential 100%+ gain. The pattern is a Falling Wedge, which is a reversal pattern. This suggests that the downward trend may be coming to an end. A breakout from the Falling Wedge could lead to a strong upward move. The current price may be a buying opportunity. Investors are optimistic about ACTUSDT's future performance. Reaching the target price would result in significant returns. The Falling Wedge pattern is a bullish signal, indicating a potential trend reversal. This could be a lucrative investment opportunity.

ACT - LONG - Good opportunityACT is now ready to give us a chance. Despite being a little late it is still in a good place for daily timeframe. This is a moderate risk trade, as we have a small confirmation and good support. These currencies are also very volatile and high leverage should not be used.
TP 1: 0.42
TP 2: 0.58
TP 3: 0.63 (It's not very likely, but it could be).
SL 1: 0.2368
SL 2: 0.21
-
First trade of 2025, have a happy new year.

ACTUSDT (ACT I) Updated till 05-01-25ACTUSDT (ACT I) Daily timeframe range. PA is fairly new here if it can stay above 0.2530 it got huge chances of good trades. there is fundamental support too. for now if PA can break 0.4169 clean than it can push toward 0.6714 or above.

$ACT - Scalp Long SetupACT is showing signs of recovery and gaining traction, suggesting it might be ready for another upward move.
ACT has shown signs of potential growth, having deviated slightly on its previous low at .40
If we can hold .35 support, we can potentially retest this previous low.
Long Entry: at cmp .36 to .34
Stop below .30
Potential Long targets:
.40-.42 (m_evwap)
.50-.54 (npoc/hvn)
.60-.64 (w_vwap)
ACT COIN PRICE ANALYSIS AND NEXT POSSIBLE MOVES!!NASDAQ:ACT Coin!!
• 2 major areas where we can expect now potential bounce back in its price🥷
• On First Support Don't Build trade without SL🚨
Warning : That's just my analysis DYOR Before Taking any trade.

ActFirst support 0.29241
Second support 0.29121
First target 0.94833
Second target 1.35358
If you enter at 0.29121
You can get 360% profit in one month
Act ready for toch 1.35$

actMy general opinion is to buy in the green box and then the blue lines, but in the short term, the turquoise and purple lines can be checked for a short-term stop.
