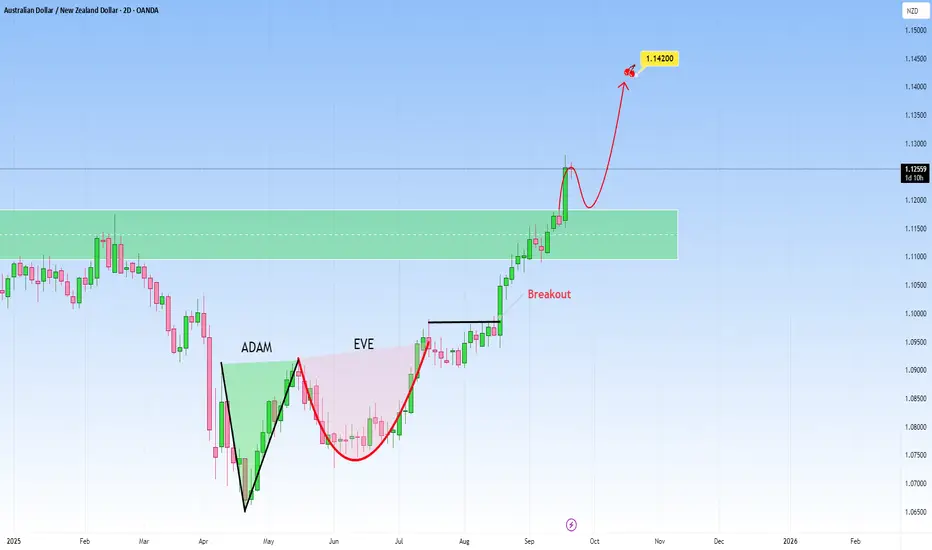
AUDNZD looking to continue after Adam & Eve Pattern formed.AUDNZD broke through an important resistance zone recently. Previously I anticipated a rejection here, but the market pushed straight through instead:
And now it looks to go higher after an Adam & Eve pattern formed. With its catchy name, the Adam and Eve pattern is one of the easiest to remember. And I will explain below why and how to spot it easily.
The Adam pattern is marked by a sharp downward move, a quick rebound, forming a “V” shape on the chart. Tall, pointed and aggressive! More "masculine" so to say.
The Eve, on the other hand, develops more gradually. Price rounds out into a wider, smoother bottom before rising again, creating a shape similar to the letter “U.” Softer, curvier, more feminine.
Combined, these two create the Adam and Eve pattern, a formation that often signals a potential trend reversal. Especially if it's combined with fundamental analysis or other strong technical.
It sticks in your memory once you connect the shapes with the male–female correlation. An unforgettable pattern, really.
Adamandevepattern
DXY Adam & Eve PatternThe DXY has broken its parabolic trend that it has been on for months now, forming a very clear Adam & Eve pattern. The measured move for this pattern indicates a highly likely break of the simple trend as well. (Yellow line)
This could be very good for all asset classes for the short term.
**This is my opinion, based on chart data. This is not financial advice.**

HNT bullish double bottom patternHello Traders,
Here is a nice set up on HNT. This coin has been a consistent winner the times that I have been trading it and tends to be a big runner too when it gets moving. As of recently HNT has broken a large downtrend falling wedge, retested this trend and formed a reversal pattern of an Adam and Eve. This is a double bottom pattern with structure showing that the bulls have came in at a level they are buying at and bears are getting exhausted at the second attempt to break it down. Once the resistance is broken this would be a great entry point and the first target being the next resistance. If that resistance is broken you will be able to get a higher target out of this one.
Keep in mind this is only my opinion and you should be doing your own due diligence in researching your investments. That said, I hope my idea has brought you closer to your own!
Have a green week!
Savvy

Adam & Eve Bottom on BTCUSDThe pattern was formed at 15min on BTCUSD, with confirmation close to $56.600. Target price for the next movement after the confirmation will be around $58.800, following the 70% price rule for breakouts of this pattern

Adam & Eve Bottom on FET/BTC #Fet $FET #FetchAIYou can see we have developed what appears to be an Adam & Eve Bottom on our FET chart . What's an Adam & Eve Bottom you might ask? Let's look at our 12 hour chart and see! Our first bottom happened about a month ago with that sharp V formation you see with the red V . Many of us thought it was gonna be an Inverse Head & Shoulders pattern but Crypto can change quickly ! Not all patterns play out . But you can clearly see we've made another more rounded Bottom now at the same sat range . This is the Eve Bottom you see on the chart with the curved blue line under it. This is a Bullish pattern and I expect upside here. There is a Neckline area you can see on the chart in the 1200 area and this is an obvious target ( though there will be steps along the way ) , and will also take us up through the Ichimoku cloud ( and that's Bullish too . ) So an Adam & Eve Bottom will be a pattern involving a first V shaped bottom followed ( probably a month later ) by a more rounded bottom in the very near same price area but with a neckline rise in-between . The distance from the neckline to the bottom is how much you add on top of the neckline to get a target . And again we see a probable target area in the 1900 sat area . I would love to see that happen . Maybe by end of July we see this beautiful upward rise ! Let's see . Wishing all the best to the FET Community !
