Adani Ports - 12/14 month base Breakout in ProgressAdani Ports is retesting the ₹1,485–₹1,500 zone after a 12–14-month rounding base between ₹1,050 and ₹1,500. A breakout could unlock a 30% upside potential toward ₹1,900 based on measured-move projection.
This pattern can be seen in multi timeframes (Daily and Weekly). RSI 60+;
Break below ₹1,365 on volume would negate the breakout setup.
Disclaimer:
Not financial advice. Educational analysis for charting reference only.
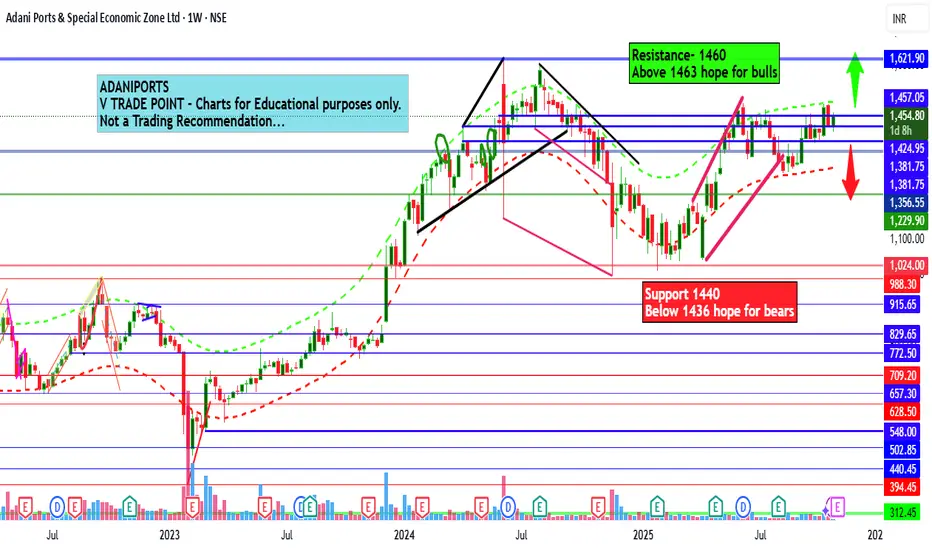
ADANIPORTS

Review and plan for 27th November 2025 Nifty future and banknifty future analysis and intraday plan.
This video is for information/education purpose only. you are 100% responsible for any actions you take by reading/viewing this post.
please consult your financial advisor before taking any action.
----Vinaykumar hiremath, CMT

ADANIPORTS Ltd for 30th Oct #ADANIPORTS ADANIPORTS Ltd for 30th Oct #ADANIPORTS
Resistance 1460 Watching above 1463 for upside momentum.
Support area 1440 Below 1450 gnoring upside momentum for intraday
Watching below 1436 for downside movement...
Above 1450 ignoring downside move for intraday
Charts for Educational purposes only.
Please follow strict stop loss and risk reward if you follow the level.
Thanks,
V Trade Point
ADANIPORTS 2Hour Time frameADANIPORTS 2-Hour Snapshot
Current Price: ₹1,388.90
Previous Close: ₹1,380.90
Day Range: ₹1,385.00 – ₹1,404.90
52-Week Range: ₹995.65 – ₹1,494.00
Volume: 2,553,605
VWAP: ₹1,392.82
Market Cap: ₹300,065 Cr
🔎 Technical Indicators
Relative Strength Index (RSI): Neutral
Moving Averages:
50-period: ₹1,385.28 — Negative
100-period: ₹1,368.32 — Negative
200-period: ₹1,260.96 — Positive
Moving Average Convergence Divergence (MACD): -14.67 — Negative
Stochastic Oscillator: 39.95 — Neutral
📈 Market Sentiment
Pivot Points:
Resistance: ₹1,327.20
Support: ₹1,305.85
📅 Outlook
Bullish Scenario: A breakout above ₹1,327.20 could signal a move toward ₹1,350.00.
Bearish Scenario: A drop below ₹1,305.85 may lead to further downside.
Overall Bias: Neutral, with mixed signals from moving averages and momentum indicators.

USDJPY 2Hour Time frameUSD/JPY 2-Hour Snapshot
Current Price: 147.46 JPY
Change: +0.05% from the previous close
Market Cap: Not applicable
P/E Ratio: Not applicable
EPS: Not applicable
Intraday High: 147.59 JPY
Intraday Low: 147.27 JPY
🔎 Technical Indicators
RSI (14): Neutral
MACD: Neutral
Moving Averages:
5-period SMA: Not available
10-period SMA: Not available
20-period SMA: Not available
50-period SMA: Not available
📈 Market Sentiment
Pivot Points:
R1: Not available
R2: Not available
R3: Not available
S1: Not available
S2: Not available
S3: Not available
📅 Outlook
Bullish Scenario: A breakout above the current price could lead to further gains.
Bearish Scenario: A drop below the current price may test support levels.
Overall Bias: Neutral, with mixed signals from moving averages and momentum indicators.

ADANIPORTS : LOOKING FOR A POTENTIAL BOUNCE!🚀 ADANIPORTS Trade Idea - Daily Chart 📈
Looking for a potential bounce!
🛡️ Price: Around 1128 INR (currently) - Consider scaling in if it reaches the "Target at Wave C (intermediate wave)" zone of 1051-1094 INR.
🎯 Target 1: 1341-1372 INR (Wave C target zone)
🎯 Target 2: 1474 INR (Second Target)
🛑 Stop-Loss: Day close below 1051 INR
🤔 Why this trade?
✅ Extended retracement suggests potential support/reversal zone.✅ Approaching Wave C target zone - potential strong support.✅ Potential for a good Risk/Reward.
💡 Pro Tip: The chart highlights a "New demand Zone at extended retracement zone" and a "Retracement zone for Wave B." If the price dips further, watch for strong buying volume or bullish candlestick patterns within the 1051-1094 INR zone as confirmation of a reversal before entering. Consider using a smaller initial position size and adding to it if the price shows strength within the zone.
⚠️ Risk/Reward Calculation (Example - You MUST calculate your own based on YOUR entry):
Let's assume entry at 1072 INR (midpoint of the Wave C target zone) and the defined stop-loss of 1051 INR:
Potential Gain ( Target 1 - using midpoint ): 1356 - 1072 = 284 INR
Potential Loss: 1072 - 1051 = 21 INR
Risk/Reward Ratio ( Target 1 ): 284 / 21 = Approximately 13.5:1
Potential Gain ( Target 2 ): 1474 - 1072 = 402 INR
Risk/Reward Ratio ( Target 2 ): 402 / 21 = Approximately 19.1:1
🙏 Important:
⚠️ This is just an idea, not financial advice.😟 Trading has risks – you could lose money.🧐 Do your own research before making any trades.

Can a Corporate Titan Withstand the Tremors of Allegations?In the high-stakes arena of global business, few narratives captivate the imagination quite like the meteoric rise and sudden turbulence of an economic powerhouse. The Adani Group once celebrated as a paragon of Indian entrepreneurial success, now finds itself navigating treacherous waters of legal scrutiny and market skepticism. What began as a remarkable journey of a diamond trader turned infrastructure magnate has transformed into a complex tale of ambition, power, and potential corporate misconduct that challenges our understanding of success in the modern economic landscape.
The allegations against Gautam Adani—ranging from securities fraud to a purported massive bribery scheme—represent more than just a corporate challenge; they symbolize a pivotal moment of reckoning for corporate governance in emerging markets. With U.S. prosecutors indicting Adani and a damaging report by Hindenburg Research accusing the group of "the largest con in corporate history," the conglomerate has witnessed a staggering $68 billion evaporation of market value. This precipitous fall from grace serves as a stark reminder that even the most seemingly invincible corporate empires can be vulnerable to the harsh light of forensic scrutiny and legal investigation.
The unfolding saga transcends the individual narrative of Gautam Adani, touching upon broader themes of economic development, political connections, and the delicate balance between entrepreneurial ambition and ethical conduct. As the Adani Group confronts these unprecedented challenges, the world watches with bated breath, understanding that the outcome will not merely determine the fate of one business empire, but potentially reshape perceptions of India's economic credibility on the global stage. The resilience, transparency, and response of the Adani Group in the face of these allegations will serve as a critical case study in corporate accountability and the complex interplay between business, politics, and regulatory oversight.
Ultimately, this narrative invites us to reflect on the fundamental principles of corporate integrity and the thin line between visionary entrepreneurship and potential systemic manipulation. As investors, policymakers, and global observers, we are compelled to ask: Can reputation, built over decades, withstand the seismic tremors of serious allegations? The Adani Group's journey offers a compelling, real-time exploration of this profound question, challenging our assumptions about success, power, and the intricate mechanisms that govern global business ecosystems.

Quick Update on Nifty and BankNifty after Hindenburg reportHello Traders,
Checkout the latest update on Nifty and BankNifty after Hindenburg report on SEBI chairperson and Adani

ADANIPORTS INR 1,587.85 TO 19,689 INR IN 12 YEAR FORWARDSGot bored today ! thinking of doing some analysis reports for Adani ports curiously He ha :)

Adani Ports Approaching Key Resistance Level
Adani Ports is nearing a crucial resistance at 1613.50.
Potential bullish breakout observed.
Strong uptrend sustained since October 2023.
Positive Q1 results could fuel further upward momentum.
RSI close to 70, indicating strength but approaching overbought territory.

ADANI PORTSIt appears that Adani Ports is currently approaching the support level of 1450. It is expected to experience an upward movement from this level.

Adani Ports Trade IdeaAdani Ports gave a good breakout from the horizontal trendline. The re test candle has close above the TL which is another good indication.
With Adani replacing Wipro in Sensex, it should make a good up side move.
Entry at current price

Double Moving Averages Crossover Swing Trade📊 Script: RAILTEL
📊 Sector: Telecomm-Service
📊 Industry: Telecommunications - Service Provider
⏱️ C.M.P 📑💰- 433
🟢 Target 🎯🏆 - 475
⚠️ Stoploss ☠️🚫 - 415
📊 Script: TATASTEEL
📊 Sector: Steel
📊 Industry: Steel - Large
⏱️ C.M.P 📑💰- 174
🟢 Target 🎯🏆 - 183
⚠️ Stoploss ☠️🚫 - 170
📊 Script: SUZLON
📊 Sector: Capital Goods - Electrical Equipment
📊 Industry: Electric Equipment
⏱️ C.M.P 📑💰- 44
🟢 Target 🎯🏆 - 48
⚠️ Stoploss ☠️🚫 - 42
📊 Script: ADANIPORTS
📊 Sector: Marine Port & Services
📊 Industry: Miscellaneous
⏱️ C.M.P 📑💰- 1385
🟢 Target 🎯🏆 - 1454
⚠️ Stoploss ☠️🚫 - 1361
📊 Script: MTARTECH
📊 Sector: Aerospace & Defense
📊 Industry: Engineering
⏱️ C.M.P 📑💰- 2110
🟢 Target 🎯🏆 - 2231
⚠️ Stoploss ☠️🚫 - 2046
⚠️ Important: Always maintain your Risk & Reward Ratio.
✅Like and follow to never miss a new idea!✅
Disclaimer: I am not SEBI Registered Advisor. My posts are purely for training and educational purposes.
Eat🍜 Sleep😴 TradingView📈 Repeat 🔁
Happy learning with trading. Cheers!🥂

MACD Crossover Swing Trade📊 Script: NESTLEIND
📊 Nifty50 Stock: YES
📊 Sector: FMCG
📊 Industry: Food - Processing - MNC
⏱️ C.M.P 📑💰- 2622
🟢 Target 🎯🏆 - 2769
⚠️ Stoploss ☠️🚫 - 2560
📊 Script: ADANIPORTS
📊 Nifty50 Stock: YES
📊 Sector: Marine Port & Services
📊 Industry: Miscellaneous
⏱️ C.M.P 📑💰- 1341
🟢 Target 🎯🏆 - 1426
⚠️ Stoploss ☠️🚫 - 1293
📊 Script: HEROMOTOCO
📊 Nifty50 Stock: YES
📊 Sector: Automobile
📊 Industry: Automobiles - Motorcycles / Mopeds
⏱️ C.M.P 📑💰- 4722
🟢 Target 🎯🏆 - 4949
⚠️ Stoploss ☠️🚫 - 4597
📊 Script: AMBUJACEM
📊 Nifty50 Stock: NO
📊 Sector: Cement
📊 Industry: Cement - North India
⏱️ C.M.P 📑💰- 612
🟢 Target 🎯🏆 - 650
⚠️ Stoploss ☠️🚫 - 592
📊 Script: BERGEPAINT
📊 Nifty50 Stock: NO
📊 Sector: Paints/Varnish
📊 Industry: Paints / Varnishes
⏱️ C.M.P 📑💰- 573
🟢 Target 🎯🏆 - 603
⚠️ Stoploss ☠️🚫 - 558
⚠️ Important: Always maintain your Risk & Reward Ratio.
✅Like and follow to never miss a new idea!✅
Disclaimer: I am not SEBI Registered Advisor. My posts are purely for training and educational purposes.
Eat🍜 Sleep😴 TradingView📈 Repeat 🔁
Happy learning with trading. Cheers!🥂

adani port looking week below 1400Adani Port is looking very weak below 1400
If it remains weak, it can go down to 1317
If it breaks the level of 1400 above, it will strengthen and
The first target can be found at 1460 and then up to 1535

#ADANIENSOL 1176 Tgt 2500 #ADANIENT #ADANIPORTS #ATGL #AWL #ONGC#ADANIENSOL
NSE:ADANIENSOL
CMP 1176
TGT 2500
SL 900
TF < 9M
Great risk return trade off!
Factors: BULLISH WEDGE BREAKOUT Trend Following Rising Volume with rising Prices. Flag pattern breakout. Pennant Pattern Breakout with Bullish Candle. Retest Successful. Higher Highs & Higher Lows. Broken above RESISTANCE levels Trading at SUPPORT levels Earnings are strong. Bullish Wedge Breakout Risk Return Ratio is healthy. And Rising from Double Bottom Pattern to Flag Pattern forming. If you like my work KINDLY LIKE SHARE & FOLLOW this page for free Stock Recommendations. With 💚 from Rachit Sethia

#AWL 398 TGT 500 #Adaniports #adanient #adanipower #adaniensol#AWL
NSE:AWL
CMP 398
TGT 500
SL 350
TF < 6M
Great risk return trade off!
Factors: BULLISH WEDGE BREAKOUT Trend Following Rising Volume with rising Prices. Flag pattern breakout. Pennant Pattern Breakout with Bullish Candle. Retest Successful. Higher Highs & Higher Lows. Broken above RESISTANCE levels Trading at SUPPORT levels Earnings are strong. Bullish Wedge Breakout Risk Return Ratio is healthy. And Rising from Double Bottom Pattern to Flag Pattern forming. If you like my work KINDLY LIKE SHARE & FOLLOW this page for free Stock Recommendations. With 💚 from Rachit Sethia

#ATGL 1075 Tgt 3500 #ADANIENT #ADANIPORTS #ADANIENSOL #AWL #NSE#ATGL 1075 Tgt 3500
NSE:ATGL
CMP 1075
TGT 3500
SL 795
TF < 9M
Great risk return trade off!
Factors: BULLISH WEDGE BREAKOUT Trend Following Rising Volume with rising Prices. Flag pattern breakout. Pennant Pattern Breakout with Bullish Candle. Retest Successful. Higher Highs & Higher Lows. Broken above RESISTANCE levels Trading at SUPPORT levels Earnings are strong. Bullish Wedge Breakout Risk Return Ratio is healthy. And Rising from Double Bottom Pattern to Flag Pattern forming. If you like my work KINDLY LIKE SHARE & FOLLOW this page for free Stock Recommendations. With 💚 from Rachit Sethia


ADANI PORTS LONG TERM VIEWAdani Ports is forming a Symmetrical Triangle on Daily Time Frame
Entry is above 761.30
Stop Loss is at 657.05
Target is 1215
(Please note that entry & stop loss is on candle closing basis)
This View is purely based on Technical Analysis and is for educational purposes only.

ADANIPORTSNSE:ADANIPORTS
One Can Enter Now !
Or Wait for Retest of the Trendline (BO) !
Or wait For better R:R ratio !
Note :
1.One Can Go long with a Strict SL below the Trendline or Swing Low.
2. R:R ratio should be 1 :2 minimum
3. Plan as per your RISK appetite and Money Management.
Disclaimer : You are responsible for your Profits and loss, Shared for Educational purpose

Adani PortAdani Port CMP 825
Stock showing strength
Above 830 closing will show 860
Above 860 900 is also possible.
Can add for bullish view.

ADANIPORT -set for big rallyNSE:ADANIPORTS
showing positive momentum in DAILY as well as in WEEKLY TIMEFRAME.
it could be a good time to start investing in it.
But there must be a STOPLOSS.
invest at your own risk, this is only for educational purpose.
