Adobe: Entering the Fourth Wave — Smart Money Distribution PhaseAdobe’s stock is entering a critical structural phase — the completion of its third global impulse and the start of the fourth corrective wave.
While the long-term uptrend remains intact, the price structure and fundamentals suggest that the most explosive growth period may already be behind us.
🧭 Long-Term Technical Context
Looking back to the early 2000s, Adobe has moved through a textbook Elliott Wave structure.
The first and second waves built the base, while the third wave delivered the explosive rally — from roughly $30 to $600, marking a 20x increase.
Now, the fourth subwave of the third major wave appears to be forming — a phase typically characterized by sideways consolidation and distribution by institutional players.
🔺 Wave 4 Triangle Formation
In many long-term wave structures, the fourth wave forms a triangle (ABCDE pattern) — a contracting structure where price oscillates between defined boundaries.
We can already observe the emerging shape:
Wave A and B are complete
Wave C is in progress
Wave D and E will likely complete the pattern before the final breakout
Once the triangle ends, a final Wave 5 push could occur — potentially extending toward $700, or in an extended scenario, even $2000.
📊 Trading Range and Short-Term Strategy
At this stage, smart money tends to distribute positions gradually.
The price is oscillating within a broad corridor, providing opportunities for range-based trading:
Buy zones: near the triangle lows (Wave A area around $350)
Profit zones: near the triangle highs (Wave B area around $600)
For swing traders, this range offers multiple short-term opportunities before the next major move begins.
💵 Fundamental Context
Despite being in a late-wave structure, Adobe’s fundamentals remain strong.
Share buybacks: The company continues to repurchase its own shares, supporting EPS growth.
EPS trend: Rising steadily year over year.
Revenue growth: Stable, around +10% YoY, with quarterly metrics showing +40% growth since Q1 2024.
Forward P/E: Approximately 28, which, by Peter Lynch’s growth-to-PE logic, still appears reasonably valued.
These metrics suggest that even in a market downturn, Adobe’s downside risk may be more limited compared to weaker tech peers.
🧮 Fundamental Summary
✅ Consistent buybacks supporting EPS
✅ Double-digit annual revenue growth
✅ Attractive valuation relative to growth metrics
✅ Strong defensive profile versus the broader tech sector
There are no visible signs of fundamental weakness — only technical consolidation after years of exponential expansion.
⚠️ Alternative Scenario
If the stock breaks below $270, the current wave structure may need adjustment.
Such a move could imply a larger triangle or a flat correction, but the broader interpretation — that we’re inside a long-term Wave 4 — would remain valid.
📈 Market Outlook
Adobe is transitioning from a high-momentum growth phase into a strategic accumulation and distribution phase.
The stock is unlikely to replicate its earlier explosive rally, but it continues to offer structured trading opportunities inside a stable technical range.
For long-term investors, the risk-reward remains balanced, supported by solid fundamentals.
For traders, the triangle provides a clear framework: buy near lows, take profits near highs, and wait for the fifth wave breakout.
🧩 Summary
Price structure suggests Wave 4 triangle formation
Trading range between $350–$600
Fundamentals remain strong and defensive
Forward P/E at 28 — reasonable given EPS growth
Next major target: Wave 5 breakout toward $700–$2000
Adobe is no longer in its most explosive phase — but it’s far from weak.
This is a mature consolidation period, not a decline story.
For disciplined traders, the triangle may offer some of the cleanest swing setups in the tech sector.
Adbestock

Adobe - The major triangle breakout!🎯Adobe ( NASDAQ:ADBE ) breaks out soon:
🔎Analysis summary:
For the past five years, Adobe has overall been consolidating within a bullish triangle pattern. This triangle seems to be quite similar to the triangle which we saw back in 2012. And with the current retest of the confluence of support, Adobe will now initiate the triangle breakout.
📝Levels to watch:
$360
SwingTraderPhil
SwingTrading.Simplified. | Investing.Simplified. | #LONGTERMVISION

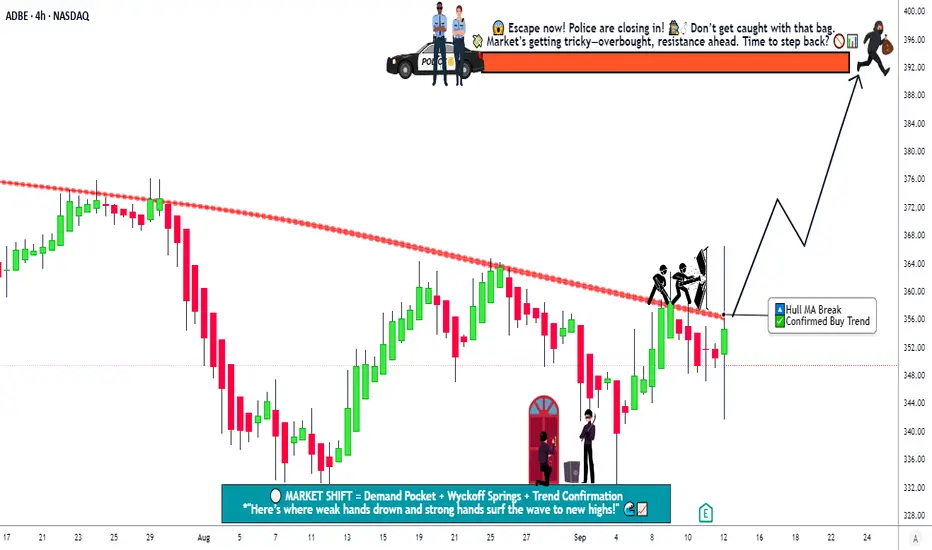
Adobe Technical Analysis! Swing/Day Trade Levels & Strategy🎯 ADBE Stock: The Great Money Heist Plan (Swing/Day Trade) 🤑💰
🚨 Ladies and Gentlemen, Welcome to the Ultimate ADBE (Adobe Inc.) Bullish Breakout Caper!
🚨Get ready to join the Thief OG Crew for a slick, calculated swing/day trade on $ADBE. This is a polished, TradingView-friendly plan designed to maximize views, likes, and potentially catch the Editor’s Pick spotlight! Let’s break it down with a fun yet professional vibe, all while respecting TradingView’s House Rules. 😎
📊 The Setup: Bullish Breakout Pending Order!
✅ Asset: NASDAQ:ADBE (Adobe Inc.)✅ Market Mood: Bullish breakout Pending with the Hull Moving Average crossing at $360.00! 📈✅ Timeframe: Swing/Day Trade (your choice, OG Thieves!)
The Hull Moving Average has flashed a green light 🚦, signaling a breakout. NASDAQ:ADBE is ready to run, and we’re here to grab the loot before the Police Barricade (resistance) stops us! 💪
🕵️♂️ The Thief Strategy: Layered Limit Orders
This is no ordinary trade — it’s a sneaky layered entry plan to maximize your chances of snagging profits. Here’s how we roll:
Entry Levels: Place multiple buy limit orders at these strategic price points to layer your entries like a master thief:
💰 $352.00
💰 $355.00
💰 $360.00
💰 $365.00
Pro Tip: Feel free to add more limit layers based on your risk appetite and market conditions! Be flexible, but stay sharp. 🔍
Why Layering? This strategy lets you scale into the trade, reducing risk if the breakout pulls back slightly before blasting off. It’s like planting multiple traps for the market to fall into! 🕸️
Note: You can enter at any price level that suits your style, but these levels are primed for action. Always confirm with your own analysis, OG Thieves! 🧠
🛑 Stop Loss: Protect Your Loot!
Thief Stop Loss: Set a stop loss at $345.00 after the breakout confirmation at $360.00.
Why? This level keeps you safe from unexpected reversals while giving the trade room to breathe.
Customize It: Adjust your stop loss based on your risk tolerance and strategy.
Dear Ladies & Gentlemen (Thief OG’s), this is your heist — set your SL to match your vibe! ⚠️
Disclaimer: I’m not here to dictate your stop loss. It’s your money, your risk, your rules. Trade responsibly! 😇
🎯 Target: Escape Before the Police Barricade!
Profit Target: Aim for $392.00, where a Police Barricade (strong resistance) awaits, combined with overbought conditions and a potential trap. 🏦
Why $392.00? This level aligns with historical resistance and RSI overbought signals. Grab your profits and escape before the market catches you! 🏃♂️
Disclaimer: Don’t feel locked into my target. Set your own profit goals based on your strategy and risk management. Take the money and run when you’re ready! 💸
🔗 Related Pairs to Watch (and Why!)
To make this heist even smoother, keep an eye on these correlated assets (all in USD):
NASDAQ:MSFT (Microsoft): Adobe and Microsoft move in sync due to their tech sector overlap. If NASDAQ:MSFT is pumping, NASDAQ:ADBE might follow. Watch its price action for confirmation. 📈
NYSE:CRM (Salesforce): Another tech giant with similar market drivers. A bullish move in NYSE:CRM could signal strength in $ADBE. 🧩
AMEX:SPY (S&P 500 ETF): The broader market index often dictates tech stock momentum. If AMEX:SPY is green, it’s a tailwind for $ADBE. 🌍
Key Correlation Point: These assets share exposure to tech sector trends and macroeconomic factors like interest rates or earnings seasons. If they’re trending up, it’s a good sign for our NASDAQ:ADBE heist! 🕵️♀️
📝 Key Notes for Thief OG’s
Confirm the Breakout: Always double-check the Hull Moving Average crossover at $360.00 and volume spikes before jumping in. No reckless heists! 🧐
Risk Management: Layered entries and stop losses are your safes. Don’t risk more than you’re willing to lose. 💼
Escape Plan: Watch for overbought RSI or sudden volume drops near $392.00. That’s your cue to cash out and vanish! 🏃♀️
Stay Flexible: Market conditions change. Adapt your entries, stops, and targets as needed. You’re a thief, not a robot! 🤖
✨ “If you find value in my analysis, a 👍 and 🚀 boost is much appreciated — it helps me share more setups with the community!”
#ADBE #StockMarket #SwingTrading #DayTrading #BullishBreakout #TechnicalAnalysis #HullMovingAverage #TradingStrategy #MoneyHeist #InvestSmart
📢Disclaimer: This is a fun, strategic plan, but it’s not financial advice. Always do your own research and trade at your own risk, OG Thieves! 🙌
Adobe - A gigantic triangle breakout! 🔋Adobe ( NASDAQ:ADBE ) will break the triangle:
🔎Analysis summary:
Yes, for the past five years Adobe has been overall consolidating. But this consolidation was governed by a strong symmetrical triangle pattern. Thus following the underlying uptrend, there is already a higher chance that we will see a bullish breakout, followed by a strong rally.
📝Levels to watch:
$400, $700
🙏🏻#LONGTERMVISION
Philip - Swing Trader

ADOBE MONEY SNATCH! High-Reward Long Setup (Police Trap Alert!)🚨 ADOBE HEIST ALERT: Bullish Bank Robbery Plan! (High-Risk, High-Reward Loot) 🚨
🌟 ATTENTION, MARKET PIRATES & MONEY SNATCHERS! 🌟
(Hola! Bonjour! Marhaba! Hallo!)
🔥 THIEF TRADING STRATEGY 🔥 – ADOBE INC. (ADBE) is primed for a bullish heist! Time to steal profits like a pro!
🔓 ENTRY POINT: "BREAK THE VAULT!"
"The loot is unguarded!" – Go LONG at any price, but for smarter robbers:
Set Buy Limit orders (15m/30m recent swing levels).
ALERT UP! Don’t miss the heist signal!
🛑 STOP-LOSS: "ESCAPE ROUTE!"
Thief SL: Nearest 2H nearest Swing Low (Adjust based on your risk tolerance & lot size).
Police (Bears) are lurking – Don’t get caught!
🎯 TARGET: 440.00 (OR BAIL BEFORE THE COPS ARRIVE!)
Scalpers: Stick to LONG side only!
Big Bankroll? Charge in! Small stack? Join the swing robbers!
Trailing SL = Your Getaway Car!
📢 WHY ADOBE Inc?
🐂 Bullish momentum + Overbought but greedy!
🚨 High-risk Red Zone – Trend reversal? Police trap? Bears are strong here!
💸 "Take profits & TREAT YOURSELF – You earned this loot!"
📡 STAY SHARP, THIEF!
Fundamentals, News, COT Reports, Geopolitics – CHECK THEM! (Linkkss ☝👉👆👉).
Market shifts FAST! Adapt or get caught holding bags!
⚠️ WARNING: NEWS = VOLATILITY TRAP!
Avoid new trades during news!
Trailing stops = Your bulletproof vest!
💥 BOOST THIS HEIST! 💥
"Like & Boost = Stronger Robbery Crew!"
💰 More boosts = More profit heists! 🚀
Stay tuned… Next heist coming soon! 🏴☠️🤑

Adobe: Keep It Up!Adobe has steadily advanced upward within our beige Target Zone between $331.93 and $449.61, moving away from the low of the beige wave x, which thus gained further confirmation. The stock should soon fight its way out of this zone and head for the resistance at $640. The ongoing wave y should eventually extend significantly above this mark to complete the corrective upward movement of the blue wave (b) there.

Adobe: In Our Target Zone!The ADBE stock has continued its downward movement, heading directly toward the center of our beige Target Zone (coordinates: $449.61 – $331.93). With this range now reached, the minimum requirement for the ongoing correction has been met. However, our primary expectation remains that the price will engage more extensively within our Zone, as we anticipate the bottom of the beige wave x to form deeper within it. Once the low is established, we expect the subsequent wave y to resume the upward trend and surpass the resistance at $640. There, the larger blue wave (b) should be completed as well.

Adobe Shares (NASDAQ: $ADBE) Plunge on Disappointing OutlookAdobe Inc. (NASDAQ: NASDAQ:ADBE ) shares tumbled more than 9% in extended trading after the company released a disappointing outlook for its fiscal fourth quarter, overshadowing its strong third-quarter performance. Despite reporting better-than-expected earnings and revenue, the lackluster guidance raised concerns among investors about Adobe’s near-term growth prospects.
The San Jose-based software giant, renowned for its Creative Cloud and other digital media services, posted third-quarter revenue of $5.41 billion, marking an 11% increase year-over-year. Earnings per share (EPS) came in at $3.76, exceeding the $3.05 reported in the same quarter last year. However, Adobe’s projection of fourth-quarter revenue between $5.50 billion and $5.55 billion fell short of analysts' estimates. The company also expects diluted EPS of $3.58 to $3.63, lower than Wall Street's anticipated range.
Despite the record net-new annualized recurring revenue (ARR) of $504 million from its Digital Media segment, Adobe’s cautious outlook reflects ongoing concerns about economic uncertainty, high interest rates, and cautious enterprise spending.
Technical Outlook: Key Levels to Watch
Adobe's stock price has been under pressure, reflecting broader market concerns. The shares are currently poised to break down below the lower trendline of an ascending triangle pattern—a bearish signal that could indicate further declines.
Here are the critical technical levels to monitor:
1. $500 Level: This is a crucial support zone that coincides with a psychological round number and aligns with multiple peaks and troughs from June 2023 to August 2024. A breakdown below this level could signal a shift in investor sentiment, paving the way for further declines.
2. $435 Support: A drop to this area could present a buying opportunity as it corresponds with a pre-gap consolidation zone during a significant uptrend observed between May and June 2023. This level also aligns closely with a swing low from May 2024, adding to its significance as a potential support point.
3. $386 Level: The next lower support sits at $386, where the stock could encounter buying interest near several historical peaks that formed from early February to late April last year. A failure to hold this level could set the stage for a deeper correction.
Resistance to Watch
On the upside, the key resistance level to watch is $550. If Adobe shares attempt a countertrend move, they may face selling pressure around this level, which represents a retest of the ascending channel’s lower trendline.
AI Innovations Yet to Prove Lucrative
Adobe has been at the forefront of integrating AI into its suite of products, including popular tools like Photoshop and Illustrator. The company has embedded its proprietary Firefly technology into these applications, aiming to enhance user experience and drive value. However, investors remain skeptical about Adobe's ability to monetize these AI advancements, particularly amid rising competition from nimble startups and rival firms like Salesforce and Workday.
On a recent earnings call, Adobe’s management emphasized their focus on enhancing customer engagement with AI tools rather than directly monetizing them. CEO Shantanu Narayen highlighted the potential for new content types, such as video, to open additional revenue streams in the future. However, the market's appetite for immediate returns and tangible financial impacts from AI innovations remains unfulfilled, contributing to the negative sentiment.
A Potential Shift to Bearish Momentum
Adobe's recent chart activity reveals a troubling pattern, with the stock price sitting at a precarious position just above key support levels. The 50-day moving average recently crossed above the 200-day moving average, forming a golden cross, a traditionally bullish signal. However, the failure to hold above the ascending triangle’s lower trendline suggests that this bullish momentum could be fading.
The stock’s RSI (Relative Strength Index) of 60.95 indicates that while it is not yet in oversold territory, there is ample room for further downside. Should the stock break below the critical $435 support pivot, it may trigger a wave of bearish sentiment, potentially leading to a broader sell-off.
Conclusion
Adobe Inc. (NASDAQ: NASDAQ:ADBE ) faces a challenging landscape as it navigates economic headwinds and investor expectations for its AI-driven future. With critical support levels under threat, the technical picture suggests caution. Investors should remain vigilant, especially with the stock approaching key pivot points that could determine its near-term trajectory. While Adobe’s innovative product suite continues to perform, the market’s immediate focus will likely remain on whether the company can turn its AI ambitions into concrete financial gains, making it a stock to watch closely in the coming months.

Adobe (ADBE) WaterfallI think Adobe, which has lost more than 32% since the beginning of the year, has a fair value of $522.30. However, as long as the decline continues, we should wait to buy. You can't hold a falling knife. With a break of the moving average or downtrend, I think it will reach its fair value, and with momentum, it may even go up to $620, which is the long-term downtrend. Unless the trend breaks, the decline will continue until the 300s.

ADBE Strong Selloff and Potential Buy OpportunityNASDAQ:ADBE met earnings expectations yesterday, but set low guidance for 2024. ADBE is having a strong selloff from this low guidance, and this selloff is taking place near previous all time highs. I think ADBE is a very bullish stock, and I am interested in buying this dip. I'm thinking there will be a buy opportunity below $480 and will track ADBE to look for a setup. More downside is likely for now.

ADOBE POST ER ANALYSISI have explained what actions to be taken now for ADBE. Do not trade options blindly.
If you have any questions do let me know.

ADBE bullish for earningsADBE is looking bullish for earnings . I am posting this chart on 13th March 2024 at 11:38pm.
Original entry was $535 &SL was $519.SL is still the same but target is $673 now.
If you have any doubts feel free to DM.
NOTE: DO NOT TRADE OPTIONS

ADBE suppress by the top to bottom golden ratio of 1.382ADBE suppress by the top to bottom golden ratio of 1.382
This chart shows the weekly candle chart of Adobe's stock over the past two years. The top to bottom golden section at the end of 2021 is superimposed in the figure. As shown in the figure, the highest point of Adobe's stock in the past two weeks has been suppressed by the top to bottom golden ratio of 1.382 in the figure, and the high point in early June and low point in mid August this year are exactly 2.000 positions in the top to bottom golden ratio in the figure! So, in the future, just use the top to bottom golden section of 1.382 in the figure as the watershed to determine the strength of Adobe's stock!

Adobe's stock has risen by 4 small bandsAdobe's stock has risen by 4 small bands
This chart shows the weekly candle chart of Adobe's stock in the past two years. The top to bottom golden section at the end of 2021 is superimposed in the figure. As shown in the figure, Adobe's stock has risen by 4 small bands since the short-term bottom formation at the end of September 2022, and the bull momentum has been perfectly released! The recent peak of Adobe's stock has just peaked at the top to bottom golden ratio of 1.618 in the picture, and now it has fallen back to 2.000! In the future, the top to bottom golden ratio of 2.382 in the figure will serve as the long short divide for Adobe's stock!

Adobe -> The Forgotten StockHello Traders,
welcome to this free and educational multi-timeframe technical analysis .
On the weekly timeframe you can see that as we are speaking Adove stock is actually approaching a quite obvious previous weekly structure area which is now turned resistance exactly at the $380 level.
You can also see that overall weekly market structure is about to shift bullish, we are already having bullish weekly moving averages and the overall price behaviour of the past couple of weeks is looking very bullish so I simply do expect a break and retest of the resistance and then more continuation towards the upside.
On the daily timeframe you can see that Adobe stock is not creating bullish market structure yet - we are currently retesting previous daily support which is now turned resistance so I am just waiting for a clear break above the zone followed by a retest and then I do expect more daily continuation towards the upside.
Thank you for watching and I will see you tomorrow!

Adobe: Well On The Way 👍Adobe is well on the way to completing wave B in green, although the course still has got some room to expand the current movement. However, before the resistance at $402.49 at the latest, it should turn downwards again. Thus, the share should drop below the support at $278.23 and into the adjacent gray zone between $278.96 and $227.74, where it should then conclude wave b in gray. There is a 32% chance, though, for Adobe to continue the ascent above the resistance at $402.49. In that case, we would consider wave alt.b in gray to be already finished.

ADBE Adobe Inc Options Ahead Of EarningsLooking at the ADBE Adobe Inc options chain ahead of earnings , i would buy the $325 strike price Puts with
2023-01-20 expiration date for about
$17.25 premium.
If the options turn out to be profitable Before the earnings release, i would sell at least 50%.
Looking forward to read your opinion about it.
