What Happened to Adobe ? - Is it a Good Buy ? Why Adobe’s Stock Has Fallen Since Its Peak
Adobe’s share price has declined significantly from earlier highs for several reasons:
1. Growth Concerns / Slower Revenue Expansion
Adobe still grows revenue but only 10% yearly, slower than in prior years, not enough for some growth-focused investors.
2. Competition & AI Challenges
Analysts are worried that generative AI tools from competitors (e.g., Figma-like tools, Canva, Google, OpenAI) are reducing demand for Adobe’s traditional licensed products, and that its subscription pricing model may face pressure from new usage-based pricing norms.
3. Market Re-rating of Software Stocks
The broader software sector has underperformed recently as investors shift toward infrastructure and semiconductor stocks especially in the age of AI and software multiples have compressed.
4. Earnings Reactions
Adobe sometimes reports beating earnings, yet the stock still drops reflecting concerns about future growth rather than current performance.
Key Financial & Operational Metrics
Revenue & Profitability
-FY2025 record revenue of $23.77 billion, 11% year-over-year growth.
-Earnings remain strong with solid EPS growth and net income expansion.
-Gross margins remain high ~89%, typical for dominant software companies.
Cash Flow
Adobe generates robust free cash flow and operating cash flow, supporting operations and capital allocation.
Debt & Balance Sheet
Total debt is around $6.2 billion, with cash & equivalents $6.6 billion, effectively near net-cash position when offset. Interest coverage is very strong, suggesting debt is manageable.
Valuation Multiples
Adobe now trades at lower P/E and EV/EBITDA multiples relative to its historical levels, reflecting a more value-like profile than growth.
Bullish Case :
Market Leadership & Brand Strength
Adobe owns industry-leading products (Photoshop, Illustrator, Acrobat, Creative Cloud) with deep penetration in creative and business markets.
Subscription & Recurring Revenue Model
The Creative Cloud and Document Cloud generate predictable, high-margin subscription revenue, which is highly resilient.
AI Integration & Innovation
Adobe is integrating AI (e.g., Firefly, AI-influenced ARR) across products, which is both a competitive edge and a future growth driver.
Strong Profitability & Cash Flows
High margins and strong cash flows give Adobe strategic flexibility, including share repurchases and room to invest.
Lower Valuation & Defensive Qualities
The valuation isn’t as stretched as in previous years, making Adobe more appealing to value investors if growth stabilizes.
Bearish Case :
Growth Still Moderate
10% revenue growth is solid, but not “high-growth” territory that many tech investors demand.
Competitive Pressures
Emerging tools and AI platforms are eroding Adobe’s dominance in some creative segments.
AI Monetization Skepticism
Investors are skeptical about Adobe’s ability to translate AI features into significantly higher revenue or pricing power.
Sector Rotation Against Traditional Software
Broader market trends favor infrastructure and tech enablers over legacy application incumbents like Adobe.
Valuation Still Dependent on Growth Outlook
Even at lower multiples, Adobe’s valuation still embeds expectations that it will sustain growth; if growth decelerates further, multiples could compress more.
Disclaimer:
This analysis is for informational and educational purposes only and does not constitute financial advice, investment recommendation, or an offer to buy or sell any securities. Asset prices, valuations, and performance metrics are subject to change and may be outdated. Always conduct your own due diligence and consult with a licensed financial advisor before making investment decisions. The information presented may contain inaccuracies and should not be solely relied upon for financial decisions. I am not a licensed financial advisor or professional trader. I am not personally liable for your own losses; this is not financial advice.
Adobe

Live trading on AdobeLive trade on Adobe
The primary analysis can be found in the linked post
Follow proper risk and money management.
This is just my personal view, so please trade based on your own strategy and trading system.
Follow me on TradingView for more analyses and live stock trades.
NASDAQ:ADBE

ADBE, Second BEAR-Fractal, SHORT-Momentum DOOMSDAY Incoming!Hello There!
Welcome to my new analysis of ADBE. This stock has been massively battered by the major bear market decline setup in the gigantic bear channel. This stock did not exceed any new highs and did not have the potential to emerge with new bull momentum. The bears are still present within this stock and this is exactly why the bear momentum for this stock can accelerate heavily any time soon. There are several major bearish indications that are underlining the bearish scenario for the stock in an overwhelmingly precarious way.
Three reasons why the bear doomsday scenario for the stock is present, starting any time soon:
1.) Massive Liquidations: Over 250 Billion positions have been liquidated within the previous bearish doomsday market decline wave towards the downside.
2.) Weak Momentum: The momentum with which the recent meager recovery wave setup is highly fragile and is likely to turn anytime soon.
3.) Major Short-Side Positioning: A vast amount of institutional and smart money operators are positioning their selves on the short side. Always an important indication especially with retail traders positioned in the other direction.
Why shorting the stock through the upcoming second bear doomsday scenario will be the best approach in the current and upcoming market conditions:
1.) Second bearish ascending wedge fractal: The stock is going to complete exactly the same bearish ascending wedge fractal towards the downside once again.
2.) Total-Return Approach: By shorting the stock a trader has the candidature to a total-return approach, the trader is profiting when prices fall and at other times when they go up.
3.) Liquidation Acceleration: Once the whole ascending fractal has been completed it will trigger a fast-paced bearish wave making profits much faster than in an uptrend.
The most prevalent determining indications that are going to activate the upcoming bear market scenario wave for the stock:
As it is seen in my chart ADBE completed the huge bearish ascending triangle fractal exactly by moving into the upper distribution zone from where it emerged with the pullback towards the downside and set up the massive 250 Billion bearish liquidation wave towards the downside. This wave developed very fast and by positioning oneself before this huge bearish wave and completion of the fractal towards the downside a trader could make a big load of profit in the market.
Now, ADBE is still trading within the gigantic descending channel formation in which it has the most prevalent upper resistance distribution channel which has been the origin of the massive bearish waves towards the downside before and is now already setting up the upcoming 300 Billion bearish liquidation wave towards the downside which is going to activate the completion of the second ascending wedge fractal and the preceding wave C towards the bearish direction.
In the next times, the whole bearish ascending wedge fractal will be completed with the breakout below the lower boundary followed by the breakout below the 65EMA and 100EMA from where the bearish trend acceleration is going to unfold huge accelerations towards the downside and the severe bearish continuations towards the lower target zones. Especially, in this case, the market could still continue beyond this level in the bearish direction.
Upcoming Perspectives and the major underlying factors that are primarily important for consideration on the short side for the stock, the sector, and the economic field:
It has to be mentioned that an economic field with high interest rates, spreading inflation, a stagnation within the sector is setting up the determination to increase this whole bearish wave development, especially with a more bearish volume moving into the market. Also, highly determining in this case is the actual technology developments because when they reverse in an economic field this will have massive bearish effects on the stock as well.
Now, for traders it is highly important to follow such market situations with the appropriate setup within the market, especially in such times it is necessary to have the right positioning within the market because a massive bearish pressure acceleration can start anytime soon considering a huge acceleration in the inflation, a smart money operator bearish market making in which the bearish conclusion will be inevitable, an expiring futures market in which a lot of futures turn to an bearish volatility in the market. This is why traders need to position their selves before all these heavy bearish scenarios are set up.
In this manner, thank you everybody for watching my analysis of ADBE. Support from your side is greatly appreciated.
VP

$ADBE Tradespoon – Long Setup $355.86Tradespoon model signals a long bias for NASDAQ:ADBE . Predicted range: $351.42–$371.70. Trend: –0.41% short-term, with upside follow-through potential. NASDAQ:ADBE

ADBE | Breakout Play After Earnings | Eyes on $360 and $390Adobe NASDAQ:ADBE has finally cleared the $350 volume wall, a level that’s acted as firm resistance for months. The breakout was backed by strong earnings, signaling momentum could continue as bulls step in. This move opens the door for a potential rally continuation, especially if the broader tech sector remains strong.
📉 Trade Setup:
I'm watching for a retest of support around $330–$335 — a former resistance zone that could now act as a solid base for the next leg up. A clean bounce from this area could offer a high-probability long entry.
🎯 Targets: $360 (initial), $390 (extended)
❌ Stop Loss: Below $310 to protect against deeper pullbacks

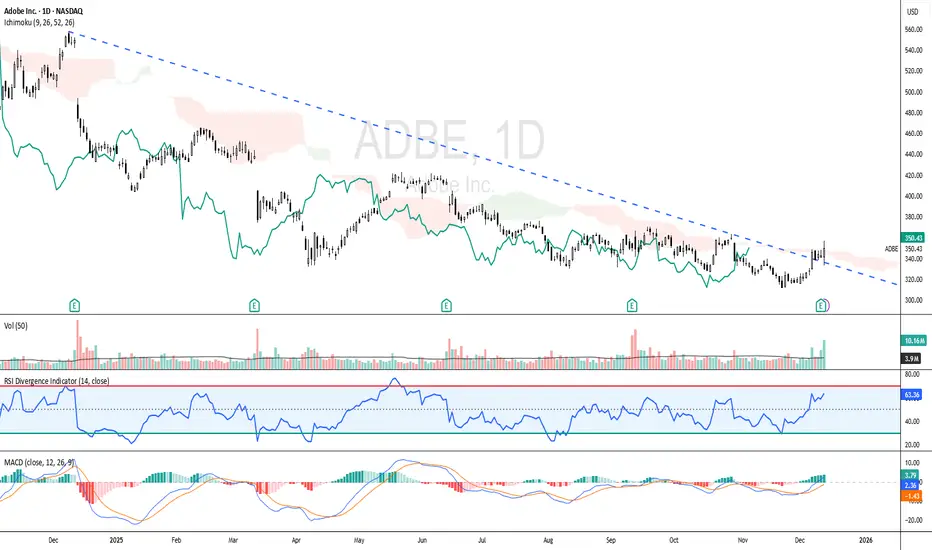
ADOBE - Short-term Bullish SetupADBE - CURRENT PRICE : 350.43
🔼 Short-term bullish outlook as price breaks above the downtrend line, signalling a potential trend reversal. 💪 RSI remains bullish above the mid-line, while MACD shows a positive crossover 📈, strengthening the upside momentum. ☁️ The Ichimoku Chikou Span (green line) is now above past candlesticks, supporting a shift toward bullish sentiment. Increasing volume on the breakout indicates strong buyer participation. If momentum continues, upside targets are at 170 and 190, with 130 as the key support to monitor.
ENTRY PRICE : 348.00 - 350.43
FIRST TARGET : 170.00
SECOND TARGET : 190.00
SUPPORT : 130.00
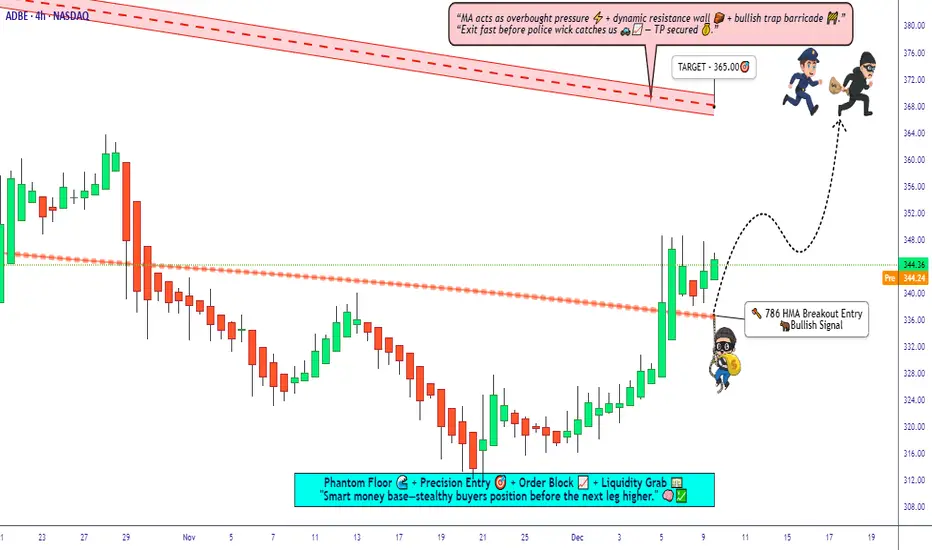
ADBE Setup • HMA ⇧ Breakout with Structured Swing Targets🧨 ADBE – Adobe, Inc. | NASDAQ 🔥 “Stock Market Profit Playbook” (Swing Trade)
HULL Moving Average Breakout • Bullish Momentum Setup 💹😎
**📘 Plan Overview — Bullish Setup Confirmed
The bullish structure is validated by a Hull Moving Average (HMA) breakout, signaling upward momentum building across the swing-trade timeframe. 📈✨
This setup follows the Thief Strategy style — a multi-layered limit order approach designed to average into strong breakout conditions.
🎯 Entry Plan — Thief Layer Strategy (Limit Order Stacking)
Using the Thief layering concept, entries are placed across multiple price levels to scale into strength.
Suggested entry layers (you may increase based on your own risk plan):
🟢 325.00
🟢 330.00
🟢 335.00
🟢 340.00
(This is a layered style entry — NOT a recommendation. Please adjust based on your own risk-to-reward model.)
🛑 Stop-Loss — Thief SL Plan
Stop Loss: 🔻 315.00
Note: Dear Ladies & Gentlemen (Thief OG’s) — this SL is not a recommendation.
It’s your choice, your risk, your money. Manage it as you see fit. 💼⚠️
💰 Target — TMA Resistance + Overbought Trap Zone
Take Profit: 🎉 365.00
Why?
🔷 Triangular Moving Average (TMA) acting as dynamic resistance
🔷 Market showing overbought conditions
🔷 Trap zone potential — so taking profits is wise
Note: Dear Ladies & Gentlemen (Thief OG’s) — this TP is also not a recommendation.
Secure your profits based on your personal plan! 💵🔥
📡 Correlated Watchlist — Related Pairs to Monitor
Here are correlated tickers worth watching for sentiment, sector strength & cross-market validation:
🎨 Adobe Sector / Tech Momentum Checks
NASDAQ:MSFT — Cloud + enterprise software correlation; strong tech flows often lift ADBE.
NYSE:CRM — Software sector sentiment gauge; similar earnings-reaction behavior.
NASDAQ:AAPL — Large-cap tech risk-on/off mood setter.
NASDAQ:GOOGL — Digital services & ad-ecosystem performance can indirectly influence ADBE flows.
📈 Key Points
Tech sector strength → supports ADBE upside momentum
If NASDAQ:QQQ is strong → ADBE breakout probability increases
If volatility spikes → layered entries help control AVG price
If US10Y yields rise → tech stocks may temporarily pull back
Keep these in your radar to validate strength or weakness across the broader tech ecosystem. 🔍⚡
✨ “If you find value in my analysis, a 👍 and 🚀 boost is much appreciated — it helps me share more setups with the community!”
Disclaimer: This is thief style trading strategy just for fun. 😄🕵️♂️
#ADBE #Adobe #SwingTrade #ThiefStrategy #HullMA #BreakoutTrading #StockMarket #NASDAQ #TechnicalAnalysis #TMA #LayeredEntries #TraderLife #PriceAction #ChartAnalysis #RiskManagement #USStocks #QQQ #TechSector #TradingView
Walmart (WMT) surged on expectations of robust consumer spending
The US indices have maintained their uptrend, supported by evidence of strong US consumer spending during Black Friday, which confirmed sustained consumer strength.
Adobe (ADBE) reported that consumers spent 11.9 bln USD online during Black Friday, marking a record high and a 9.1% increase YoY. The NRF survey results also indicated a record-high 186.9 mln people planned to shop from Thanksgiving through Cyber Monday.
Walmart (WMT) stock price surged, reflecting its 3Q earnings surprise and growing anticipation for increased year-end consumption. CFO Rainy commented that the early demand for the holiday season is very strong, with robust spending particularly notable among high-income customers.
WMT breached above the ascending channel's upper bound and broke to a new high. Diverging bullish EMAs indicate a potential uptrend extension.
If WMT closes above the channel's upper bound, the price could advance toward the new high and psychological resistance at 111.50.
Conversely, if WMT breaks below the channel's upper bound and the support at 109.00, the price may retreat to the subsequent support at 106.00.

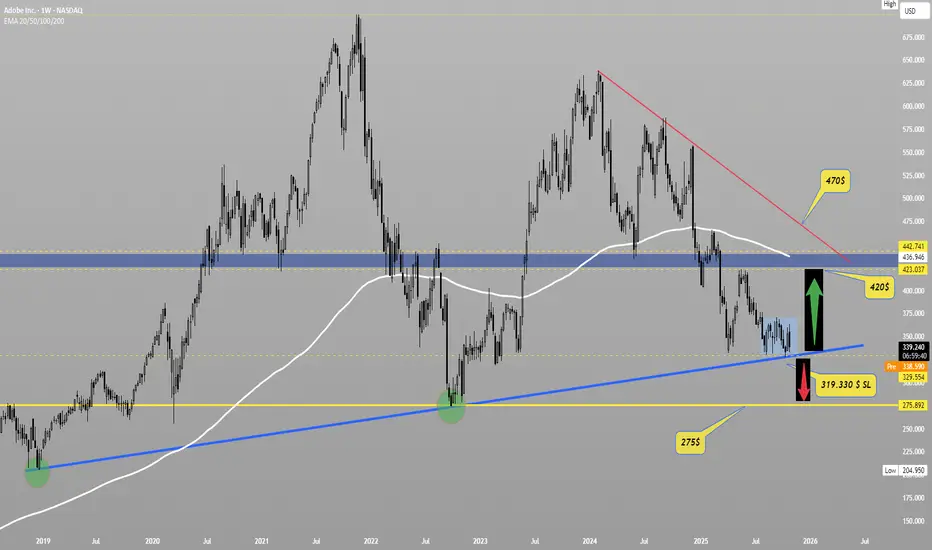
ADBE Technical Analysis ADBE is currently holding at the long-term ascending channel support, and we can say it’s moving sideways between $330 and $360. It’s important to note that in previous tests of this ascending channel support, the price moved more rapidly; however, this time it seems to be taking a breather, indicating that the stock may be in a consolidation phase. This also reflects the current environment of increasing competition and growth among technology companies.
If a position is to be opened, $327.50 (the lowest level it recently reached) can serve as a stop-loss point. For those who want to avoid a potential bear trap, $319.33 could be considered a safer stop-loss level.
The first upside target would be $420, while in the event of a downward move, the price may head toward the $275 horizontal support level.
I wanted to keep the chart quite simple, but the indicators are signaling a potential upward movement. It seems that the price may soon move toward $420. This is not investment advice — it reflects only my personal opinion.
This is not investment advice.
Adobe at major support - Target $603Adobe has been ranging for years to finally let the long term trend catch up. $603 is the target for and it will likely form support above there. Finally Adobe should break out of this range.
This is not a fast trade btw.
Good luck!

Adobe - The major triangle breakout!🎯Adobe ( NASDAQ:ADBE ) breaks out soon:
🔎Analysis summary:
For the past five years, Adobe has overall been consolidating within a bullish triangle pattern. This triangle seems to be quite similar to the triangle which we saw back in 2012. And with the current retest of the confluence of support, Adobe will now initiate the triangle breakout.
📝Levels to watch:
$360
SwingTraderPhil
SwingTrading.Simplified. | Investing.Simplified. | #LONGTERMVISION

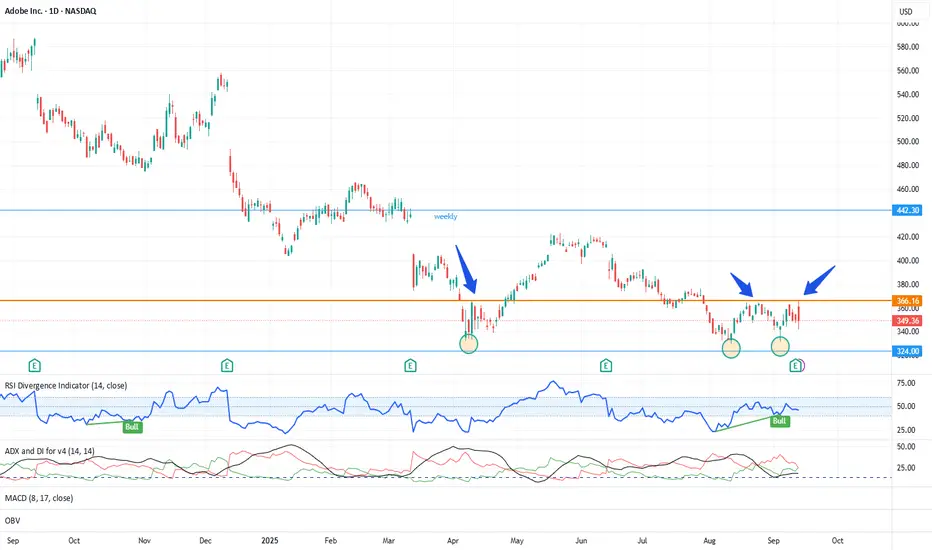
Adobe analysisFrom the current structure, Adobe (ADBE) is sitting on a strong weekly support zone that has held multiple times in the past.
At the same time, the RSI is showing bullish divergence — while price action has been making lower lows, RSI has been printing higher lows. This is often a positive signal suggesting sellers are losing momentum and buyers may step in.
📈 Conclusion: My bias is that Adobe has a good probability of reversing upward from this support level, backed by both the strong demand zone and the RSI divergence. Still, markets are unpredictable, and this remains only my view.

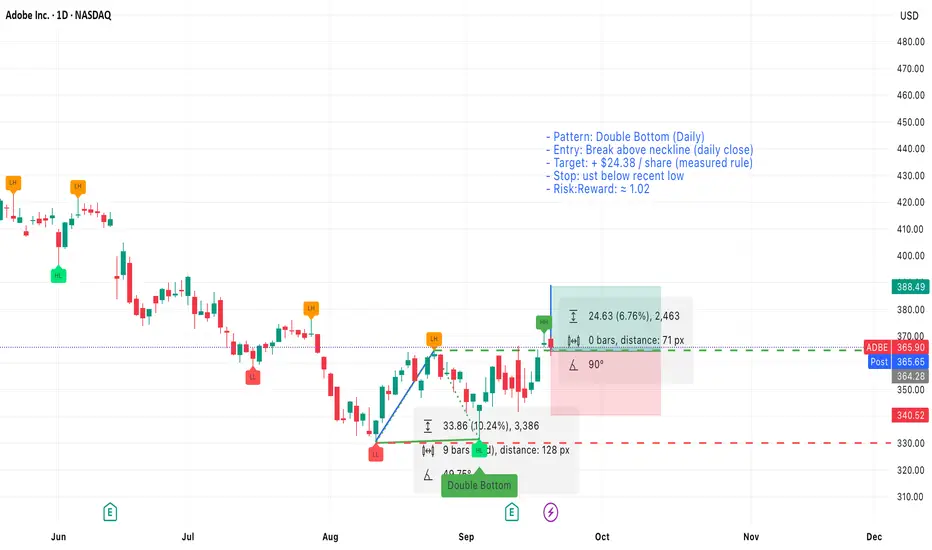
Adobe (ADBE) – Double Bottom + EMA50 Breakout PotentialOn the Daily timeframe, NASDAQ:ADBE is showing early signs of strength:
A Double Bottom pattern has formed, often seen as a bullish reversal signal.
RSI divergence was present at the pattern lows, and RSI has broken above its trendline, suggesting momentum shift.
Price closed above the EMA50 , an important technical milestone.
MACD is in positive territory, supporting a potential continuation upward.
Volume has not spiked dramatically, but it is gradually increasing compared to recent history.
Key Levels:
If the downtrend resistance line is broken and price retests neckline/downtrend area successfully, the pattern projects a move at least towards the next local resistance zone.
Confirmation is crucial: a breakout without retest can be a false signal.
Important Note:
This analysis is not a buy/sell signal. It highlights potential upside if key technical levels are broken and confirmed. Patience for breakout + retest may provide a clearer setup.
(For educational purposes only, not financial advice.)

ADOBE 510 BY 2026 LONG TERM Why Adobe (ADBE) Could Hit $510 by 2026: Technical Breakdown Adobe's trading at ~$365 today, but bullish setups scream upside. Here's why $510 (40% gain) is in play:Bullish Triangle Breakout: ADBE's consolidated in a multi-year ascending triangle since 2020. A recent close above $370 resistance (near 50-day MA ~$383) signals breakout, targeting $510 (measured move from base at $330 low).
RSI Rebound: At 42 (neutral, not oversold), RSI is coiling for momentum shift. Weekly RSI >50 could trigger buy signals, aligning with AI-driven catalysts like Firefly integrations.
MACD Crossover Potential: MACD histogram narrowing (-5.26) hints at bullish crossover by Q4 2025. Paired with 200-day MA (~$420) as next support, this flips sentiment to "Strong Buy" per TradingView.
Analyst Backing: Consensus targets $465–$496 short-term, but long-term forecasts (e.g., LongForecast) eye $577 EOY 2026 on 11% revenue growth to $23B+.

Adobe (ADBE): Undervalued AI Software Leader Amid #AI Boom? Adobe (ADBE): Undervalued AI Software Leader Amid #AI Boom? $456 in Sight? 📈
Trading at $364.08 (-0.50%), ADBE's P/E of 22.67 undervalues its AI-integrated creative tools, with analysts eyeing $456 (25% upside)—will surging #AI trends propel cloud subscriptions higher? 🚀
**Fundamental Analysis**
EPS (TTM) of $16.06 and revenue (TTM) of $23.18B underscore strong growth, with PEG at 1.04 indicating fair valuation for expansion; fundamentals highlight recurring revenue model, though competition in AI space pressures margins.
- **Positive:** Dominant market share in creative software; AI features like Firefly boost user adoption.
- **Negative:** High valuation multiples vs peers; dependency on subscription renewals.
**SWOT Analysis**
**Strengths:** Innovative AI ecosystem; loyal user base.
**Weaknesses:** Premium pricing limits accessibility; integration risks with new tech.
**Opportunities:** Expanding AI tools in enterprise; partnerships in digital marketing.
**Threats:** Open-source AI alternatives; economic slowdowns hitting ad spends.
**Technical Analysis**
Chart displays upward channel with recent pullback testing support. Price: $364.08, VWAP $365.
Key indicators:
- RSI: 55 (mildly bullish, approaching overbought).
- MACD: Bullish divergence emerging.
- Moving Averages: 50-day at $370 (short-term hurdle), 200-day at $400 (major resistance).
Support/Resistance: Support at $350, resistance at $380. Patterns/Momentum: Bull flag pattern, momentum building on AI news. 📈 Bullish | ⚠️ Bearish.
**Scenarios and Risk Management**
- **Bullish:** Break above $380, DCA on pullbacks to capture AI-driven rally.
- **Bearish:** Fall to $350 on macro fears, reduce exposure.
- **Neutral:** Range-bound until earnings clarity.
Risk Tips: Use trailing stops at 7%, cap risk at 2% per trade, diversify with non-tech, DCA for long-term holds. ⚠️
**Conclusion/Outlook**
Strong bullish potential conditioned on #AI momentum. Watch tech sector flows. Fits growth theme with upside. Take? Comment!

Adobe (ADBE) — Daily — Double BottomSetup
Pattern: Double bottom on the daily chart with two clear lows and a visible neckline.
Timeframe: Daily
Measuring rule (target)
Measure the vertical distance from the bottoms to the neckline and add it to the breakout point. Using this method the measured target equals +$24.38 per share from the breakout.
Entry & trigger
- Enter long on a confirmed close above the neckline (daily close above neckline).
- If you prefer an earlier entry, a volume-backed intraday break above the neckline can be used, but prefer a daily close for confirmation.
Stop loss
- Place stop loss just below the recent low (the second bottom). Use a few cents/pips buffer below that low to avoid noise.
Position sizing & risk
- Risk per share = entry price − stop loss price.
- With the stop placed just below the recent low, risk per share is small and gives a risk/reward ratio ≈ 1.02 .
Given the measured target of +$24.38, ensure your entry and stop sizing produce the stated R:R — example calculations below.
Notes & trade management
- Prefer a daily close above the neckline with increased volume for higher probability.
- If price returns to retest the neckline, consider adding only if support holds and risk remains acceptable.
- Trail stop to breakeven after a significant portion of the measured move is achieved (for example, after +50% of the $24.38 move).
Adobe (ADBE) BUYAdobe (ADBE) has embraced generative AI with tools like Firefly, which create text, images, and video. With a huge creative customer base, Adobe has the potential to monetize AI quickly.

ADBE gains? or Real gainsLook at this long term bounce from the low 300s to the mid 600s, everyone's been talking about this one and how cheap it is.
I have my own reservations, Competition/Figma/Google/AI ect they are taking it's desert and maybe lunch in the future.....??? Yeah this is probably a good price that could bounce again for some healthy gains. Although as a designer Adobe can suck it!

ADBE may surprise you with a recovery moveADBE has been in a downtrend since February 2024 and has been struggling to stay above $550. From April 2025, it has found a decent support near $332 levels and formed a sort of triple bottom (the latest one on 4th Sep. 2025) and confirmed by RSI 40 support. It needs to give a daily closing above $367 for the possible targets of 380, 400 and 420. (For educational purposes only)
Adobe Technical Analysis! Swing/Day Trade Levels & Strategy🎯 ADBE Stock: The Great Money Heist Plan (Swing/Day Trade) 🤑💰
🚨 Ladies and Gentlemen, Welcome to the Ultimate ADBE (Adobe Inc.) Bullish Breakout Caper!
🚨Get ready to join the Thief OG Crew for a slick, calculated swing/day trade on $ADBE. This is a polished, TradingView-friendly plan designed to maximize views, likes, and potentially catch the Editor’s Pick spotlight! Let’s break it down with a fun yet professional vibe, all while respecting TradingView’s House Rules. 😎
📊 The Setup: Bullish Breakout Pending Order!
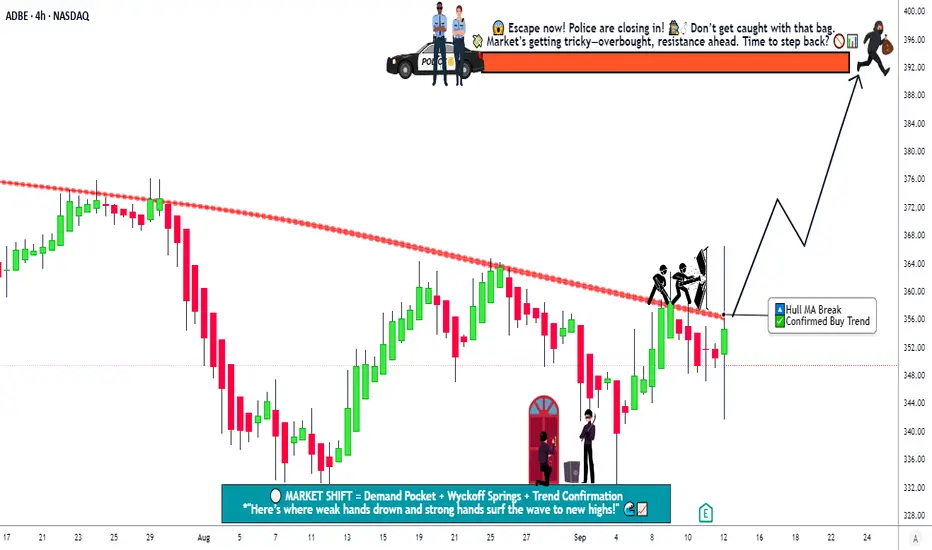
✅ Asset: NASDAQ:ADBE (Adobe Inc.)✅ Market Mood: Bullish breakout Pending with the Hull Moving Average crossing at $360.00! 📈✅ Timeframe: Swing/Day Trade (your choice, OG Thieves!)
The Hull Moving Average has flashed a green light 🚦, signaling a breakout. NASDAQ:ADBE is ready to run, and we’re here to grab the loot before the Police Barricade (resistance) stops us! 💪
🕵️♂️ The Thief Strategy: Layered Limit Orders
This is no ordinary trade — it’s a sneaky layered entry plan to maximize your chances of snagging profits. Here’s how we roll:
Entry Levels: Place multiple buy limit orders at these strategic price points to layer your entries like a master thief:
💰 $352.00
💰 $355.00
💰 $360.00
💰 $365.00
Pro Tip: Feel free to add more limit layers based on your risk appetite and market conditions! Be flexible, but stay sharp. 🔍
Why Layering? This strategy lets you scale into the trade, reducing risk if the breakout pulls back slightly before blasting off. It’s like planting multiple traps for the market to fall into! 🕸️
Note: You can enter at any price level that suits your style, but these levels are primed for action. Always confirm with your own analysis, OG Thieves! 🧠
🛑 Stop Loss: Protect Your Loot!
Thief Stop Loss: Set a stop loss at $345.00 after the breakout confirmation at $360.00.
Why? This level keeps you safe from unexpected reversals while giving the trade room to breathe.
Customize It: Adjust your stop loss based on your risk tolerance and strategy.
Dear Ladies & Gentlemen (Thief OG’s), this is your heist — set your SL to match your vibe! ⚠️
Disclaimer: I’m not here to dictate your stop loss. It’s your money, your risk, your rules. Trade responsibly! 😇
🎯 Target: Escape Before the Police Barricade!
Profit Target: Aim for $392.00, where a Police Barricade (strong resistance) awaits, combined with overbought conditions and a potential trap. 🏦
Why $392.00? This level aligns with historical resistance and RSI overbought signals. Grab your profits and escape before the market catches you! 🏃♂️
Disclaimer: Don’t feel locked into my target. Set your own profit goals based on your strategy and risk management. Take the money and run when you’re ready! 💸
🔗 Related Pairs to Watch (and Why!)
To make this heist even smoother, keep an eye on these correlated assets (all in USD):
NASDAQ:MSFT (Microsoft): Adobe and Microsoft move in sync due to their tech sector overlap. If NASDAQ:MSFT is pumping, NASDAQ:ADBE might follow. Watch its price action for confirmation. 📈
NYSE:CRM (Salesforce): Another tech giant with similar market drivers. A bullish move in NYSE:CRM could signal strength in $ADBE. 🧩
AMEX:SPY (S&P 500 ETF): The broader market index often dictates tech stock momentum. If AMEX:SPY is green, it’s a tailwind for $ADBE. 🌍
Key Correlation Point: These assets share exposure to tech sector trends and macroeconomic factors like interest rates or earnings seasons. If they’re trending up, it’s a good sign for our NASDAQ:ADBE heist! 🕵️♀️
📝 Key Notes for Thief OG’s
Confirm the Breakout: Always double-check the Hull Moving Average crossover at $360.00 and volume spikes before jumping in. No reckless heists! 🧐
Risk Management: Layered entries and stop losses are your safes. Don’t risk more than you’re willing to lose. 💼
Escape Plan: Watch for overbought RSI or sudden volume drops near $392.00. That’s your cue to cash out and vanish! 🏃♀️
Stay Flexible: Market conditions change. Adapt your entries, stops, and targets as needed. You’re a thief, not a robot! 🤖
✨ “If you find value in my analysis, a 👍 and 🚀 boost is much appreciated — it helps me share more setups with the community!”
#ADBE #StockMarket #SwingTrading #DayTrading #BullishBreakout #TechnicalAnalysis #HullMovingAverage #TradingStrategy #MoneyHeist #InvestSmart
📢Disclaimer: This is a fun, strategic plan, but it’s not financial advice. Always do your own research and trade at your own risk, OG Thieves! 🙌
Adobe | ADBE | Long at $347.44Adobe NASDAQ:ADBE
Technical Analysis:
Trend is, overall, moving sideways. The price gap on the daily chart between $303.29 and $317.87 is likely to be closed in the near-term. The stock may reach the $280's to $290's to form a double bottom before a move up, so short-term investors should note the near-term risks. Long-term, however, if growth projections are accurate, all of those price gaps above the current price are likely to be filled...
Earnings and Revenue Growth
Expected annual revenue growth between 2025-2028 is ~41% (cumulative), growing from around $23.7 billion in 2025 to $33.3 billion in 2028.
EPS growth from $20.7 in 2025 to $26.2 in 2028.
www.tradingview.com
Health
Debt-to-Equity: 0.53x (very good)
Altman's Z-Score/Bankruptcy Risk: 10.2 (excellent/very low risk)
Quick Ratio/Ability to pay current bills: 1.02 (okay, but some risk)
Insiders
Warning: Selling heavily outweighs buying.
openinsider.com
Action
Due to the high-growth potential of NASDAQ:ADBE related to AI and its current "value" (compared purely to the rest of tech), solid health, etc., I am personally going long at $347.44. More shares will be gathered if the price reaches the low $300's or between $280-$300 and the fundamentals remain the same. Only major warning is the amount of insider selling.
Targets in 2028
$450.00 (+29.5%)
$645.00 (+85.6%)

Adobe Earnings Lotto: 365C Targeting 200%+”
🚨 **ADBE Earnings Trade Setup (2025-09-11)** 🚨
🔥 **Play of the Day: Calls**
* 🎯 Strike: **365C**
* 💵 Entry: **11.65**
* 📅 Expiry: **2025-09-12**
* 📈 Confidence: **78% (Moderate Bullish)**
📊 **Targets & Risk**
* 🛑 Stop Loss: **5.83** (-50%)
* 🎯 Profit Target: **34.95** (+200%)
* 📏 Size: 1 contract (≈2% port)
* ⏰ Timing: **Pre-earnings close**
⚡ **Rationale:**
Adobe’s **AI catalysts + flawless 8-quarter beat streak** stack the odds for upside. Fundamentals (margins, FCF, growth) are 🔥, options chain shows liquidity at **365C**, and breakeven only needs \~6.4% move. Quick exit strategy to dodge IV crush.
📊 **Expected Move:** \~8.8%
📈 **IV Rank:** 0.75
💡 **Trade Idea:** Buy 365C @ 11.65 → Stop 5.83 / PT 34.95. Risk\:Reward \~1:4.

Adobe - This triangle breaks now!🪄Adobe ( NASDAQ:ADBE ) just repeats patterns:
🔎Analysis summary:
Back in 2012 we witnessed a major triangle breakout on Adobe. The following bullrun ended in 2021 and Adobe has been consolidating ever since. But now, we are able to see a pattern repetition, with the same bullish triangle forming, which we saw about one decade ago.
📝Levels to watch:
$350, $500
SwingTraderPhil
SwingTrading.Simplified. | Investing.Simplified. | #LONGTERMVISION
