Adobe: Selling at 38.2% Fib LevelAdobe - Short Term - We look to Sell at 602.00 (stop at 627.00)
Preferred trade is to sell into rallies. Previous support, now becomes resistance at 605.00. 20 1day EMA is at 602.00. We have a 38.2% Fibonacci pullback level of 599.72 from 699.50 to 538.00. The bias is still for lower levels and we look for any gains to be limited.
Our profit targets will be 538.00 and 515.00
Resistance: 600.00 / 650.00 / 700.00
Support: 550.00 / 525.00 / 500.00
Disclaimer – Saxo Bank Group. Please be reminded – you alone are responsible for your trading – both gains and losses. There is a very high degree of risk involved in trading. The technical analysis, like any and all indicators, strategies, columns, articles and other features accessible on/though this site (including those from Signal Centre) are for informational purposes only and should not be construed as investment advice by you. Such technical analysis are believed to be obtained from sources believed to be reliable, but not warrant their respective completeness or accuracy, or warrant any results from the use of the information. Your use of the technical analysis, as would also your use of any and all mentioned indicators, strategies, columns, articles and all other features, is entirely at your own risk and it is your sole responsibility to evaluate the accuracy, completeness and usefulness (including suitability) of the information. You should assess the risk of any trade with your financial adviser and make your own independent decision(s) regarding any tradable products which may be the subject matter of the technical analysis or any of the said indicators, strategies, columns, articles and all other features.
Please also be reminded that if despite the above, any of the said technical analysis (or any of the said indicators, strategies, columns, articles and other features accessible on/through this site) is found to be advisory or a recommendation; and not merely informational in nature, the same is in any event provided with the intention of being for general circulation and availability only. As such it is not intended to and does not form part of any offer or recommendation directed at you specifically, or have any regard to the investment objectives, financial situation or needs of yourself or any other specific person. Before committing to a trade or investment therefore, please seek advice from a financial or other professional adviser regarding the suitability of the product for you and (where available) read the relevant product offer/description documents, including the risk disclosures. If you do not wish to seek such financial advice, please still exercise your mind and consider carefully whether the product is suitable for you because you alone remain responsible for your trading – both gains and losses.
Adobe


ADBE neutral ideaNASDAQ:ADBE thinking $572 with a broad market rally could take this to $578+ // bear scenario we validate downtrend and lose 567 with room to fill gap $560/558

Bearish on Adobe. ADBEWe are not in the business of getting every prediction right, no one ever does and that is not the aim of the game. The Fibonacci targets are highlighted in purple with invalidation in red. Fibonacci goals, it is prudent to suggest, are nothing more than mere fractally evident and therefore statistically likely levels that the market will go to. Having said that, the market will always do what it wants and always has a mind of its own. Therefore, none of this is financial advice, so do your own research and rely only on your own analysis. Trading is a true one man sport. Good luck out there and stay safe!

Adobe with possible 8-12% short-term returnHey Trader,
please see my current idea on the Adobe stock where my count suggests a return of around 10% by longing this stock.
For further informations please see below,
RT

ADBE, 4 Hrs, NASDAQ:ADBE
ADBE, 4 Hrs , Crab Harmonic Pattern
Buy @ 461.95 - 450.14
Sell @ T1: 546.92 , T2: 606.71
Stop Loss: 441.28
Please. Read the disclaimer, and do your own diligence.
------------------
DISCLAIMER:
I am not a financial /investment advisor. All information i am sharing here is for entertainment purposes only and should not be considered personal investment advice. While the information provided is accurate, it may include errors or inaccuracies. Please, do your diligence when it comes to investing or trading in the market. You are responsible on your choice. Thank you

Bullish RSI, CCI and OBV divergenceAdobe has traded up off the trendline today and formed bullish RSI, CCI and OBV divergences.

DocuSign Inc. and the lesson to be learnt. (TL;DR at end)When the Covid pandemic began affecting many people throughout the workplace and in their homes, companies such as NASDAQ:MSFT , Zoom and NASDAQ:GOOGL began rapidly designing software to accommodate for this very new sprouting market that nobody had ever seen before. A whole line of business dedicated to allowing people to perform their work assigned tasks from anywhere in the world or from the comfort of their couch at home. Despite the major sell-off due to the pandemic and fears of complete economic collapse in some places, a number of people and companies became considerably wealthier. A prime example that I am writing about today is DocuSign and their virtual document signing services which are in competition with NASDAQ:ADBE .
There was a massive craze over this whole digital work idea and many investors believed it was a "money-pot" for a future dominating market. Many investors began pumping money into such companies for long and short term investments. The thought behind it being, "people prefer working this way and now that they have used it, they'll never go back". This mentality obviously allowed companies like DocuSign to advance in price dramatically, because how else are you supposed to sign off a document on a desktop for instance. Despite the thought process seeming "sound", there was one major downfall.
The anticipated growth for a company like DocuSign and other competitors was astronomical. But, as Covid restrictions began to ease up slightly between the time of the announcement of the Delta variant and then Omicron, many people realised that they didn't quite enjoy working from home and/or owners of companies brought many employees back into the workplace, sales for products provided by a company like DocuSign slipped and this sent shivers through countless investors' spines as they realised how overpriced the company may have actually been in comparison to its inherent value. Needless to mention, DocuSign announcing that the "pandemic boom" in business was slowing down after they presented their slipping sales did not help in any which way, shape, nor form. This resulted in a horrific sell-off of countless stocks causing price a catastrophic price drop (especially for traders) of around $100 in Docusign and major price drops with their competitors. Consequently, Adobe had a stock price drop too as investors lost faith in their ability to maintain growth in sales (From $698 all the way through to $616 (at the time of writing)).
Now there is one major lesson to be learnt regarding this scenario and like so many before it. Deciding to become a shareholder in a company due to the potential in their industry and their presence within it alone can end horrifically. Especially when the media "hypes up" such companies resulting in horrific over-evaluations. One must perform their own investigation into the safety of such company regardless of how long you plan on holding their stock for. There is no point in putting money into a company that may not be profitable or the management consists of a number of incompetent monkeys for instance just because everybody is talking about it. You must perform your own investigation and create your own judgement on whether this company is actually worth your time. As an investor or trader, you must be careful, now as much as ever. There are countless startups having their prices floated by the media and the public's attitude towards the company which inevitably come crashing back down, even though all that could be avoided if the investor/trader actually held back until they deemed the price "acceptable or attractive" for the company.
As always, further opinions, facts and news that I may not be aware of are always welcome in the comments, it is always good to bounce ideas off of others, so comment away!
TL;DR: The work from home craze at the beginning of the pandemic ('hyped' by the media) caused many to pump money into companies that would later lose business as many returned to the workplace or their financial infrastructure was realised to be dysfunctional. One must do their own homework into companies and only pay a suitable price for the stock they're getting.

Adobe Looks like Adobe is about to complete the cup and handle formation with the breakout resistance at $673.81. I only hunt for this formation to enter most of my trades. If breakout is successful with high volume, this can be a good trade setup.

Double Top?
A double top looms on the chart. the price went up for a long time and now it looks like it wants to take a breath. What do you think?

waiting for a correctionAMD went up for a long time, forming new highs. Now the price needs to gain strength for a new rise, so I am waiting for a correction and a rebound from the level..

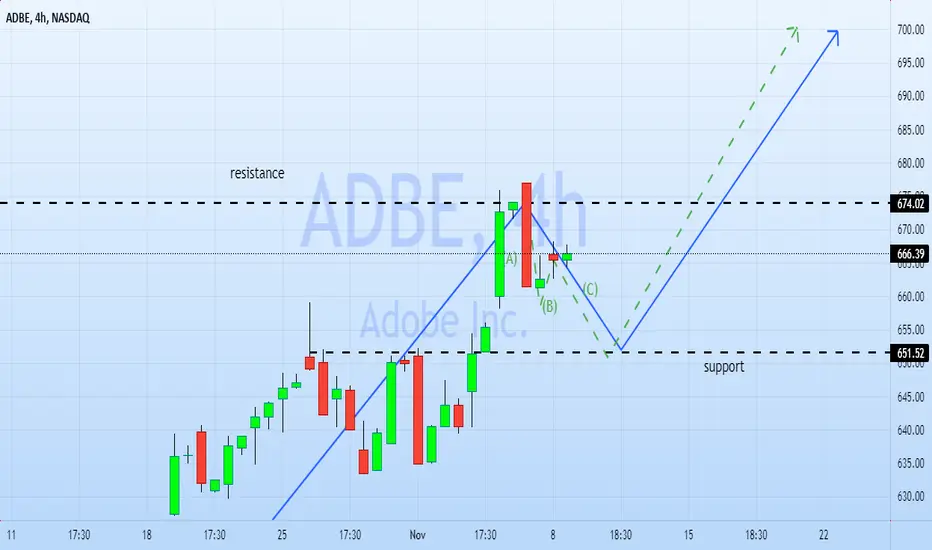
correction A-B-Cthe price draws a correction A-B-C, which will only add strength to the subsequent rise. The goal is the same, only you need to wait for a rebound from support
Correction for gaining strength? Stocks go up for a long time and confidently, and apart from a temporary respite there is no reason to doubt further growth. I expect a price around $ 700

Let's all buy a metric shit ton of $CRM and get rich.This is a chart of $CRM. The bars pattern is of $FTNT. You can do this with $ADBE and a number of other tech stocks as well. You'll probably notice $ADBE is leading, I'm betting $CRM will follow. Both will catch up to $FTNT.
The structure is ready, we've been drawing this bull flag forever. We've lost all hope in stocks. Biden flushed everyone out that is scared of a little tax bump but only poors worry about taxes... they sold the bottom. It's time.

Price goes upThe price goes up for a long time, gaining strength to renew the maximum. I expect a breakdown of resistance and growth to $ 700

My Target 720$The company's shares have been steadily rising for several weeks now. So far, there is no reason to stop the progressive movement of the global trend. I expect the price to break through the resistance. Target 720 $

ADBE Elliot wave and Wyckoff analysisNASDAQ:ADBE
Extending to the left you can see the monthly 0-1-2 fib extensions, on the right are the 2-3-4 fib extensions. As you can see there is still a lot of room to the upside on the monthly 5. Looking down into the weekly, you can see we have just finished a 2-3 move up out of a Wyckoff re-accumulation.
At the deepest part of the monthly 4 you there was a spring up with high buying volume, ending the negative Weis wave momentum and starting a new daily and weekly EW. We just finished the daily EW and the 2-3 of the weekly and you can see on the daily chart that volume has been ramping down in preparation for a correction. The stochastic is overbought but is showing a false bar so I don't recommend shorting at this time (or trading a 4).
I am watching for an ABC corrective move down from the current levels on the daily chart -- this should form the weekly 4 which once that is over I will re-enter a long position.

ADOBE in The End Lineadobe was a good performer last year , but there is always an end to every bullish rally,
it looks like this for me ...

Adobe (ADBE) Likely To Rally And Test All Time HighsThe weekly time frame shows a clear bounce off of previous trendline resistance-turned-support. A test of $525 is likely.

You can use Adobe to make $DOGE memes.If a car is a meme, and the gas is $DOGE, then the highway is Adobe.
Create memes of meme coins, but first, load up on some $ADBE. You should invest in the tools you use.
The bars pattern here is from $FTNT... they're all in the same tech basket. $FTNT is leading, $ADBE $CRM and others are following.

LONG Breakout ADOBE After Q1 after consolidationWhen discarding covid19 effect, only once since September 2012 has SMA200 been above SMA50.
Right now there is a balancing act going on.
Yet over this week the price has broken out from the previous 3 tops and had strong support in 420-430 after Q1 postings.
Since then there has been a strong RSI14 development and is showing a strong yet not "overbought" tendency.
I have entered long in 515.23 today, as the spike in price over the last 3 days will ensure that SMA50 will stay above SMA200.


Adobe: Weekly Bull BreakAs I already analyzed in the video on Monday (see attached), Adobe just broke the prolonged Weekly Bull Flag since basically August 2020. We broke & closed above the resistance yesterday on the Daily. If the bulls don't fake out & see follow through this week, Adobe can now easily go towards $600 in the coming weeks & months.
Some fundamentals : Adobe has seen quite some upside since they changed from the one-off to the monthly subscription models, since a lot more professionals could now afford it. This obviously got a lot more usage throughout the Covid period, as people were working from the home office.
Given that it still underperformed the S&P500 and went on a sideways consolidation after it rose 90% until the summer, which we have to recognize.
I'm a Photoshop & Premiere Pro user myself, and can see the value of the neat integration in the cloud.
After all: If you're not gonna own the companies you're using yourself, then what? ;)
In this case the fundamentals are now getting confirmed by the technicals.
Happy trading & investing!
