Adobe - The major triangle breakout!🎯Adobe ( NASDAQ:ADBE ) breaks out soon:
🔎Analysis summary:
For the past five years, Adobe has overall been consolidating within a bullish triangle pattern. This triangle seems to be quite similar to the triangle which we saw back in 2012. And with the current retest of the confluence of support, Adobe will now initiate the triangle breakout.
📝Levels to watch:
$360
SwingTraderPhil
SwingTrading.Simplified. | Investing.Simplified. | #LONGTERMVISION
Adobelong

Adobe analysisFrom the current structure, Adobe (ADBE) is sitting on a strong weekly support zone that has held multiple times in the past.
At the same time, the RSI is showing bullish divergence — while price action has been making lower lows, RSI has been printing higher lows. This is often a positive signal suggesting sellers are losing momentum and buyers may step in.
📈 Conclusion: My bias is that Adobe has a good probability of reversing upward from this support level, backed by both the strong demand zone and the RSI divergence. Still, markets are unpredictable, and this remains only my view.

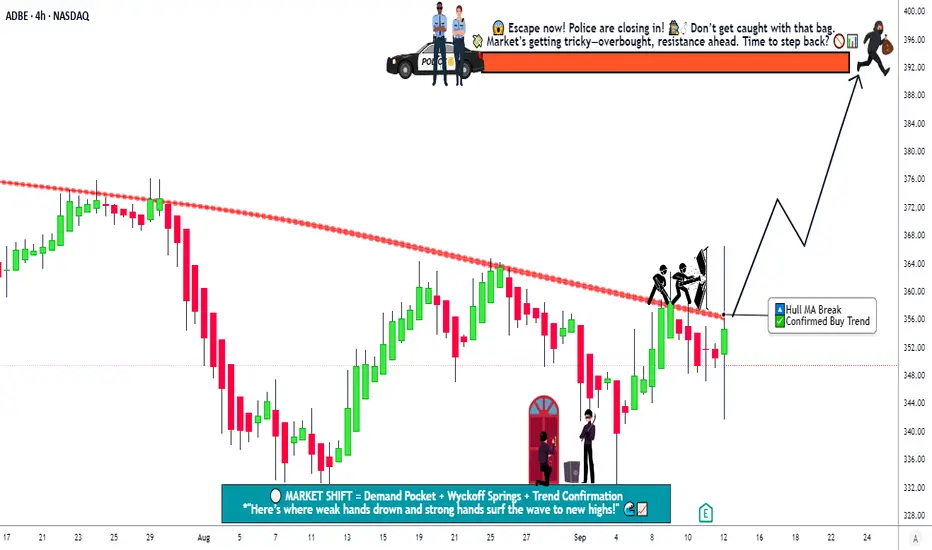
Adobe Technical Analysis! Swing/Day Trade Levels & Strategy🎯 ADBE Stock: The Great Money Heist Plan (Swing/Day Trade) 🤑💰
🚨 Ladies and Gentlemen, Welcome to the Ultimate ADBE (Adobe Inc.) Bullish Breakout Caper!
🚨Get ready to join the Thief OG Crew for a slick, calculated swing/day trade on $ADBE. This is a polished, TradingView-friendly plan designed to maximize views, likes, and potentially catch the Editor’s Pick spotlight! Let’s break it down with a fun yet professional vibe, all while respecting TradingView’s House Rules. 😎
📊 The Setup: Bullish Breakout Pending Order!
✅ Asset: NASDAQ:ADBE (Adobe Inc.)✅ Market Mood: Bullish breakout Pending with the Hull Moving Average crossing at $360.00! 📈✅ Timeframe: Swing/Day Trade (your choice, OG Thieves!)
The Hull Moving Average has flashed a green light 🚦, signaling a breakout. NASDAQ:ADBE is ready to run, and we’re here to grab the loot before the Police Barricade (resistance) stops us! 💪
🕵️♂️ The Thief Strategy: Layered Limit Orders
This is no ordinary trade — it’s a sneaky layered entry plan to maximize your chances of snagging profits. Here’s how we roll:
Entry Levels: Place multiple buy limit orders at these strategic price points to layer your entries like a master thief:
💰 $352.00
💰 $355.00
💰 $360.00
💰 $365.00
Pro Tip: Feel free to add more limit layers based on your risk appetite and market conditions! Be flexible, but stay sharp. 🔍
Why Layering? This strategy lets you scale into the trade, reducing risk if the breakout pulls back slightly before blasting off. It’s like planting multiple traps for the market to fall into! 🕸️
Note: You can enter at any price level that suits your style, but these levels are primed for action. Always confirm with your own analysis, OG Thieves! 🧠
🛑 Stop Loss: Protect Your Loot!
Thief Stop Loss: Set a stop loss at $345.00 after the breakout confirmation at $360.00.
Why? This level keeps you safe from unexpected reversals while giving the trade room to breathe.
Customize It: Adjust your stop loss based on your risk tolerance and strategy.
Dear Ladies & Gentlemen (Thief OG’s), this is your heist — set your SL to match your vibe! ⚠️
Disclaimer: I’m not here to dictate your stop loss. It’s your money, your risk, your rules. Trade responsibly! 😇
🎯 Target: Escape Before the Police Barricade!
Profit Target: Aim for $392.00, where a Police Barricade (strong resistance) awaits, combined with overbought conditions and a potential trap. 🏦
Why $392.00? This level aligns with historical resistance and RSI overbought signals. Grab your profits and escape before the market catches you! 🏃♂️
Disclaimer: Don’t feel locked into my target. Set your own profit goals based on your strategy and risk management. Take the money and run when you’re ready! 💸
🔗 Related Pairs to Watch (and Why!)
To make this heist even smoother, keep an eye on these correlated assets (all in USD):
NASDAQ:MSFT (Microsoft): Adobe and Microsoft move in sync due to their tech sector overlap. If NASDAQ:MSFT is pumping, NASDAQ:ADBE might follow. Watch its price action for confirmation. 📈
NYSE:CRM (Salesforce): Another tech giant with similar market drivers. A bullish move in NYSE:CRM could signal strength in $ADBE. 🧩
AMEX:SPY (S&P 500 ETF): The broader market index often dictates tech stock momentum. If AMEX:SPY is green, it’s a tailwind for $ADBE. 🌍
Key Correlation Point: These assets share exposure to tech sector trends and macroeconomic factors like interest rates or earnings seasons. If they’re trending up, it’s a good sign for our NASDAQ:ADBE heist! 🕵️♀️
📝 Key Notes for Thief OG’s
Confirm the Breakout: Always double-check the Hull Moving Average crossover at $360.00 and volume spikes before jumping in. No reckless heists! 🧐
Risk Management: Layered entries and stop losses are your safes. Don’t risk more than you’re willing to lose. 💼
Escape Plan: Watch for overbought RSI or sudden volume drops near $392.00. That’s your cue to cash out and vanish! 🏃♀️
Stay Flexible: Market conditions change. Adapt your entries, stops, and targets as needed. You’re a thief, not a robot! 🤖
✨ “If you find value in my analysis, a 👍 and 🚀 boost is much appreciated — it helps me share more setups with the community!”
#ADBE #StockMarket #SwingTrading #DayTrading #BullishBreakout #TechnicalAnalysis #HullMovingAverage #TradingStrategy #MoneyHeist #InvestSmart
📢Disclaimer: This is a fun, strategic plan, but it’s not financial advice. Always do your own research and trade at your own risk, OG Thieves! 🙌
Adobe | ADBE | Long at $347.44Adobe NASDAQ:ADBE
Technical Analysis:
Trend is, overall, moving sideways. The price gap on the daily chart between $303.29 and $317.87 is likely to be closed in the near-term. The stock may reach the $280's to $290's to form a double bottom before a move up, so short-term investors should note the near-term risks. Long-term, however, if growth projections are accurate, all of those price gaps above the current price are likely to be filled...
Earnings and Revenue Growth
Expected annual revenue growth between 2025-2028 is ~41% (cumulative), growing from around $23.7 billion in 2025 to $33.3 billion in 2028.
EPS growth from $20.7 in 2025 to $26.2 in 2028.
www.tradingview.com
Health
Debt-to-Equity: 0.53x (very good)
Altman's Z-Score/Bankruptcy Risk: 10.2 (excellent/very low risk)
Quick Ratio/Ability to pay current bills: 1.02 (okay, but some risk)
Insiders
Warning: Selling heavily outweighs buying.
openinsider.com
Action
Due to the high-growth potential of NASDAQ:ADBE related to AI and its current "value" (compared purely to the rest of tech), solid health, etc., I am personally going long at $347.44. More shares will be gathered if the price reaches the low $300's or between $280-$300 and the fundamentals remain the same. Only major warning is the amount of insider selling.
Targets in 2028
$450.00 (+29.5%)
$645.00 (+85.6%)

Adobe Earnings Lotto: 365C Targeting 200%+”
🚨 **ADBE Earnings Trade Setup (2025-09-11)** 🚨
🔥 **Play of the Day: Calls**
* 🎯 Strike: **365C**
* 💵 Entry: **11.65**
* 📅 Expiry: **2025-09-12**
* 📈 Confidence: **78% (Moderate Bullish)**
📊 **Targets & Risk**
* 🛑 Stop Loss: **5.83** (-50%)
* 🎯 Profit Target: **34.95** (+200%)
* 📏 Size: 1 contract (≈2% port)
* ⏰ Timing: **Pre-earnings close**
⚡ **Rationale:**
Adobe’s **AI catalysts + flawless 8-quarter beat streak** stack the odds for upside. Fundamentals (margins, FCF, growth) are 🔥, options chain shows liquidity at **365C**, and breakeven only needs \~6.4% move. Quick exit strategy to dodge IV crush.
📊 **Expected Move:** \~8.8%
📈 **IV Rank:** 0.75
💡 **Trade Idea:** Buy 365C @ 11.65 → Stop 5.83 / PT 34.95. Risk\:Reward \~1:4.

Adobe - This triangle breaks now!🪄Adobe ( NASDAQ:ADBE ) just repeats patterns:
🔎Analysis summary:
Back in 2012 we witnessed a major triangle breakout on Adobe. The following bullrun ended in 2021 and Adobe has been consolidating ever since. But now, we are able to see a pattern repetition, with the same bullish triangle forming, which we saw about one decade ago.
📝Levels to watch:
$350, $500
SwingTraderPhil
SwingTrading.Simplified. | Investing.Simplified. | #LONGTERMVISION

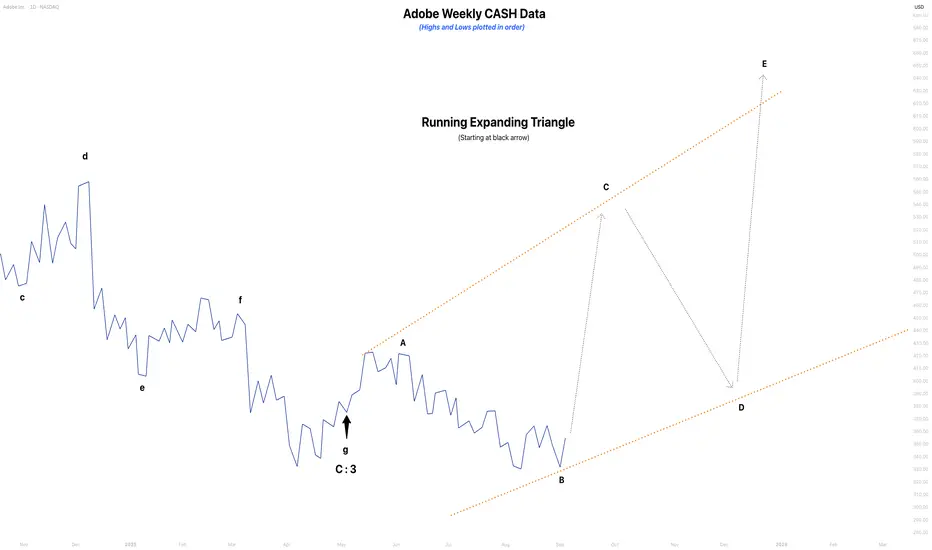
Adobe Weekly NEOWAVE AnalysisAdobe is set to report earnings next week, making this an ideal time to share my chart. Currently, Adobe appears to be forming an expanding triangle, as wave B has extended significantly below the start of wave A. We are now approaching the completion of wave B, with wave C expected to follow likely driving the price well above the start of wave B. The upcoming earnings release could provide clarity on Adobe’s outlook, potentially shifting sentiment and fueling the bullish momentum needed for wave C to unfold.
Adobe - A gigantic triangle breakout! 🔋Adobe ( NASDAQ:ADBE ) will break the triangle:
🔎Analysis summary:
Yes, for the past five years Adobe has been overall consolidating. But this consolidation was governed by a strong symmetrical triangle pattern. Thus following the underlying uptrend, there is already a higher chance that we will see a bullish breakout, followed by a strong rally.
📝Levels to watch:
$400, $700
🙏🏻#LONGTERMVISION
Philip - Swing Trader

Breaking: Adobe Inc. (ADBE) Down 10% Amidst Disappointed OutlookAdobe Inc. shares (NASDAQ: NASDAQ:ADBE ) tanked 9% in Thursday premarket trading amidst a disappointed outlook as shares faces downgrade.
Adobe (ADBE) reported record quarterly revenue above analysts’ expectations, though its outlook disappointed. The Creative Cloud developer’s revenue climbed 10% year-over-year to a record $5.71 billion, above the analyst consensus from Visible Alpha. Adjusted earnings of $2.22 billion, or $5.08 per share, rose from $2.05 billion, or $4.48 per share, a year earlier and topped estimates.
Adobe’s Digital Media arm, which includes Creative Cloud subscriptions, saw revenue of $4.23 billion, up 11% year-over-year and exceeding analysts' projections.
CEO Shantanu Narayen said Adobe is "well-positioned to capitalize on the acceleration of the creative economy driven by AI." The results come ahead of the company's Adobe Summit event next week, with analysts saying they'll be watching for updates on generative AI metrics.
Looking ahead, Adobe maintained its full-year revenue outlook of $23.3 billion to $23.55 billion, and adjusted earnings per share of $20.20 to $20.50, both below analyst consensus projections at the midpoint.
Technical Outlook
as of the time of writing, shares of Adobe Inc. (NASDAQ: NASDAQ:ADBE ) are down 10.67% trading within oversold levels with the RSI at 26. This disappointed outlook led to a gap down pattern on the chart which is a very strong bearish pattern, however, it gets filled up overtime. NASDAQ:ADBE has already broken the 1-month low base and approached the support point a break below that level could be canning for ADBE shares.

Adobe Inc. (For Study Purpose Only)Buy Recommendation
Entry Price Range: $468 - $480
Stop Loss: $430
Target Price: Based on your analysis or risk appetite (suggested to review the stock's historical resistance levels).
Rationale:
Strong Fundamentals: Adobe continues to lead in creative and digital software solutions, with consistent revenue growth and profitability.
Market Leadership: Dominant market position in creative software like Photoshop, Premiere Pro, and cloud-based solutions.
Valuation: The recommended range provides an opportunity to enter during a potential pullback.
Disclaimer
This recommendation is for educational purposes only. Always consult your financial advisor before making any investment decisions. Stock trading involves risks, including the potential loss of capital. Ensure to evaluate your risk tolerance and conduct thorough research.

Adobe - The Triangle Breakout Is Coming!Adobe ( NASDAQ:ADBE ) still remains in a bullish market:
Click chart above to see the detailed analysis👆🏻
For more than four years, Adobe has actually been moving sideways, still digesting the crazy bullrun which we saw over the past decade. Looking at the symmetrical triangle pattern though, this is just a bullish consolidation, which will most likely end with another bullish breakout.
Levels to watch: $440, $560
Keep your long term vision,
Philip (BasicTrading)

Adobe - Triangle Textbook Long Setup!Adobe ( NASDAQ:ADBE ) is breaking out soon:
Click chart above to see the detailed analysis👆🏻
After creating a rally of +2.000% over the past decade, Adobe created its all time high back in the end of 2021. The consolidation ever since has been quite expected, especially looking at market structure. But if Adobe breaks out of the current triangle, we will see new all time highs.
Levels to watch: $440, $560
Keep your long term vision,
Philip (BasicTrading)

Adobe - Preparing a multi year breakout!NASDAQ:ADBE has been consolidating for some time and is definitely ready for a breakout.
Adobe is a stock, which is clearly heading higher on a macro perspective. Just two months ago, Adobe actually retested an important horizontal structure and managed to create bullish confirmation, followed by a reversal towards the upside. Eventually, Adobe will also break out of the ascending triangle formation, which has been forming over the past 5 years.
Levels to watch: $650
Keep your long term vision,
Philip - BasicTrading

Adobe (ADBE) WaterfallI think Adobe, which has lost more than 32% since the beginning of the year, has a fair value of $522.30. However, as long as the decline continues, we should wait to buy. You can't hold a falling knife. With a break of the moving average or downtrend, I think it will reach its fair value, and with momentum, it may even go up to $620, which is the long-term downtrend. Unless the trend breaks, the decline will continue until the 300s.

Adobe - Pretty clear trading setup!Hello Traders and Investors, in this video I will take a quick look at Adobe.
--------
Explanation of my video analysis:
Back in 2012 we saw a major symmerical triangle breakout on Adobe stock which was followed by an unbelievable rally of +2.000% towards the upside. Over the past 6 years, Adobe stock has once again formed a triangle formation and just rejected the upper resistance level. If Adobe stock retest the next horizontal support towards the downside, we could already see a bullish reversal there.
--------
Keep your long term vision,
Philip (BasicTrading)

Adobe Explores OpenAI Partnership to Aid Video Editing ToolsAdobe ( NASDAQ:ADBE ), the software giant known for its innovative tools in creative content production, is delving deeper into the realm of artificial intelligence (AI) to enhance its renowned Premiere Pro video editing software. In a strategic move, Adobe ( NASDAQ:ADBE ) is exploring a potential partnership with OpenAI and other third-party AI developers to integrate generative AI tools directly into Premiere Pro.
This development marks a significant step forward for Adobe ( NASDAQ:ADBE ) as it seeks to empower video editors with AI-based features that streamline complex tasks and enhance creative possibilities. Among the planned AI-based features are the ability to seamlessly fill in parts of a scene with AI-generated objects and remove distractions without manual intervention, revolutionizing the video editing process.
At the heart of Adobe's AI endeavors lies Firefly, a powerful AI model already deployed in Adobe Photoshop for editing still images. By extending Firefly's capabilities to Premiere Pro and exploring partnerships with leading AI developers like OpenAI, Adobe ( NASDAQ:ADBE ) aims to bolster its position as an industry leader in AI-driven creative tools.
However, Adobe's decision to embrace third-party AI tools also raises questions about revenue sharing and ethical considerations. While Adobe ( NASDAQ:ADBE ) is committed to upholding ethical AI practices and ensuring user safety, the integration of third-party AI models introduces complexities regarding revenue sharing and accountability.
Despite these challenges, Adobe ( NASDAQ:ADBE ) remains steadfast in its commitment to providing users with innovative AI-driven solutions while maintaining transparency and ethical standards. With the potential for expanded choice and functionality through third-party AI models, Adobe users can expect a new era of creativity and efficiency in video editing.
Technical Outlook
Adobe Inc. stock ( NASDAQ:ADBE ) has a weak Relative Strength Index (RSI) of 28.73. However, the Monthly price chart of the stock shows an inverted hammer forming at the close of last week's trading session.

Adobe -> The Forgotten StockHello Traders,
welcome to this free and educational multi-timeframe technical analysis .
On the weekly timeframe you can see that as we are speaking Adove stock is actually approaching a quite obvious previous weekly structure area which is now turned resistance exactly at the $380 level.
You can also see that overall weekly market structure is about to shift bullish, we are already having bullish weekly moving averages and the overall price behaviour of the past couple of weeks is looking very bullish so I simply do expect a break and retest of the resistance and then more continuation towards the upside.
On the daily timeframe you can see that Adobe stock is not creating bullish market structure yet - we are currently retesting previous daily support which is now turned resistance so I am just waiting for a clear break above the zone followed by a retest and then I do expect more daily continuation towards the upside.
Thank you for watching and I will see you tomorrow!

Adobe in a flag?Adobe - 30d expiry - We look to Buy at 328.71 (stop at 312.61)
Daily signals are mildly bullish.
Price action is forming a bullish flag which has a bias to break to the upside.
Trend line support is located at 327.
We look to buy dips.
We are trading at oversold extremes.
This stock has seen good sales growth.
50 1 day EMA is at 329.
Our profit targets will be 368.88 and 372.88
Resistance: 355.67 / 365.00 / 380.00
Support: 340.00 / 325.00 / 320.20
Disclaimer – Saxo Bank Group.
Please be reminded – you alone are responsible for your trading – both gains and losses. There is a very high degree of risk involved in trading. The technical analysis , like any and all indicators, strategies, columns, articles and other features accessible on/though this site (including those from Signal Centre) are for informational purposes only and should not be construed as investment advice by you. Such technical analysis are believed to be obtained from sources believed to be reliable, but not warrant their respective completeness or accuracy, or warrant any results from the use of the information. Your use of the technical analysis , as would also your use of any and all mentioned indicators, strategies, columns, articles and all other features, is entirely at your own risk and it is your sole responsibility to evaluate the accuracy, completeness and usefulness (including suitability) of the information. You should assess the risk of any trade with your financial adviser and make your own independent decision(s) regarding any tradable products which may be the subject matter of the technical analysis or any of the said indicators, strategies, columns, articles and all other features.
Please also be reminded that if despite the above, any of the said technical analysis (or any of the said indicators, strategies, columns, articles and other features accessible on/through this site) is found to be advisory or a recommendation; and not merely informational in nature, the same is in any event provided with the intention of being for general circulation and availability only. As such it is not intended to and does not form part of any offer or recommendation directed at you specifically, or have any regard to the investment objectives, financial situation or needs of yourself or any other specific person. Before committing to a trade or investment therefore, please seek advice from a financial or other professional adviser regarding the suitability of the product for you and (where available) read the relevant product offer/description documents, including the risk disclosures. If you do not wish to seek such financial advice, please still exercise your mind and consider carefully whether the product is suitable for you because you alone remain responsible for your trading – both gains and losses.

Adobe Analysis 20.11.2022Hello Traders,
welcome to this free and educational analysis.
I am going to explain where I think this asset is going to go over the next few days and weeks and where I would look for trading opportunities.
If you have any questions or suggestions which asset I should analyse tomorrow, please leave a comment below.
I will personally reply to every single comment!
If you enjoyed this analysis, I would definitely appreciate it, if you smash that like button and maybe consider following my channel.
Thank you for watching and I will see you tomorrow!

ADOBE INCADOBE INC - Forming Bat Pattern. Which will give target as Marked in yellow 323 . Also there is huge gap down so gap filling will happen.
Disclaimer - This is my personal view for learning purpose. Not a trading recommendation.

Green on Adobe. ADBEFlat finished. We are due for another fractal. Betting on further growth given relative and short term growth in the indices.
We are not in the business of getting every prediction right, no one ever does and that is not the aim of the game. The Fibonacci targets are highlighted in purple with invalidation in red. Confirmation level, where relevant, is a pink dotted, finite line. Fibonacci goals, it is prudent to suggest, are nothing more than mere fractally evident and therefore statistically likely levels that the market will go to. Having said that, the market will always do what it wants and always has a mind of its own. Therefore, none of this is financial advice, so do your own research and rely only on your own analysis. Trading is a true one man sport. Good luck out there and stay safe.

Adobe on a sale!Adobe - 30D Expiry - We look to Buy a break of 301.11 (stop at 284.98)
With signals for sentiment at oversold extremes, the dip could not be extended.
Although the bears are in control, the stalling negative momentum indicates a turnaround is possible.
Trading close to the psychological 300.00 level.
We expect a significant move higher if prices manage to break the 300.00 resistance.
The measured move target is 360.00.
Our profit targets will be 349.49 and 359.49
Resistance: 290.00 / 300.00 / 312.00
Support: 275.00 / 265.00 / 255.00
Disclaimer – Saxo Bank Group. Please be reminded – you alone are responsible for your trading – both gains and losses. There is a very high degree of risk involved in trading. The technical analysis , like any and all indicators, strategies, columns, articles and other features accessible on/though this site (including those from Signal Centre) are for informational purposes only and should not be construed as investment advice by you. Such technical analysis are believed to be obtained from sources believed to be reliable, but not warrant their respective completeness or accuracy, or warrant any results from the use of the information. Your use of the technical analysis , as would also your use of any and all mentioned indicators, strategies, columns, articles and all other features, is entirely at your own risk and it is your sole responsibility to evaluate the accuracy, completeness and usefulness (including suitability) of the information. You should assess the risk of any trade with your financial adviser and make your own independent decision(s) regarding any tradable products which may be the subject matter of the technical analysis or any of the said indicators, strategies, columns, articles and all other features.
Please also be reminded that if despite the above, any of the said technical analysis (or any of the said indicators, strategies, columns, articles and other features accessible on/through this site) is found to be advisory or a recommendation; and not merely informational in nature, the same is in any event provided with the intention of being for general circulation and availability only. As such it is not intended to and does not form part of any offer or recommendation directed at you specifically, or have any regard to the investment objectives, financial situation or needs of yourself or any other specific person. Before committing to a trade or investment therefore, please seek advice from a financial or other professional adviser regarding the suitability of the product for you and (where available) read the relevant product offer/description documents, including the risk disclosures. If you do not wish to seek such financial advice, please still exercise your mind and consider carefully whether the product is suitable for you because you alone remain responsible for your trading – both gains and losses

ADBENot financial advice.
The essence of investing & trading is the intelligent and patient preying on the greed, fear, impatience, addiction and ignorance of the majority. It's definitionally Darwinian.
