AppLovin: Undervalued AI Ad Tech Powerhouse or Volatility Trap? AppLovin: Undervalued AI Ad Tech Powerhouse or Volatility Trap? $615 Target Incoming?
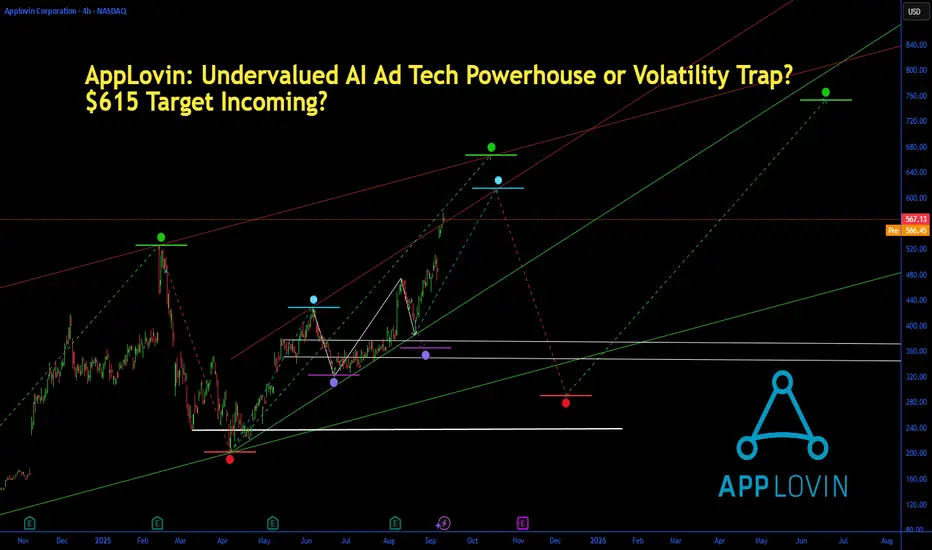
AppLovin (APP) shares are trading at $567.12 today, up 1.60% amid a fresh 52-week high and S&P 500 inclusion set for September 22, fueling a 75% YTD rally driven by its AI-powered marketing platform.
With Q2 2025 earnings crushing expectations—revenue surging 44% YoY to $1.44B and EPS at $0.89—analysts are bullish, hiking targets to $615 amid 53% projected EPS growth over 3-5 years. But at a trailing P/E of 78x, is APP the undervalued gem poised to go viral in the $500B mobile ad market, or will high beta (3.85) and market jitters trigger a pullback? Let's unpack the fundamentals, SWOT, charts, and setups for September 11, 2025.
Fundamental Analysis
AppLovin's dominance in mobile app advertising and gaming, bolstered by its AXON AI engine, has propelled explosive growth, with free cash flow hitting $1.2B TTM and margins expanding to 35%. Analysts forecast 2025 EPS of $13.49 on $5.74B revenue, up 40% YoY, as AI optimizations drive advertiser ROI in a post-cookie world. Recent S&P 500 addition could attract $10B+ in passive inflows, underscoring its undervalued status at 1.8% below fair value per DCF models. However, premium valuations reflect growth bets, with risks from ad spending slowdowns if the economy softens.
- **Positive:**
- AI platform fueling 53% EPS growth forecast; Q2 beat with 44% revenue jump and net income flipping to $236M from prior losses.
- S&P 500 entry sparks institutional demand; market cap at $191.8B undervalues its 700%+ stock surge since 2023 lows.
- Broader trends in digital ads and gaming (e.g., partnerships with Unity) position APP for 20%+ annual gains amid AI boom.
- **Negative:**
- High beta (3.85) amplifies volatility; recent 24% monthly gain risks overextension if Fed delays cuts.
- Competition from Meta and Google could pressure market share if ad budgets shift.
SWOT Analysis
**Strengths:** Leading AI-driven ad tech with 2B+ daily users; strong cash generation ($1.2B FCF) enables buybacks and acquisitions; proven turnaround from gaming to profitable software focus.
**Weaknesses:** Elevated P/E (78x TTM) signals growth dependency; high volatility with beta 3.85 exposes to market swings; reliance on mobile ecosystem vulnerable to app store policy changes.
**Opportunities:** S&P 500 inclusion for passive inflows; expansion into e-commerce and CTV ads via AI; undervalued growth at 42x forward P/E amid 53% EPS CAGR.
**Threats:** Economic downturn crimping ad spend; intensifying competition from Big Tech; regulatory scrutiny on data privacy impacting AI models.
Technical Analysis
On the daily chart, APP is in a strong uptrend, breaking to new 52-week highs at $576 after consolidating above $500 support, with volume spiking on S&P news. The weekly shows a multi-year bull flag breakout from 2023 lows, now extending with higher highs. Current price: $567.12, with VWAP near $560 as intraday pivot.
Key indicators:
- **RSI (14-day):** At 68, bullish but approaching overbought—room for extension if momentum holds. 📈
- **MACD:** Positive crossover with expanding histogram, confirming upside acceleration; watch for divergence on overbought signals. ⚠️
- **Moving Averages:** Price well above 21-day EMA ($520) and 50-day SMA ($480), with golden cross intact; 200-day EMA at $350 trails far below.
Support/Resistance: Key support at $500 (recent breakout level and 50-day SMA), resistance at $576 (all-time high) and $615 (analyst target). Patterns/Momentum: Bull flag extension targets $650; strong buy rating for 1-week horizon. 🟢 Bullish signals: Volume surge and S&P catalyst. 🔴 Bearish risks: Overbought RSI could prompt 10% pullback on profit-taking.
Scenarios and Risk Management
- **Bullish Scenario:** Break above $576 on S&P inflows or soft CPI data targets $615 short-term, then $650 by year-end. Buy pullbacks to $500 for high-conviction entries.
- **Bearish Scenario:** Drop below $500 eyes $450 (200-day EMA); broader tech selloff could retrace 15-20% if growth slows.
- **Neutral/Goldilocks:** Range-bound $500–$576 if data mixed, ideal for options plays or waiting for Q3 earnings.
Risk Tips: Set stops 3% below support ($485) to manage volatility. Risk 1-2% per trade. Diversify with META or GOOGL to hedge ad sector correlations—avoid overexposure in high-beta names.
Conclusion/Outlook
Overall, a bullish bias if APP sustains above $500, highlighting its undervalued growth with 50%+ upside amid AI ad dominance and S&P buzz—perfect for viral momentum in retail circles. But monitor Fed decisions and Q3 guidance for confirmation; this fits September's small-cap rotation into high-growth tech. What’s your take? Loading up on APP's rally or waiting for a dip? Share in the comments!
Adtech
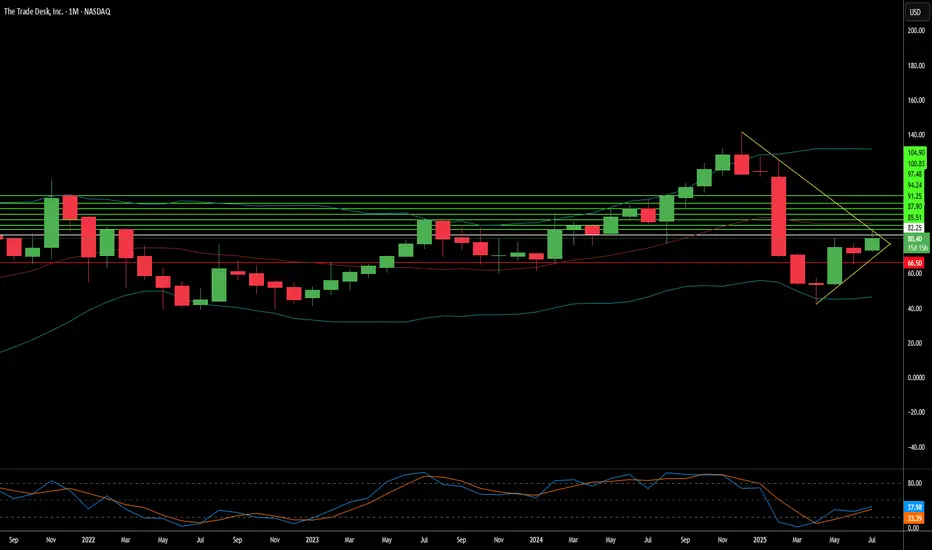
The Trade Desk: Why the Sudden Surge?The Trade Desk (TTD) recently experienced a significant stock surge. This rise stems from both immediate market catalysts and robust underlying business fundamentals. A primary driver was its inclusion in the prestigious S&P 500 index, replacing Ansys Inc. This move, effective July 18, immediately triggered mandated buying from index funds and ETFs. Such inclusion validates TTD's market importance and enhances its visibility and liquidity. This artificial demand floor, coupled with TTD's $37 billion market capitalization, underscores its growing influence within the financial landscape.
Beyond index inclusion, TTD benefits from a significant structural shift in advertising. Programmatic advertising is rapidly replacing traditional media buying, expected to account for nearly 90% of digital display ad spending by 2025. This growth is driven by advertisers' need for transparent ROI, publishers avoiding "walled gardens" through platforms like TTD's OpenPath, and AI-driven innovation. TTD's AI platform, Kokai, greatly lowers acquisition costs and enhances reach, resulting in over 95% client retention. Strategic partnerships in high-growth areas like Connected TV (CTV) further reinforce TTD's leadership.
Financially, The Trade Desk demonstrates remarkable resilience and growth. Its Q2 2025 revenue growth of 17% outpaces the broader programmatic market. Adjusted EBITDA margins hit 38%, reflecting strong operational efficiency. While TTD trades at a premium valuation - over 13x 2025 sales targets-its high profitability, substantial cash flow, and historical investor returns support this. Despite intense competition and regulatory scrutiny, TTD's consistent market share gains and strategic positioning in an expanding digital ad market make it a compelling long-term investment.
Life360(LIF)–Expanding Beyond Location into a Lifestyle PlatformCompany Snapshot:
Life360 NASDAQ:LIF is evolving from a location-sharing app into a comprehensive family safety and services platform, now integrating offerings across auto insurance, elderly care, and financial tools to deepen user engagement and drive revenue diversification.
Key Catalysts:
Feature Expansion & Tile Integration 🧩
The integration of Tile trackers and enhanced in-app features are significantly boosting platform utility, retention, and cross-selling opportunities.
International Momentum 🌍
International MAUs surged 46% YoY in 2024, with low market penetration pointing to substantial global upside as localization and partnerships scale.
Monetization Strength 💵
Ad and partnership revenue rose 41% YoY to $36M, reflecting the platform’s growing ability to monetize its large and highly engaged user base.
Investment Outlook:
Bullish Entry Zone: Above $55.00–$56.00
Upside Target: $85.00–$87.00, supported by product innovation, international expansion, and ad monetization gains.
📊 As Life360 transitions into a full-stack digital safety and services hub, it’s unlocking scalable growth across multiple verticals.
#Life360 #LIF #FamilyTech #LocationSharing #AutoInsurance #Fintech #ElderlyCare #UserGrowth #AdTech #TechStocks #GlobalExpansion

Reddit, Inc. (RDDT) – Global Growth & Monetization TailwindsCompany Snapshot:
Reddit NYSE:RDDT is a community-centric social media platform, uniquely positioned through user-generated content and authentic engagement. With over 100,000 active communities, Reddit is a magnet for targeted brand advertising and premium ad formats.
Key Catalysts:
AI-Driven International Expansion 🌐
Launched AI-powered post translation in 35+ countries, including Brazil, Germany, and Italy.
This unlocks new audiences and ad monetization in high-growth global markets.
High Margin Business Model 💸
Reported a 90.5% gross margin—highlighting Reddit’s asset-light infrastructure and operational efficiency.
Sets the stage for significant operating leverage as revenue scales.
Ad Revenue Acceleration 📊
Brands increasingly view Reddit as a premium ad environment, given its contextual targeting and deep user engagement.
Expanding tools for advertisers (e.g., Dynamic Product Ads) may enhance monetization per user.
Investment Outlook:
Bullish Entry Zone: Above $120.00–$122.00
Upside Target: $190.00–$195.00, supported by global reach, margin strength, and ad revenue tailwinds.
🧠 Reddit isn’t just a social platform—it’s a monetizable network of influence, fueled by community trust and scalable technology.
#Reddit #RDDT #SocialMediaStocks #AIExpansion #GrossMargin #AdTech #CommunityEngagement #TechStocks #Bullish #DigitalAds #UserGeneratedContent #GlobalGrowth #FreeCashFlow #GrowthStocks

AppLovin Corporation (APP) – Rewiring Ad Tech with AI at ScaleCompany Snapshot:
AppLovin NASDAQ:APP is shedding its legacy gaming identity and emerging as a pure-play AI advertising infrastructure leader. Post its $900M gaming unit divestiture, the company is laser-focused on AXON 2.0, its next-gen AI ad engine, positioning APP as one of the most transformative players in the digital ad ecosystem.
🚀 Key Growth Drivers:
🧠 AXON 2.0 – AI-Powered Programmatic Ad Platform
Delivers real-time ad bidding with predictive optimization
Retail and eCommerce verticals seeing rapid adoption
Scalable infrastructure = operating leverage + high margin tailwinds
🛠️ Self-Serve & GenAI Expansion
Self-serve ad tools on the roadmap = democratizing access for SMBs
Generative AI ad creatives enable fast, customized campaigns at scale
Broadens TAM beyond top-tier advertisers to long-tail marketers
💰 High-Margin, Asset-Light Model
Post-divestiture, APP’s margins are structurally higher
Lean, software-first model with strong unit economics and cash generation
Flexibility for buybacks, R&D, or strategic M&A
📊 Market Positioning & Flywheel
Network effects: More advertisers = better data = smarter bidding
Competes with The Trade Desk, Google DV360, and Meta in ad optimization
First-mover advantage in mobile AI bidding infrastructure
📈 Financial & Strategic Highlights:
Q/Q margin expansion amid rising advertiser retention
Structural cost improvements post-gaming spinout
Potential for SEED_TVCODER77_ETHBTCDATA:2B + in annualized EBITDA as AI scaling accelerates
🧭 Investment Outlook:
✅ Bullish Above: $255.00–$260.00
🚀 Upside Target: $520.00–$525.00
🎯 Thesis: AppLovin is evolving into the NVIDIA of mobile ad tech—using proprietary AI infrastructure to reshape programmatic advertising. With high-margin growth, expanding use cases, and a clear product vision, APP is a top-tier AI advertising compounder.
#AppLovin #APP #AdTech #AXON #AIAdvertising #Programmatic #DigitalMarketing #GrowthStock

PERI : POSITIION TRADEQ3 : EARNINGS CALL HIGHLIGHTS:
Looking at the last 8 quarters, our ability to exceed the rule of 40 is not a series of anomaly or a one-off success. Quite the opposite, we are outperforming the industry because we are built on the fundamental recognition that adtech must be able to respond, underlying response to the trend with ability and agility.
Revenue of $158.6 million, reflecting 31% year-over-year growth, the highest quarterly revenue since 2014. Adjusted EBITDA of $33 million, 21% of revenue compared with 15% last year, reflecting 87% year-over-year growth. Net -- GAAP net income of $25.6 million, 141% year-over-year growth, the highest quarterly net income since 2014. Non-GAAP diluted earnings per share of $0.61, reflecting 53% year-over-year growth.
The third quarter revenue was $158.6 million, an increase of 31% year-over-year. The strong continued revenue growth reflected a CAGR 38%. Display advertising revenue increased by 26% year-over-year to $86.8 million, 55% of total revenue. Market adoption of our holistic video platform solution continued to rise. Video revenue more than 3% year-over-year, representing 44% of display advertising revenue. The number of video platform publishers increased by 88% year-over-year from 34% to 64%, and the revenue from retained video platform publishers increased by 67% year-over-year.
Third quarter OpEx and COGS amounted to $31.7 million or 20% of revenue compared with $33.1 million or 27% of revenue last year. This impressive achievement reflects the execution of our business strategy.
On a GAAP basis, net income was $25.6 million or $0.53 per diluted share, an increase of 141% compared with $10.6 million or $0.28 per diluted share in the third quarter of 2021. On a non-GAAP basis, net income was $29.9 million or $0.61 per diluted share, an increase of 94% compared with $15.4 million or $0.40 per diluted share in the third quarter of 2021.
Adjusted EBITDA of $33 million, reflecting 94% year-over-year growth, adjusted EBITDA margin of 21% compared with 15% last year. Adjusted EBITDA to revenue, excluding TAC increased from 37% in the third quarter of 2021 to 51% during the third quarter of 2022.
Operating cash flow was $34.7 million compared with $14.2 million in the third quarter of 2021, reflecting 145% year-over-year growth. As of September 30, 2022, cash, cash equivalents, and short-term bank deposits of $390 million compared with $322 million as of December 31, 2021; continuously generating positive cash flow.
Full earnings call transcript and presentation on the links below:
Transcript / Audio : seekingalpha.com
Presentation : wp-cdn.perion.com

One of the Fastest Growing Companies in AdTechAfter a monster year of growth for Digital Turbine, analysts believe the expansion doesn't stop here.
Over the next three years, analysts predict the company will continue to grow EPS at a ~ 45% CAGR while expanding revenue at an average ~ 28% CAGR.
Although short-term liabilities outweigh short-term assets like cash and A/R due to acquisitions, it is predicted that the procurements of Fyber, AdColony, and Appreciate will help accelerate Digital Turbine's more prominent and profitable role in the fast-growing and secularly-thriving $200+ billion mobile ad/connected TV marketplace.
As for the technicals, we're witnessing a similar setup as the '18-'19 bull run that $APPS experienced. Distribution breakdowns into a falling wedge until volume begins to pick back up (breakdowns are primarily due to the macro environment, not the company's fundamentals). I chose the fiscal Q4 2022 ER date as a rough estimate for when $APPS might break the downtrend. By no means has Digital Turbine reversed course fundamentally, and I'd like the next ER to confirm that.
GLTA! (Disclaimer, I am long $APPS with both a long-term position and LEAPS call options).

KBNT Inverse Head & ShouldersKBNT has developed an inverse "Head and Shoulders" pattern this month. This is a strong indicator that the down trend is about to reverse up.
After the price crosses the "Neck line" (About $7.43 +/-) it is possible that KBNT will breakout gaining $2.50 in value (The height of the head to neck line) arriving at a potential target price of $9.93.
Just my opinion, not financial advice.

