AEVO/USDT — At Demand Zone: End of the Bearish Phase?📊 Technical Overview:
AEVO/USDT is showing signs of structural stabilization after a prolonged downtrend since early 2024.
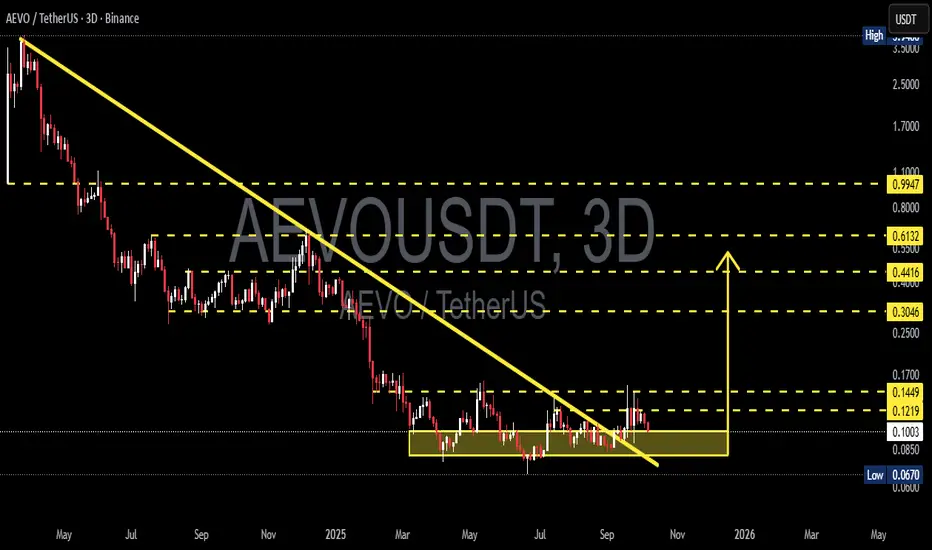
The major descending trendline (yellow) that had been acting as dynamic resistance has now been broken to the upside, indicating early weakness in bearish momentum.
Currently, price is consolidating within the 0.10–0.08 USDT demand zone, which has repeatedly absorbed selling pressure — marking it as a key area of institutional interest and potential accumulation.
This area represents a critical accumulation base, typically seen before large directional moves or macro reversals in higher timeframes.
---
🔶 Structural and Technical Insights:
Downtrend Line Breakout: The long-term descending trendline has been breached, suggesting a potential shift in the macro market structure.
Active Demand Zone (0.10–0.08): Price continues to defend this zone strongly, reflecting buyer absorption and accumulation behavior.
Base Formation / Range Consolidation: The sideways structure indicates a phase of market reaccumulation or base building — often the precursor to a new trend.
Key Levels to Watch:
Major Support: 0.10 – 0.08 USDT
Immediate Resistance: 0.1219 – 0.1449 USDT
Upside Targets: 0.3046 → 0.4416 → 0.6132 → 0.9947 USDT
---
🟩 Bullish Scenario (Potential Macro Reversal):
1. Main Confirmation: A 3D candle close above 0.145 USDT with strong buying volume.
2. Technical Validation: Such a breakout would confirm AEVO’s exit from the accumulation range, signaling the beginning of a mid-term uptrend.
3. Upside Targets:
Target 1: 0.3046 USDT
Target 2: 0.4416 USDT
Extended Targets: 0.6132 – 0.9947 USDT
4. Risk Management: Stop-loss below 0.0800 USDT, or apply a trailing stop after a confirmed breakout to protect profits.
> Note: Volume-backed breakouts on the 3D timeframe often serve as early confirmations of trend shifts from bearish to bullish.
---
🟥 Bearish Scenario (Breakdown from the Accumulation Base):
1. Confirmation: A confirmed 3D candle close below 0.080 USDT.
2. Implication: This would signal the failure of the demand zone, potentially extending the downtrend.
3. Targets: Immediate support lies at 0.0670 USDT (the previous structural low).
A breakdown below this level could expose AEVO to further markdowns with limited structural support below.
---
AEVO currently sits within a decision zone where the next directional move will be defined.
The 0.10–0.08 USDT demand area is the key battleground — if buyers maintain control, a structural reversal could unfold.
A confirmed breakout above 0.145 USDT would mark a macro trend reversal, while a close below 0.08 USDT would validate a continuation of the bearish trend.
---
Conclusion:
AEVO/USDT is building a large-scale accumulation structure around the 0.10–0.08 zone, indicating that the market may be nearing the end of its distribution phase.
A confirmed breakout above 0.145 USDT could trigger a major bullish reversal, targeting mid-term resistance levels.
However, failure to hold the 0.08 support would reintroduce strong bearish pressure and potentially test the previous low at 0.0670 USDT.
This remains a critical inflection point for AEVO’s broader trend direction.
---
#AEVO #AEVOUSDT #CryptoAnalysis #TechnicalOutlook #MarketStructure #PriceAction #SwingTrading #TrendReversal #CryptoSetup #AltcoinAnalysis
Aevousdtidea
AEVO/USDT — Accumulation at Key Zone: Breakout or Breakdown?📖 Full Analysis
Since its listing, AEVO has been in a heavy downtrend, consistently forming lower highs under the dominant descending trendline (yellow). However, for the past several months, the price has been holding in the same range: 0.067 – 0.12 (yellow box).
This zone is highly significant:
Consistent demand: buyers are stepping in every time price approaches 0.067.
Weakening sell pressure: sellers fail to push price to new lows.
Pattern formation: the structure resembles a descending triangle — typically bearish, but a confirmed breakout can flip the script into a major reversal.
In short, AEVO is now at a critical crossroads: Will this accumulation become the foundation for a bullish reversal, or a trap before another leg down?
---
📈 Bullish Scenario
1. Main triggers:
Breakout above the descending trendline
3D candle close above 0.1219 with strong volume
2. Upside targets after breakout:
TP1: 0.1449 (minor resistance)
TP2: 0.3046 (major resistance zone)
TP3: 0.4416 – 0.6132 (key Fibonacci levels)
3. Bullish strength:
A confirmed breakout would turn this entire range into a long-term bottom structure, potentially attracting mid-term investors.
---
📉 Bearish Scenario
1. Main triggers:
Rejection at the trendline or failure to close above 0.1219
Breakdown below 0.0670 with a confirmed 3D close + volume spike
2. Downside targets after breakdown:
0.04 – 0.05 (next psychological zone, no strong supports below)
Potential deeper continuation if demand fails to hold
3. Bearish bias:
Historically, descending triangles break to the downside more often than not, so this risk must be respected.
---
🎯 Key Levels to Watch
Support: 0.0670 – 0.12
Immediate resistance: 0.1219 – 0.1449
Extended targets: 0.3046 → 0.4416 → 0.6132 → 0.9947
---
⚖️ Conclusion
AEVO is consolidating in a long-term accumulation zone that will define its next big move.
Bullish case: Breakout above trendline + close > 0.1219 → reversal potential toward higher levels.
Bearish case: Breakdown below 0.067 → continuation of the macro downtrend.
On the 3D timeframe, signals carry heavier weight. Patience and strict risk management are key.
This is not financial advice — purely a technical outlook.
---
AEVO is consolidating in a critical zone (0.067–0.12). A breakout above the downtrend + close > 0.1219 could target 0.1449 → 0.30+. A breakdown below 0.067 risks further bearish continuation toward 0.04–0.05. AEVO is at a major decision point.
---
#AEVO #AEVOUSDT #CryptoAnalysis #Altcoins #Breakout #DescendingTriangle #Accumulation #SupportResistance #SwingTrade

AEVO/USDT – Major Trendline Breakout! Is This the Beginning?🔍 Chart Overview & Pattern Analysis
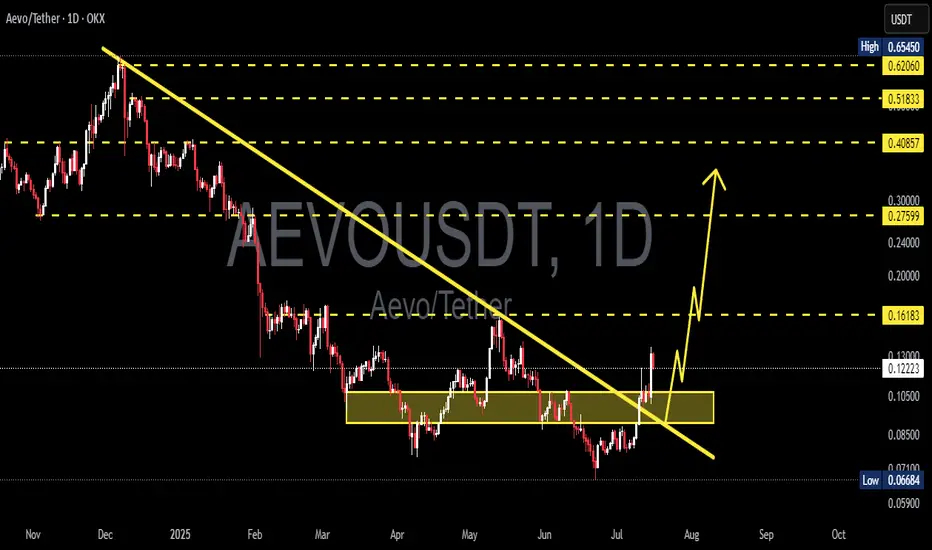
The AEVO/USDT daily chart reveals a significant breakout from a long-term descending trendline that has been intact since November 2024. This trendline acted as a strong dynamic resistance, suppressing every bullish attempt—until now.
A clear multi-month accumulation zone is visible between $0.080 – $0.105 (highlighted in yellow). Price tested this support zone multiple times, forming a strong base of demand. The combination of horizontal support and descending resistance creates a classic descending triangle breakout, often signaling a trend reversal when broken to the upside.
What's more, price action recently:
Broke above the trendline with strong bullish candles
Retested the breakout zone successfully
Is now forming a potential bullish continuation structure (mini bull flag or pennant)
This structure suggests that the bulls are not done yet—and momentum could be accelerating.
🟢 Bullish Scenario – The Path to Higher Highs
If AEVO continues to hold above the breakout zone, the following upside targets become very realistic:
✅ Target 1: $0.16183 – Previous resistance zone, short-term TP.
✅ Target 2: $0.27599 – Key horizontal resistance from late Q1 2025.
✅ Target 3: $0.40857 – Weekly structure resistance.
✅ Target 4: $0.51833 – Bullish extension zone.
🎯 Ultimate Bull Target: $0.62660 – Full recovery to pre-downtrend levels.
Confluence factors supporting this bullish outlook:
Breakout above dynamic and static resistances
Accumulation breakout after long consolidation
Higher low and bullish retest pattern
Bullish momentum building with volume confirmation (volume not shown but implied)
🔴 Bearish Scenario – Key Levels to Watch
In case of a false breakout or macro weakness:
Breakdown below $0.105 could invalidate the bullish structure
Price could revisit $0.080 or even $0.06684 (last line of defense)
A daily close below this zone would shift the bias back to bearish or neutral
However, as long as price stays above the yellow support box, the bullish thesis remains valid.
---
🧠 Key Technical Highlights
Pattern: Descending Triangle Breakout + Accumulation Base
Trend Shift: From Bearish to Bullish (confirmed with breakout + retest)
Momentum: Building up toward higher time frame resistances
Market Psychology: Smart money likely accumulated during sideways chop
📣 Final Thoughts
AEVO/USDT is showing one of the cleanest breakout structures in the altcoin space right now. With clear upside targets, a retested breakout zone, and strengthening market structure, this could be the early phase of a major bullish leg.
Traders and investors should watch for confirmation of higher highs and pullbacks to the $0.105 zone for potential entries.
#AEVOUSDT #CryptoBreakout #TrendReversal #AltseasonReady #DescendingTriangle #CryptoTA #BullishCrypto #AltcoinAnalysis #TechnicalBreakout #AEVOAnalysis
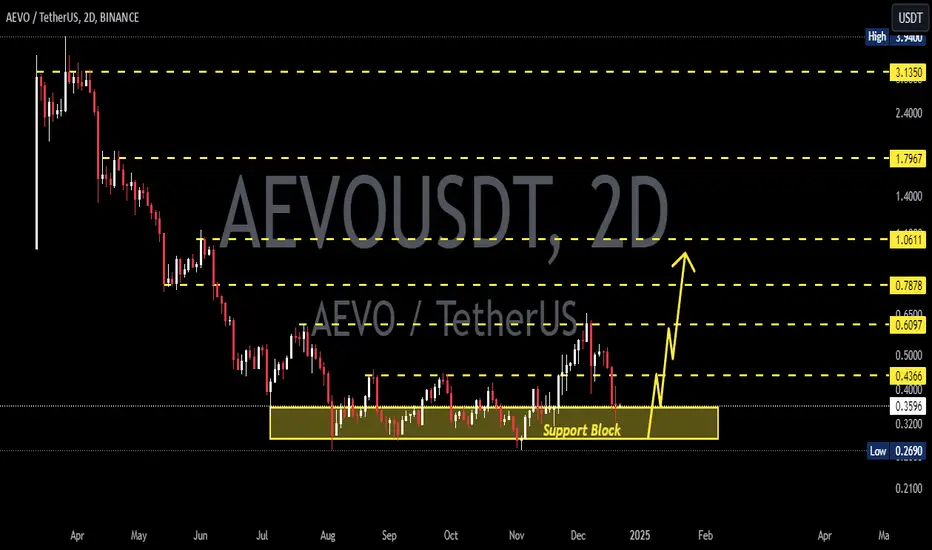
AEVOUSDT 2DAEVO ~ 2D
#AEVO If you still have Conviction on the coin,. Buy gradually within this support block,. with a minimum target of 20%++
AEVOUSDT 2DAEVO ~ 2D
#AEVO If you still have Conviction on this coin,. Buy in stages from here. with a short term target of at least 20%++. Bulls will still pump up prices from here.

AEVOUSDTAEVO ~ 2D
#AEVO We were late in finding the lowest price on this coin.
For now,,. If you are an aggressive trader, you can buy gradually after this red resistance line is successfully broken through with strong volume. or if you are a trader who plays it safe,. you can place buy on this support block, However, if the bullish momentum on AEVO is still strong, then you will miss your opportunity.


AEVOUSDTEVO ~ 1D ✅
#AEVO In the 1D Time Frame, ASX:AEVO Successfully breaking out of this descending pattern, As long as price holds here, we think bullishness will continue to push price upwards.
