AIXBT/USDT – Dead Cat Bounce or Trend Reversal?AIXBT/USDT on the 2D timeframe remains in a long-term bearish trend since early 2025. Price has consistently formed lower highs and lower lows, clearly respecting a descending trendline resistance that continues to suppress upside movement.
Currently, price is attempting a technical rebound from the lower demand zone after a strong sell-off and a short accumulation phase near the end of 2025.
---
Pattern & Price Structure
Main pattern identified:
Descending Trendline / Downtrend Structure
Multiple rejections from the descending trendline, confirming seller dominance.
A small base formation near the bottom, indicating early accumulation after capitulation.
Key characteristics:
High volatility during the previous breakdown (panic selling phase).
The current bounce is still a pullback within a broader downtrend, not a confirmed reversal.
---
Key Levels (Support & Resistance)
Key Support Levels:
0.033 – 0.035 USDT → Major demand zone
0.038 – 0.040 USDT → Minor support (current price area)
Key Resistance Levels:
0.054 USDT → Minor resistance
0.069 USDT → Mid-term resistance
0.086 USDT → Strong resistance
0.121 USDT → Major resistance
0.219 USDT → Large supply zone / previous distribution area
---
Bullish Scenario
A bullish scenario becomes valid only if:
Price breaks and closes decisively above the descending trendline
Followed by a higher high and higher low structure on the 2D timeframe
Bullish targets:
0.054 USDT
0.069 USDT
0.086 USDT
0.121 USDT (extended target if momentum strengthens)
Bullish implication:
Confirmation of a medium-term trend reversal
Shift in market structure from bearish to bullish
---
Bearish Scenario
The bearish continuation remains likely if:
Price fails to break the descending trendline
Strong rejection occurs around the 0.045 – 0.054 USDT area
Price breaks back below the 0.035 USDT support
Bearish targets:
Retest of 0.033 USDT
Further downside continuation if support fails
Bearish implication:
The current rebound is only a dead cat bounce
The primary downtrend remains intact
---
Conclusion
AIXBT/USDT is currently at a critical decision zone. Price action will determine whether this move develops into:
A confirmed trend reversal (bullish breakout), or
A continuation of the dominant downtrend (bearish rejection)
Traders should wait for clear confirmation above the descending trendline before considering long positions and remain cautious of rejection scenarios below major resistance levels.
---
#aixbt #aixbtusdt #cryptoanalysis #altcoinanalysis #technicalanalysis #downtrend #trendline #supportresistance #marketstructure #altcointrading
Aixbt


AIXB/USDT — Decision Zone: Reversal or Major Breakdown Ahead?
Main Summary:
AIXBT is currently standing at a critical juncture. After a strong rejection from the descending trendline, price has pulled back to retest the key demand zone at 0.0793–0.0690, which also aligns perfectly with the Fibonacci retracement 0.5–0.618 area — a golden pocket where buyers often reappear.
This is the balance point between buyers and sellers, where the next move will define the mid-term direction of this market.
---
Structure & Technical Pattern
Price continues to print lower highs since May, forming a clear descending structure.
The yellow zone 0.0793–0.0690 has acted as a major accumulation base, providing strong reactions in previous cycles.
The pattern resembles a Descending Triangle, where an upside breakout could trigger a reversal, while a downside break could accelerate the bearish continuation.
---
Bullish Scenario — Golden Zone Reversal Setup
Confirmation Required: Daily close above the descending trendline and a breakout above 0.102.
Once confirmed, it would mark the first higher high after a prolonged downtrend — signaling a potential trend reversal.
Upside targets:
1. 0.128 → first psychological resistance & supply zone
2. 0.181 → mid-term target if momentum sustains
3. 0.234 → full measured move from triangle breakout
A strong bullish reaction here could ignite the start of a major reversal phase, especially if supported by increasing volume.
---
Bearish Scenario — Breakdown Confirmation
Confirmation Required: Daily close below 0.0690 with strong selling volume.
This would confirm a descending triangle breakdown, signaling the continuation of the broader downtrend.
Downside target: around 0.046, the previous swing low and last major demand zone.
Losing the yellow block means buyers lose full control, pushing price into an extended distribution phase.
---
Momentum Key Points
Zone 0.0793–0.0690 = Decision Area.
This is where the real battle happens — either as a launchpad for a strong reversal or a trap zone before deeper decline.
Volume and candle reaction in this area will be crucial to confirm direction.
Watch for bullish engulfing, hammer candles, or RSI divergences to confirm potential reversal setups.
---
Conclusion
AIXBT is now entering a “do or die” phase, where the yellow block will determine the next major market structure.
A sustained hold above and breakout through the trendline could spark a strong recovery rally toward 0.128–0.181.
A confirmed breakdown below 0.069 could drag the market back down to 0.046.
This is not just another support — it’s the final accumulation zone before a possible structural shift.
---
#AIXBT #CryptoAnalysis #PriceAction #BreakoutSetup #DescendingTriangle #CryptoTrading #AltcoinWatch #SupportAndResistance #FibRetracement #MarketStructure

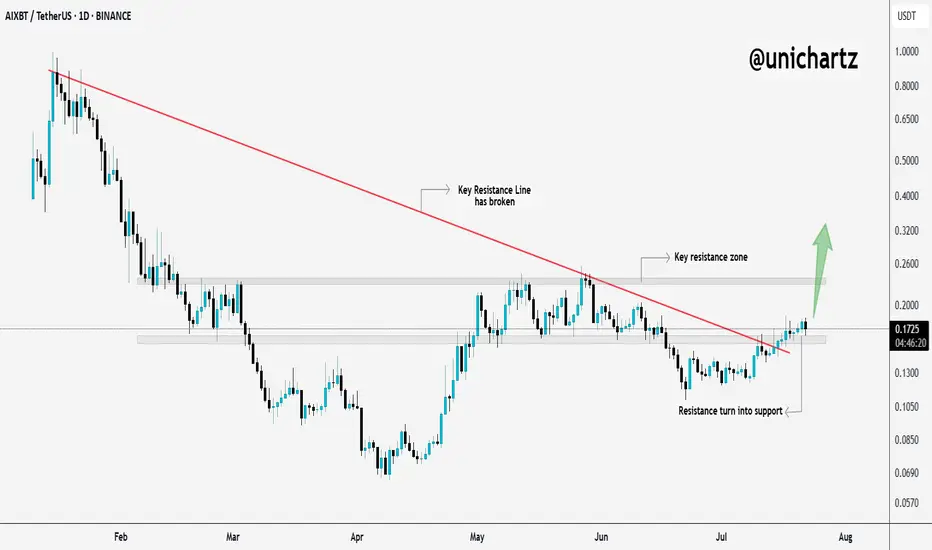
AIXBT Approaching Breakout Zone$AIXBT/USDT has fully recovered from the recent crash and is now trading near a key resistance, a level that previously acted as strong support.
If the price manages to close above this zone, it could trigger a massive upside move. Definitely one to keep a close eye on.
DYOR, NFA

$AIXBT Gains Steam as AI Heats UpThe AI trading sector is heating up once again — and BINANCE:AIXBTUSDT is at the forefront of the rally. The token jumped over 38% today, driven by renewed excitement around AI agents and automated trading technologies.
The surge in $AIXBT has also sparked speculation that other AI tokens like VIRTUAL, ACT, and FET could be next in line for a run.
From a technical standpoint, $AIXBT has broken above $0.070, flipping a key resistance level into support. With momentum and sentiment both trending bullish, the setup hints at further upside toward the $0.116–$0.130 range.
That said, a drop below $0.070 could shift the tone, exposing the token to potential downside toward $0.050.

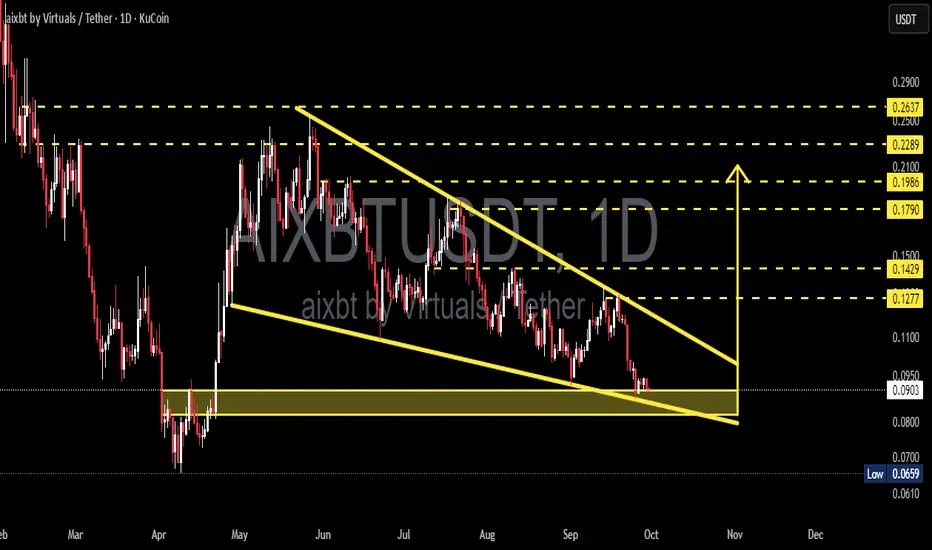
AIXBTUSDT — Falling Wedge at Demand Zone: Reversal or Breakdown?Analysis
AIXBT/USDT is currently trading within a Falling Wedge pattern on the daily timeframe, a classic setup that often signals a potential bullish reversal if confirmed by an upside breakout.
Right now, price is sitting exactly at the 0.08–0.09 demand zone, a key support area that has held multiple times before. This makes the current level a critical decision point: will we see a strong rebound (bullish reversal) or a breakdown to new lows?
---
Technical Structure
Main Pattern: Falling Wedge → generally bullish once a breakout occurs.
Key Demand Zone: 0.08–0.09 (currently being tested).
Next Major Support if Breakdown: 0.0659 (previous swing low).
Resistance / Upside Targets:
0.1277
0.1429
0.1790
0.1986
0.2289
0.2637
---
Bullish Scenario
Price holds above 0.08–0.09 and forms a reversal candle (hammer, bullish engulfing, pin bar).
Breakout confirmed with a daily close above the wedge trendline + rising volume.
Upside targets: 0.1277 → 0.1429 → 0.1790, with further extension possible toward 0.1986–0.2289.
Example aggressive setup:
Entry ~0.085, Stop ~0.078.
First target 0.1277 → offering R:R above 5, attractive for swing traders.
---
Bearish Scenario
A daily close below 0.08 invalidates the demand zone.
Breakdown opens the path to 0.0659 as the first target.
If that fails, the psychological level around 0.05 becomes the next liquidity zone.
Example short setup (margin traders only): Entry 0.079, Stop 0.088, Target 0.0659 → R:R ~1.4.
---
Falling Wedge Insight
This wedge reflects weakening selling pressure, with lower highs and lower lows converging toward the apex. Often, such setups resolve with a strong move upward, especially after prolonged downtrends. However, traders should beware of false breakouts — confirmation via daily close + volume + successful retest is essential before scaling into larger positions.
---
Strategy & Risk Management
Aggressive: Buy within 0.08–0.09 demand zone with a tight stop below 0.078.
Conservative: Wait for a confirmed breakout above the wedge (~>0.13) and enter on retest.
Risk management: Limit exposure to 1–3% per trade; scale out profits at resistance levels.
Note: Low-cap altcoins can be volatile with wide spreads — use limit orders and watch liquidity closely.
---
Conclusion
AIXBT/USDT is at a critical inflection point. With a falling wedge pattern and price sitting right inside the 0.08–0.09 demand zone, the market is preparing for a decisive move.
If support holds: strong chance of reversal toward higher resistances.
If support breaks: expect deeper correction to 0.0659 or lower.
In short, AIXBT is not in ordinary sideways action — it’s at a crossroads where the next move could define its medium-term trend.
---
#AIXBT #AIXBTUSDT #Crypto #Altcoin #TechnicalAnalysis #FallingWedge #Support #Breakout #BullishScenario #BearishScenario #RiskManagement
AIXBT Short Setupit is not detailed analys just a position take it or not I am not gonna explain it
Always manage your own risks this is not a investment advise I am not responsible neither your loss nor profit.
AIXBT: The Return of the AI Agents$AIXBT
#AIXBT is a leading AI Agent and its token is currently in a strong buying opportunity that could be very rewarding.
Breaking 0.092 and 0.066 are invalidation. While passing 0.133 firstly then passing 0.187 would be a significant bullish confirmation for these scenarios.
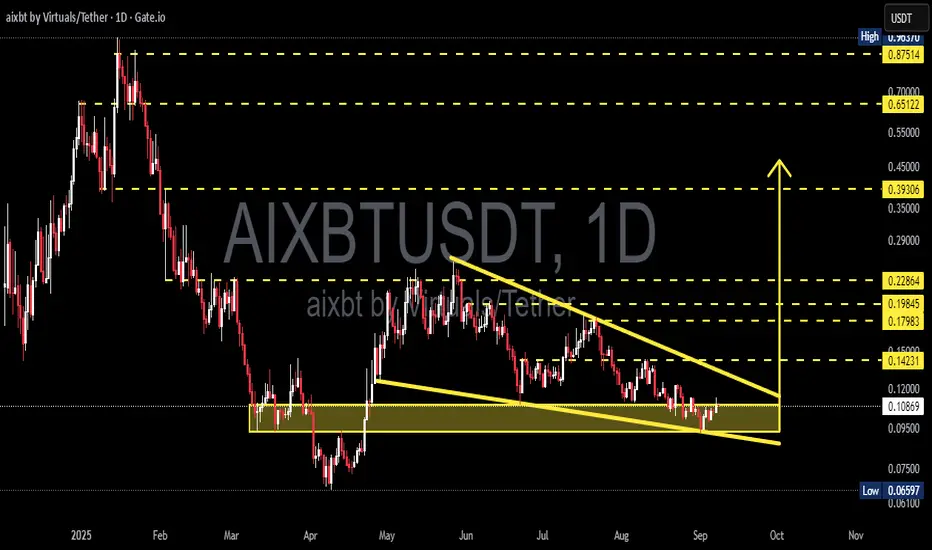
AIXBT/USDT — Decision Point! Falling Wedge in Accumulation ZoneThe price of AIXBT/USDT is currently trading inside a critical accumulation zone (0.085 – 0.110). Recent price action has formed a Falling Wedge, a pattern often seen as a bullish reversal signal. However, the structure also resembles a Descending Triangle, which could trigger a bearish continuation if the support breaks.
This means the market is at a major decision point.
---
🔎 Pattern & Key Levels
Demand Zone (Accumulation): 0.085 – 0.110 (current support).
Descending trendline resistance: ~0.12 → first breakout test.
Next resistance levels after breakout:
R1: 0.142
R2: 0.1798 – 0.1985
R3: 0.2286
Critical support: 0.085 → if broken, price could revisit the 0.0659 low.
The Falling Wedge suggests bullish reversal potential, while the Descending Triangle signals bearish continuation risk. Confirmation is key.
---
🚀 Bullish Scenario
Trigger: Daily close above the trendline (~0.12) with strong volume.
Targets:
Short-term: 0.142 → 0.1798
Mid-term: 0.1985 – 0.2286
Long-term: 0.393 – 0.65 if momentum expands.
Entry strategies:
Aggressive: accumulate at 0.10–0.11, stop below 0.085.
Conservative: wait for breakout >0.12–0.142, stop below 0.11.
---
⚠️ Bearish Scenario
Trigger: Daily close below 0.085 with strong selling volume.
Targets:
First: 0.0659 (previous low).
Extended: measured move could push to ~0.04.
Strategy: Cut losses if support fails. Avoid averaging down without valid reversal signals.
---
📌 Trading Plan Summary
AIXBT/USDT is at a critical crossroad.
Breakout above 0.12 → opens the path to 0.142 – 0.23.
Breakdown below 0.085 → brings risk of retesting 0.066 or lower.
This setup is high-risk, high-reward, so patience, confirmation, and strict risk management are essential.
---
#AIXBT #AIXBTUSDT #CryptoAnalysis #TechnicalAnalysis #PriceAction #FallingWedge #DescendingTriangle #Breakout #CryptoTrading #RiskManagement
$AIXBT Performing falling wedge pattern Trading strategy
Identify and Confirm: Look for the two converging, downward-sloping trendlines with at least two touches on each. Volume should ideally decrease as the pattern develops.
Wait for Breakout: A bullish signal occurs when the price breaks above the upper trendline.
Confirm Breakout: Confirm the breakout with an increase in trading volume.
Manage Risk: Set a stop-loss order below the lower trendline and a take-profit target by projecting the wedge's widest point upward from the breakout.
Reliability
The falling wedge is considered a reliable bullish pattern with a reported success rate of 74% in bull markets. Its reliability is strengthened by increasing volume upon breakout.

AIXBT/USDT — Final Battleground Before the Next Major Trend?📌 Overview
AIXBT is currently at a trend crossroads. After months of persistent selling pressure forming a medium-term downtrend channel and being capped by a descending trendline (yellow), the price finally broke above this dynamic resistance in early August.
However, it is now retesting the critical demand zone at 0.110–0.136, which acts as a battlefield between buyers and sellers. The winner here will likely dictate the next major move.
---
📊 Pattern & Market Structure
1. Medium-Term Downtrend
Price has been printing lower highs & lower lows since the previous peak.
The descending trendline acted as dynamic resistance until the early-August breakout.
2. Breakout + Retest
The breakout lacked strong momentum.
Price is now in a retest phase to test buyer strength within the demand zone.
3. Demand Zone 0.110–0.136
Previously acted as a support-resistance flip zone.
Was a key entry point for buyers during the April–May rally.
A decisive breakdown below this zone would invalidate the short-term bullish outlook.
4. Key Levels
Resistance 1: 0.1664 → first bullish confirmation trigger.
Resistance 2: 0.2255 → medium-term bullish target.
Extended resistances: 0.3942, 0.5982, 0.8763 for further upside.
Critical support: 0.110 → breakdown risks sharp drop to 0.095 / 0.075.
---
📈 Bullish Scenario
Condition: Price holds above 0.110 and breaks + closes daily above 0.1664 with strong volume.
Potential Targets:
1. Initial → 0.1664 (+22.8%)
2. Medium-term → 0.2255 (+66.4%)
3. Extended → 0.3942 (+190.9%) if broader market sentiment turns risk-on.
Extra confirmation: A clear higher low above demand zone + rising buy volume.
---
📉 Bearish Scenario
Condition: Daily close below 0.110 with high sell volume.
Potential Targets:
1. Initial → 0.095 (−29.9%)
2. Medium-term → 0.075 (−44.6%)
3. Extreme → 0.059 (−56.5%) in a capitulation sell-off.
Extra risk: A breakdown here could trigger a stop-loss cascade from traders who accumulated in this zone.
---
🎯 Trading Strategy & Risk Management
Conservative traders: Wait for a confirmed breakout above 0.1664 before entering; stop-loss below 0.110.
Aggressive traders: Consider small entries within the demand zone with tight SL (<0.105) and scale out at resistance levels.
Always apply strict risk management — risk only 1–2% per trade and scale profits at key levels.
---
⏳ Conclusion
The 0.110–0.136 zone is the final battlefield for buyers to keep the short-term bullish scenario alive. A buyer victory could trigger a significant rally, while a seller victory could extend the bearish trend toward deeper supports.
📅 This week’s price action will be crucial — have your plan ready before the market makes its move.
#AIXBT #CryptoAnalysis #Altcoin #SupportResistance #TrendlineBreakout #BullishScenario #BearishScenario #CryptoTrading #TechnicalAnalysis #BreakoutOrBreakdown

AIXBT Swing Trade Buy / Long SetupMarket is taking some good correction, Also It has cleared almost all liquidity below side, Now It can move towards upside. Must wait for the entry. It's a swing trade so it can take time on entry and tp. Best Of Luck.

$AIXBT Breaks Trendline – Sharp Move Ahead?$AIXBT just broke out of its downtrend and flipped resistance into support, classic breakout behavior.
It’s now pushing toward a key resistance zone, and if it clears that level, we could see a sharp move up.
Momentum is shifting, this chart deserves your attention.
DYOR, NFA
AIXBT – Ready to Break Out?
This is AIXBT on the daily chart.
Price is now testing a confluence of resistance: the 50MA and the 0.5 Fib level — both aligned in the same zone.
Both systems are in long mode:
* PSAR is bullish
* MLR > SMA > BB Center
The RSI just broke out of a month-long bullish divergence, signalling fresh momentum.
Why AIXBT could outperform after the GENIUS / CLARITY / Anti-CBDC acts:
1. AI x BTC is the hottest meta — and AIXBT is riding both waves.
2. Not a CBDC, not a stablecoin — less regulatory friction.
3. Low cap + trending narrative = upside volatility.
Conclusion:
If the systems are long, I listen. AIXBT is aligned both technically and fundamentally.
I’m long: not financial advice.
Always take profits and manage risk.
Interaction is welcome.

#AIXBTUSDT #4h (ByBit) Descending trendline breakout$AIXBT just regained 100EMA support and looks ready for short-term recovery.
BYBIT:AIXBTUSDT.P aixbt.tech

AIXBT/USDT – Symmetrical Triangle Squeeze! A Major Move is Brewi🔍 Market Structure Overview
AIXBT/USDT is currently forming a well-defined Symmetrical Triangle pattern on the 1D timeframe, signaling a tightening consolidation between lower highs and higher lows.
Price is consolidating just above a strong demand zone between $0.1200–$0.1350, suggesting accumulation by smart money. This triangle formation represents a classic volatility squeeze, where price coils before a significant breakout or breakdown.
These setups are often the calm before the storm—and they typically lead to explosive moves once price escapes the pattern.
✅ Bullish Scenario (Breakout Upwards)
If price breaks above the descending trendline and clears the $0.1664 horizontal resistance level, it could ignite a powerful bullish run toward the following targets:
1. 🎯 Target 1: $0.2255 – Previous swing high & structural resistance.
2. 🎯 Target 2: $0.3942 – Strong horizontal resistance from historical price action.
3. 🎯 Target 3: $0.5982 – Mid-term Fibonacci/volume confluence level.
4. 🚀 Ultimate Target: $0.8763 – Psychological level and former macro resistance.
> Breakout Confirmation: Look for a daily candle close above the triangle with a surge in volume for confirmation.
❌ Bearish Scenario (Breakdown)
If bulls fail to break out and the price breaks down below the triangle and loses the $0.1200–$0.1349 support zone, the following downside targets come into play:
1. ⚠️ Support 1: $0.0950 – Previous local low.
2. ⚠️ Support 2: $0.0750 – A historical accumulation zone.
3. ⚠️ Support 3: $0.0590 – Major demand floor and last line of defense.
This would invalidate the current bullish structure and signal a potential mid-term trend reversal.
📐 Pattern Highlight: Symmetrical Triangle
Nature: Neutral continuation/reversal pattern, depending on breakout direction.
Volume Behavior: Typically contracts as price nears the apex, then expands post-breakout.
Strategy: Smart entries usually occur on breakout + retest with volume confirmation.
🧠 Final Thoughts
AIXBT/USDT is reaching a critical inflection point. The symmetrical triangle formation is nearing its apex, suggesting that a large move is imminent. Whether the breakout will be bullish or bearish depends on how price behaves at the key boundaries outlined.
📢 Pro Tip: Watch for breakout direction, volume spikes, and possible retests to position accordingly. Don’t forget to set stop-losses in either scenario to manage risk effectively.
#AIXBT #CryptoBreakout #SymmetricalTriangle #TechnicalAnalysis #AltcoinSetup #ChartPatterns #VolumeAnalysis #SupportAndResistance #CryptoTrading #CryptoTA

$AIXBT - Scalp Long IdeaBINANCE:AIXBTUSDT | 4h
Valid retest of previous LTF swing point. Potential trendline break out
Ltf demand: .13 to .125
Stoploss: just below .118
TPs:
.142 to .149
.158 to .165
.176 to .182

AIXBT: Motive Rise#AIXBT has been leading the AI-Agent sector with a strong bullish wave since early April. The recent rise confirms its continued momentum.
As long as it holds above the April low, it’s very likely to target a new ATH in the ongoing AI-Agents hype.

$AIXBT macro analysis [ ai coin having huge potential ] Hi it's me ur Raj_crypt0
Here is my view on BINANCE:AIXBTUSDT an #ai sector coin .DYOR / NFA
This is low cap high risky coin u may lose 100% before investment check ur self
Entry - $0.25 below
targets ....
¹$0.55
²$1.5
³$3.5
Note - $0.1 below stop buying ( I will update where to avg or wt to do )
If , u are risky taker $1.5 ( get ur liquid there + 1x profit )

Alikze »» AIXBT | Formation of the valley pattern - 4H🔍 Technical analysis: Formation of the valley pattern - 4H
📣 BINANCE:AIXBTUSDT currency is moving in an ascending channel on the 4-hour time frame, which is currently in the supply zone and the middle of the ascending channel.
🟢From a classical perspective, a valley has formed that can break the current supply zone in the green box area by removing liquidity under the previous leg and grow to the next supply zone.
💎 Second scenario: The current supply zone break, depending on the number and frequency of hits to the supply level, can break it and continue its growth to the next supply zone, which is also the ceiling of the ascending channel, and then encounter a correction that, after a pullback to the previous supply zone, continues its path to the next target.
»»»«««»»»«««»»»«««
Please support this idea 💡 with a LIKE 👍 and COMMENT 💬 if you find it useful and Click "Follow" on our profile if you'd like these trade ideas delivered straight to your email 📧 in the future.
Thanks for your continued support.🙏
Best Regards,❤️
Alikze.
»»»«««»»»«««»»»«««

$AIXBT - Long Trade Idea$AIXBT | 12h
Price is holding above the previous resistance at 0.13
If it establishes support here, I expect a retest of the 0.25–0.40 zone
Buying zone: .17 to .13
Stop: just below .09
Targets:
.20-.27
.34-.42
.48-.57

AIXBT/USDT 1H: Markup Phase – Long Setup Above $0.1540AIXBT/USDT 1H: Markup Phase – Long Setup Above $0.1540
🚀 Follow me on TradingView if you respect our charts! 📈 Daily updates!
Current Market Conditions (Confidence Level: 8/10):
Price at $0.1553, showing strong bullish structure after breaking above Fair Value Gap (FVG).
Hidden bullish divergence spotted on RSI, reinforcing bullish continuation potential.
Market Makers completed accumulation phase between $0.0750 – $0.0800, entering markup
phase.
Trade Setup (Long Bias):
Entry: $0.1540 – $0.1555 zone.
Targets:
T1: $0.1650
T2: $0.1700
Stop Loss: $0.1480 (below recent swing low).
Risk Score:
7/10 – Strong breakout supports the setup, though minor pullbacks into FVG retest remain possible.
Key Observations:
Strong support around $0.1300 (equilibrium zone).
Volume profile confirms breakout strength and new bullish order flow.
Break of structure aligns with Smart Money Concepts for continued upward movement.
Price action suggests potential for rapid expansion during markup phase.
Recommendation:
Long positions favored within entry range with tight risk management.
Consider securing partial profits at $0.1650 and trailing stop for potential extension towards $0.1700.
Monitor price action on any pullback into the FVG zone for additional entries.
🚀 Follow me on TradingView if you respect our charts! 📈 Daily updates!

AIXBT: THE PERFECT BULLISH REVERSAL SETUP🔄🚀 for more details FOLLOW ME AND READ BELOW 🚀
📈 Hidden Gem About to Explode
The AIXBT/USDT 1-hour chart reveals a perfectly formed trading range between $0.0780 and $0.0870 - and it's primed for a powerful breakout. After establishing solid support at $0.0780, we're now witnessing early signs of accumulation before what appears to be an imminent bullish reversal.
🎯 Projected Path to $0.1030
The blue projection line shows a clear pathway with three distinctive moves:
1. Initial breakout above $0.0870 resistance
2. Brief pullback to retest support (ideal entry for those who miss the first move)
3. Powerful continuation toward the $0.1030 target (25% gain from current price!)
⚡ Key Technical Triggers
* Price is currently holding above the critical $0.0820 level
* The downtrend line (blue diagonal) is about to be tested
* Volume has been decreasing during consolidation - classic pre-breakout behavior
* Current price ($0.0827) sits at the perfect entry zone before the anticipated move
💎 Why This Setup Is Special
This isn't just any range-bound pattern - it's a textbook accumulation zone following a sharp decline. The steady base-building since April 4th suggests smart money is quietly positioning before the next leg up. The precise horizontal boundaries make this one of the cleanest setups in the market right now.
⏱️ Timing Is Everything
With the hourly chart showing clear consolidation and the projected breakout occurring within the next 48-72 hours, this opportunity presents an ideal risk-reward scenario. The narrow range between current price and invalidation level ($0.0780) means tight stop-losses with massive upside potential.
🧠 Strategic Approach
- Entry : $0.0820-$0.0835 (current zone)
- Stop Loss : $0.0775 (below range support)
- First Target : $0.0900 (psychological level)
- Ultimate Target : $0.1030 (technical projection)
📊 Risk-Reward Analysis
With a potential 25% gain and just 6% risk, this setup offers an exceptional 4:1 risk-reward ratio - the kind of opportunity professional traders wait patiently to find.
