BE by requestI made a key code of the price action then found an exact match to this move in the past.... one that matched at lease 95% or better. That way if the move is that close to the same shape we have now it must mean the sentiment of the market was the same at that time. Therefore, the outcome should be the same coming out of the move. I then used PTP which is Past Trend Prediction by tracing the trend it made after this move in the past and projecting it forward on to the current move.
Then I took the same move on the Daily which is a different Time frame then the first..and found the same move with out a key and traced its path and projected it forward as well.
Sometimes I use about 5 other Price Action tricks I have have developed over the last 10 months or chart out the Curve and what Stage it is in. The Curve is my own brain child and I compare that to Wycoff method. Taking all of these into account You have several different approaches to confirming direction and intent of the institutional buyers and where Retail resides during this move.
If you would like to have more information or videos on Any of the ways I chart pls comment below. Like, follow, Subscribe...share.
Thank you,
iCantw84it
06.08.2021
Algokeycode

FCX by requestI made a key code of the price action then found an exact match to this move in the past.... one that matched at lease 95% or better. That way if the move is that close to the same shape we have now it must mean the sentiment of the market was the same at that time. Therefore, the outcome should be the same coming out of the move. I then used PTP which is Past Trend Prediction by tracing the trend it made after this move in the past and projecting it forward on to the current move.
Then I took the same move on the Daily which is a different Time frame then the first..and found the same move with out a key and traced its path and projected it forward as well.
Sometimes I use about 5 other Price Action tricks I have have developed over the last 10 months or chart out the Curve and what Stage it is in. The Curve is my own brain child and I compare that to Wycoff method. Taking all of these into account You have several different approaches to confirming direction and intent of the institutional buyers and where Retail resides during this move.
If you would like to have more information or videos on Any of the ways I chart pls comment below. Like, follow, Subscribe...share.
Thank you,
iCantw84it
06.08.2021

RIDE concerns with News, month old chart still accounts for it!Made this chart 05.19.2021 Almost a month ago.... and then added some new stuff to it about a week ago. I find it interesting that it accounts for the current news and shows where price action will drop to. Will it continue to stay true to this trend that is Drawn? Whats the likelihood of this getting bought out by a bigger company? If you know or have a view on this please put them in the comments below. Thank you.
by iCantw84it
06.08.2021

ORMP by request KeyCode 2 Possible PathsI made a key code of the price action then found an exact match to this move in the past.... one that matched at lease 95% or better. That way if the move is that close to the same shape we have now it must mean the sentiment of the market was the same at that time. Therefore, the outcome should be the same coming out of the move. I then used PTP which is Past Trend Prediction by tracing the trend it made after this move in the past and projecting it forward on to the current move.
Then I took the same move on the Daily which is a different Time frame then the first..and found the same move with out a key and traced its path and projected it forward as well.
Sometimes I use about 5 other Price Action tricks I have have developed over the last 10 months or chart out the Curve and what Stage it is in. The Curve is my own brain child and I compare that to Wycoff method. Taking all of these into account You have several different approaches to confirming direction and intent of the institutional buyers and where Retail resides during this move.
If you would like to have more information or videos on Any of the ways I chart pls comment below. Like, follow, Subscribe...share.
Thank you,
iCantw84it
06.08.2021

The Curve -watch as Price bounces to set up for a bullish moveThe Curve is a visual representation of Wyckoff method although not designed with Wyckoff in mind it was made over a 9 month period of watching the market and making a ruleset that supports everything I saw in the market. There are 5 stages. Each stage bounces from Bollinger band top to bottom. Except stage 4 which is a continuation of 3 at the midpoint of a curve....usually in Re-accumulation. Price action will hug the upper bb a few candles before dropping to hit the bottom Bollinger Band for stage 5, also called The Spring/Launch. This then goes for a New high if retail is cooperating. it is also the lowest volume part of the curve. In this chart you can see institutional buying setting up to make a very bullish run as it fullfills each stage in just about 5 candles. Why else would it do this if not to full fill each stage and be on stage 5 going to stage 1 for the new high. Of course each stage breaks down into something else in wyckoff method. Which is usually:
1. Buyers Climax
2. Major sign of weakness
3/4. Into Up Thrust After Distribution
5. to Spring or final dip into liquidity
Finally back into
1. Which is the free ride up to create a new higher high.
All my ideas have the Curve represented or are part of the the analysis regardless if stated or not. It is the fundamental basis of how I trade.
As I never looked at any other teachings until 2 months ago when I found wyckoff as I was curious as to what the logical explanation of what I saw was.
Thank you.
if you like ideas like this or want to see more of these please comment below, like, subscribe, and share. As its the only way I can tell if you are actually into this or not.
by iCantw84it
06.08.2021

UAVS looking Saucy....I made a key code of the price action then found an exact match to this move in the past.... one that matched at lease 95% or better. That way if the move is that close to the same shape we have now it must mean the sentiment of the market was the same at that time. Therefore, the outcome should be the same coming out of the move. I then used PTP which is Past Trend Prediction by tracing the trend it made after this move in the past and projecting it forward on to the current move.
Then I took the same move on the Daily which is a different Time frame then the first..and found the same move with out a key and traced its path and projected it forward as well.
Sometimes I use about 5 other Price Action tricks I have have developed over the last 10 months or chart out the Curve and what Stage it is in. The Curve is my own brain child and I compare that to Wycoff method. Taking all of these into account You have several different approaches to confirming direction and intent of the institutional buyers and where Retail resides during this move.
If you would like to have more information or videos on Any of the ways I chart pls comment below. Like, follow, Subscribe...share.
Thank you,
iCantw84it
06.07.2021

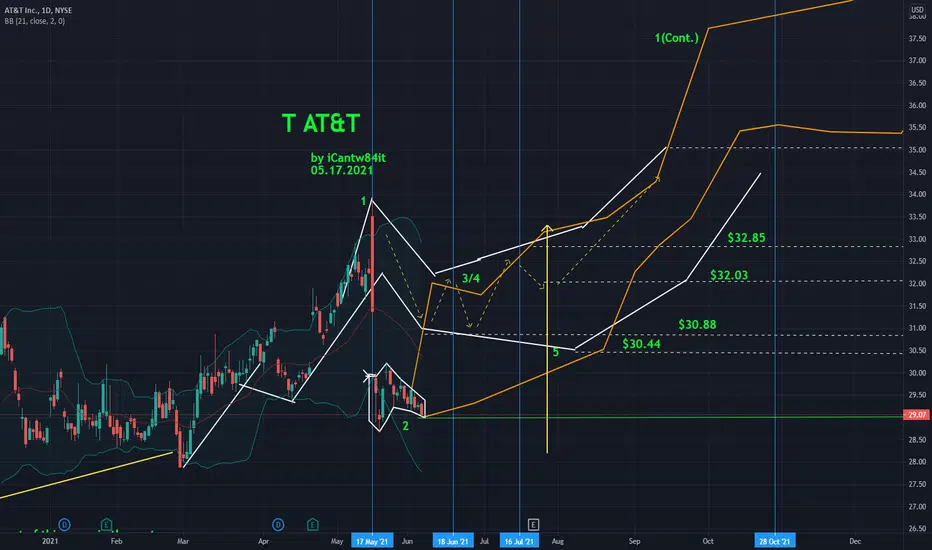
T AT&T I wasnt interested in, until it did this...I wanted to put a chart that you could track this with to go with the video.. SO here it is.
I made a key code of the price action then found an exact match to this move in the past.... one that matched at lease 95% or better. That way if the move is that close to the same shape we have now it must mean the sentiment of the market was the same at that time. Therefore, the outcome should be the same coming out of the move. I then used PTP which is Past Trend Prediction by tracing the trend it made after this move in the past and projecting it forward on to the current move.
Then I took the same move on the Daily which is a different Time frame then the first..and found the same move with out a key and traced its path and projected it forward as well.
Sometimes I use about 5 other Price Action tricks I have have developed over the last 10 months or chart out the Curve and what Stage it is in. The Curve is my own brain child and I compare that to Wycoff method. Taking all of these into account You have several different approaches to confirming direction and intent of the institutional buyers and where Retail resides during this move.
If you would like to have more information or videos on Any of the ways I chart pls comment below. Like, follow, Subscribe...share.
Thank you,
iCantw84it
06.07.2021
T AT&T I wasn't interested in...until it did this!I made a key code of the price action then found an exact match to this move in the past.... one that matched at lease 95% or better. That way if the move is that close to the same shape we have now it must mean the sentiment of the market was the same at that time. Therefore, the outcome should be the same coming out of the move. I then used PTP which is Past Trend Prediction by tracing the trend it made after this move in the past and projecting it forward on to the current move.
Then I took the same move on the Daily which is a different Time frame then the first..and found the same move with out a key and traced its path and projected it forward as well.
Sometimes I use about 5 other Price Action tricks I have have developed over the last 10 months or chart out the Curve and what Stage it is in. The Curve is my own brain child and I compare that to Wycoff method. Taking all of these into account You have several different approaches to confirming direction and intent of the institutional buyers and where Retail resides during this move.
If you would like to have more information or videos on Any of the ways I chart pls comment below. Like, follow, Subscribe...share.
Thank you,
iCantw84it
06.07.2021
