#ALGO/USDT - this will go Short#ALGO
The price is moving in a descending channel on the 1-hour timeframe. It has reached the upper limit and is heading towards breaking downwards, with a retest of the upper limit expected.
We have an upward trend on the RSI indicator, which has reached near the upper limit, and a downward reversal is expected.
There is a major resistance zone in green at 0.1440. The price has bounced from this zone multiple times and is expected to bounce again.
We have a trend of consolidation above the 100-period moving average, as we are moving close to it, which supports a downward move towards touching it.
Entry price: 0.1343
First target: 0.1316
Second target: 0.1287
Third target: 0.1250
Stop loss: Above the resistance zone in green.
Don't forget a simple thing: money management.
For inquiries, please leave a comment.
Thank you.
Algousd

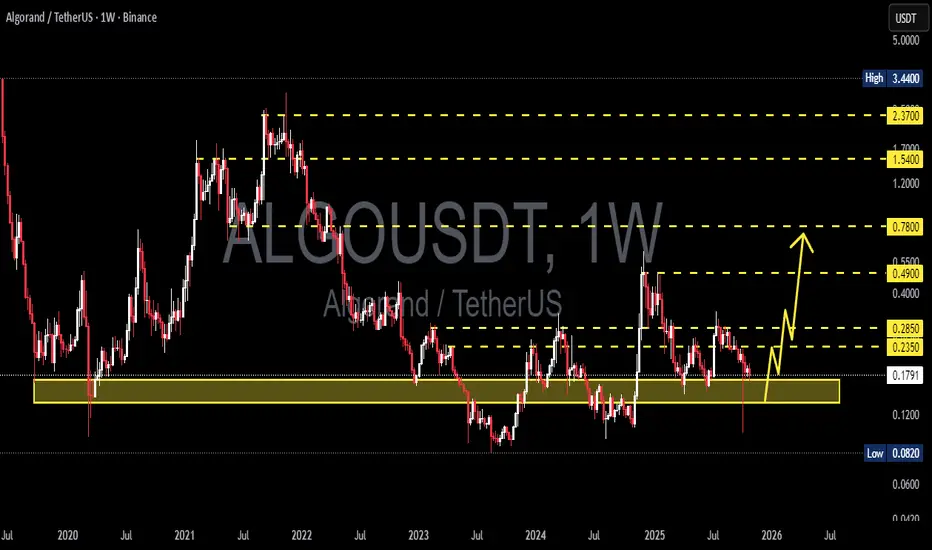
ALGO/USDT - Price at Major Demand Zone, Reversal or Breakdown?On the weekly timeframe, ALGO/USDT continues to trade within a long-term bearish market structure, defined by a sequence of lower highs and lower lows. Price is currently declining toward a key historical demand zone, highlighted by the yellow box between 0.1075 and 0.0850.
This area has historically served as a strong accumulation zone, where selling pressure was absorbed and followed by notable price reversals.
---
Pattern & Market Structure
From a technical perspective, ALGO shows:
A well-defined descending trend structure
Multiple failed attempts to reclaim major resistance levels:
0.50
0.285
0.235
0.160
Recent price action indicates bearish momentum is slowing as price compresses into a high-probability demand area
This setup often reflects a late-stage downtrend, where accumulation may begin.
---
Key Levels
Major Support (Demand Zone):
0.1075 – 0.0850 → Weekly demand & accumulation zone
Resistance Levels:
0.1600 → First key resistance
0.2350 → Structural resistance
0.2850 → Mid-range resistance
0.4000 – 0.5000 → Major resistance and trend reversal confirmation zone
---
Bullish Scenario
The bullish case remains valid if price respects and holds the demand zone:
1. Strong weekly rejection candles or long lower wicks from the zone
2. Formation of higher lows on lower timeframes
3. A confirmed weekly close above 0.1600
If confirmed, upside potential includes:
0.235 as the first target
0.285 as the second target
0.40 – 0.50 as an extended bullish target
This would signal the early phase of accumulation and a potential trend reversal.
---
Bearish Scenario
The bearish continuation scenario becomes dominant if:
1. Price breaks and closes below 0.0850 on a weekly basis
2. The demand zone fails to absorb selling pressure
3. No meaningful bullish reaction occurs
In this case:
The long-term downtrend remains intact
Price may seek lower liquidity zones around 0.070 – 0.060
The historical accumulation zone becomes invalidated
---
Conclusion
ALGO is currently trading at a critical long-term decision level.
The 0.1075 – 0.0850 zone represents a major inflection point:
Holding above it → accumulation and reversal potential
Breaking below it → continuation of the macro bearish trend
Patience and confirmation are essential at this stage.
---
#ALGOUSDT #Algorand #CryptoAnalysis #WeeklyChart
#DemandZone #AccumulationZone #PriceAction
#MarketStructure #AltcoinAnalysis

#ALGO/USDT - this will go up#ALGO
The price is moving in a descending channel on the 1-hour timeframe. It has reached the lower boundary and is heading towards breaking above it, with a retest of the upper boundary expected.
We have a downtrend on the RSI indicator, which has reached near the lower boundary, and an upward rebound is expected.
There is a key support zone in green at 0.1125. The price has bounced from this zone multiple times and is expected to bounce again.
We have a trend towards consolidation above the 100-period moving average, as we are moving close to it, which supports the upward movement.
Entry price: 0.1137
First target: 0.1150
Second target: 0.1172
Third target: 0.1197
Stop loss: Below the support zone in green.
Don't forget a simple thing: capital management.
For inquiries, please leave a comment.
Thank you.

#ALGO/USDT - this will go up
#ALGO
The price is moving in a descending channel on the 1-hour timeframe. It has reached the lower boundary and is heading towards breaking above it, with a retest of the upper boundary expected.
We have a downtrend on the RSI indicator, which has reached near the lower boundary, and an upward rebound is expected.
There is a key support zone in green at 0.1340. The price has bounced from this zone multiple times and is expected to bounce again.
We have a trend towards consolidation above the 100-period moving average, as we are moving close to it, which supports the upward movement.
Entry price: 0.1360
First target: 0.1374
Second target: 0.1394
Third target: 0.1417
Don't forget a simple principle: money management.
Place your stop-loss order below the support zone in green.
For any questions, please leave a comment.
Thank you.

Algorand ALGO USDT Upcoming TAKE PROFIT POINTSHi Traders, Investors and Speculators of Charts📈📉
New Year 2026 loading....🥂🥳
Algorand is a decentralized network built to solve the Blockchain Trilemma of achieving speed, security, and decentralization simultaneously.
Algorand is designed to be a payments-focused network with rapid transactions and a strong focus on achieving near-instant finality which aims to be processing over 1,000 transactions per second (TPS) and achieving transaction finality in less than five seconds.
As a public smart contract blockchain that relies on staking, Algorand is also capable of hosting decentralized application (dApp) development and providing scalability. Rising gas fees on Ethereum have led many dApp developers and decentralized finance (DeFi) traders to look for alternative blockchain solutions. Algorand is capable of managing the high-throughput requirements of widespread global usage and a variety of use cases.
Technical Chart Analysis:
Algorand is still "in prison", but holding the 50d Moving Averages is the first step towards a new bullish cycle. Look at all of this upside potential!
Technical indicator Analysis:
If ALGO can get back ABOVE the 50d moving averages (0,18), that is when we can expect to see some serious bullish/parabolic price action.
You don't have to wait until then to trade algo. In the daily timeframe, there are some great setups for those who have a bit of patience, with low buy and high sells from 15% - 30% over a few weeks (in both shorts and longs).
Tis market is still moving, even though it doesn't neccesarily seem like it from a macro outlook.

ALGO BUllish Pennantwe've got ALGO inside a pennant formation and let me tell you, it's getting charged up for another leg up. ALGO just recently retested and broke through its trendline resistance, which was previously acting as support before the breakdown. Now, it's making a strong push to break through this bullish pennant, but you need to be careful with your trades, my friends. This is not the time to get reckless with your investments.
And here's the thing, we can't forget about BTC. It's the elephant in the room, and it's the weekend, so you need to keep a close eye on it as well. You know how volatile the crypto market can be, and we can't afford to let our guard down. So, stay sharp, stay vigilant, and make your moves strategically. The name of the game is risk management, and if you do it right, you'll come out on top.

#ALGO/USDT - this will go up#ALGO
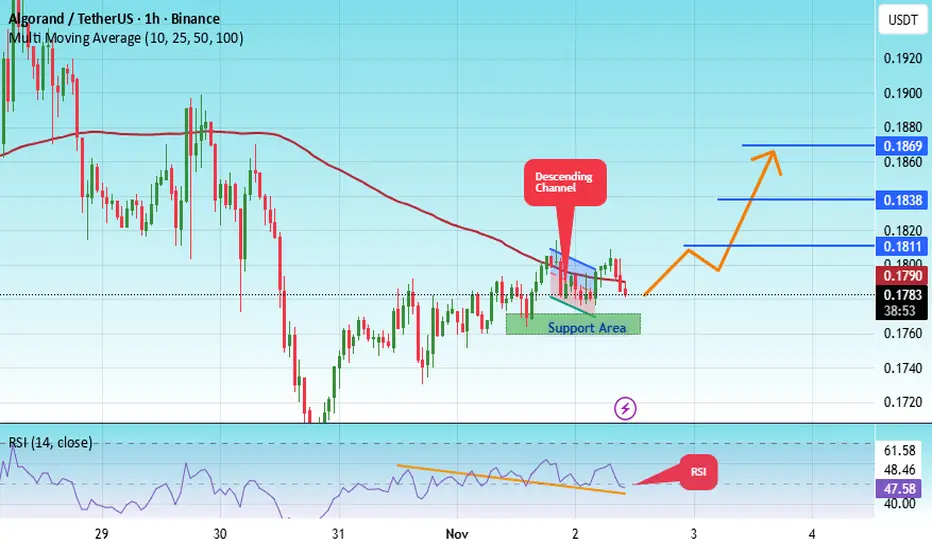
The price is moving within an ascending channel on the 1-hour timeframe and is adhering to it well. It is poised to break out strongly and retest the channel.
We have a downtrend line on the RSI indicator that is about to break and retest, which supports the upward move.
There is a key support zone in green at 0.1764, representing a strong support point.
We have a trend of consolidation above the 100-period moving average.
Entry price: 0.1784
First target: 0.1811
Second target: 0.1840
Third target: 0.1870
Don't forget a simple money management rule:
Place your stop-loss order below the green support zone.
Once you reach the first target, save some money and then change your stop-loss order to an entry order.
For any questions, please leave a comment.
Thank you.
ALGO/USDT –Between Capitulation or Massive Reversal Zone?ALGO is now trading at one of the most decisive zones in recent years, a major historical support area between 0.17–0.135 — a battle zone between buyers and sellers since 2020.
Each time the price tapped this area, the market reacted with a strong reversal, signaling heavy accumulation by smart money. However, this time, selling pressure appears stronger, creating tension between a potential massive reversal or a final breakdown before a new redistribution phase.
The weekly structure continues to print consistent lower highs since 2021, confirming that the macro trend remains bearish. Yet, the recent price rejection around 0.135–0.17 and the presence of a liquidity sweep below that zone suggest that many retail stop-losses have been taken — possibly setting the stage for a mean reversion rally.
---
🟢 Bullish Scenario: “The Bottom Reclaim”
Confirmation only occurs if weekly close > 0.235 with strong volume.
A breakout above this level would signal a structural reclaim and open the path for a rally toward 0.285 – 0.49 as the primary targets.
If momentum strengthens, further expansion toward 0.78 – 1.54 remains possible (the former 2021–2022 distribution area).
Aggressive traders may consider accumulation within 0.17–0.135, with a tight stop below 0.12, aiming for a minimum 1:3 risk-reward ratio.
💡 Additional bullish narrative:
If the crypto market rotates capital from major layer-1 assets into mid-cap plays, ALGO could become one of the “revival candidates,” backed by strong liquidity and a recognizable brand.
---
🔴 Bearish Scenario: “Break the Floor”
If weekly close < 0.135, it would confirm a breakdown of multi-year structural support.
The next logical downside target lies around 0.082, the historical low and the last visible demand zone before uncharted territory.
Such a breakdown usually triggers a capitulation event, where short-term volume spikes due to panic selling.
In an extreme case, ALGO could establish a new structural range below 0.10 before attempting a long recovery.
💡 Additional bearish narrative:
If macro pressure persists (e.g., BTC retraces or USDT dominance rises), ALGO might experience a “final flush” before forming a structural bottoming pattern.
---
📊 Key Structure & Technical Patterns
Primary pattern: Long-term Accumulation Range with repeated liquidity sweeps below support.
Macro trend: still bearish, though momentum is weakening — visible through declining volatility and volume contraction.
Potential reversal trigger: a strong bullish engulfing candle from within the yellow box.
Volume divergence: watch for rising volume around 0.15–0.17 — it often signals silent accumulation by smart money.
---
🧭 Conclusion
ALGO is standing at a critical multi-year decision zone — it could either mark the beginning of a multi-year reversal or the final breakdown toward new lows.
Traders should focus on weekly reactions around 0.17–0.135 and wait for confirmed weekly closes before taking positions.
There is no “best” position yet — only patience and discipline will define the outcome at such a pivotal stage.
---
#ALGO #ALGOUSDT #Algorand #CryptoAnalysis #PriceAction #MarketStructure #SwingTrading #TechnicalAnalysis #CryptoBreakout #TradingViewCommunity
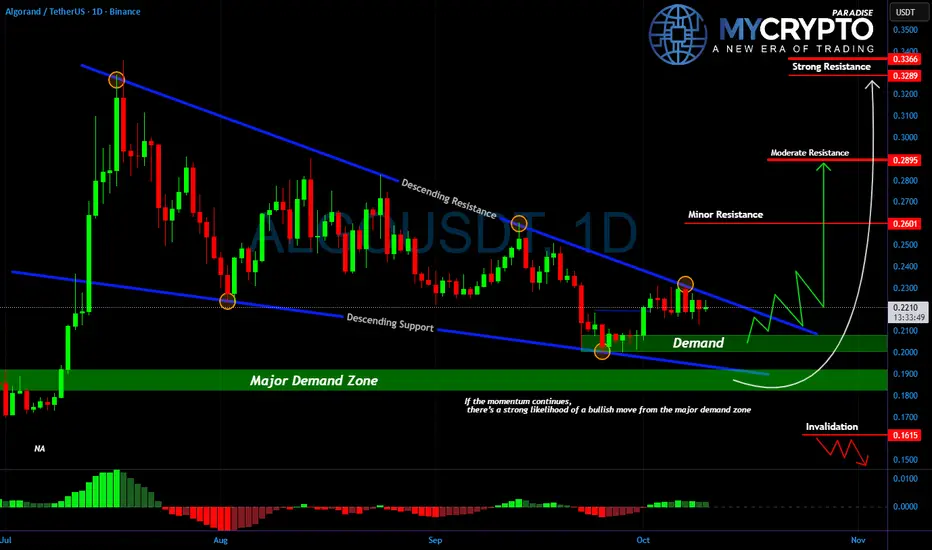
ALGO on the Edge: Will the Next Move Catch Everyone Off Guard?Yello Paradisers, are you prepared for what could be the breakout that surprises the entire market? While most traders are distracted, #ALGOUSDT is quietly compressing inside a clean descending wedge structure, and the pressure is reaching a critical point.
💎After weeks of bleeding, #ALGO has established a solid base within the major demand zone between $0.185 and $0.20. This area has held strong multiple times, showing clear signs of aggressive buying each time price touches down. It’s no coincidence this zone is being defended, and smart money knows it.
💎Price is now consolidating just below the descending resistance line, and every touch to the downside has become weaker, signaling a potential shift in market control. If momentum builds from here, a confirmed breakout above the $0.23 level could open the path toward higher targets. The $0.26 region will likely act as the first minor resistance, followed by stronger supply zones around $0.288 and $0.3289, where historical selling has previously stepped in.
💎However, as always, we must stay grounded in probabilities. Invalidation sits clearly below $0.1615. A break beneath that level would invalidate the bullish structure and shift the momentum back into the hands of the bears.
💎Until then, this remains a high-probability accumulation pattern. But remember, the market often fakes in one direction before delivering the real move. That means a final shakeout can’t be ruled out before the breakout. This is where emotional traders get liquidated and where the disciplined ones wait with confidence.
Strive for consistency, not quick profits. Treat the market as a businessman, not as a gambler. This is the only way you will make it far in your crypto trading journey. Be a PRO.
MyCryptoParadise
iFeel the success🌴
AlgorandAlgo usdt daily analysis
Time frame 4 hours
Risk rewards ratio >2.5 👈
Target = 0.33 $
I entered long position at the end of down trend
LS is so close and tight to decrease of damage

ALGO/USDT - Swing Setup | Low-Risk Long Targeting +273%🚀 Trade Setup Details:
🕯 #ALGO/USDT 🔼 Buy | Long 🔼
⌛️ TimeFrame: 1D
--------------------
🛡 Risk Management (Example):
🛡 Based on $10,000 Balance
🛡 Loss-Limit: 1% (Conservative)
🛡 The Signal Margin: $409.84
--------------------
☄️ En1: 0.2258 (Amount: $40.98)
☄️ En2: 0.2056 (Amount: $143.44)
☄️ En3: 0.1924 (Amount: $184.43)
☄️ En4: 0.1799 (Amount: $40.98)
--------------------
☄️ If All Entries Are Activated, Then:
☄️ Average.En: 0.1992 ($409.84)
--------------------
☑️ TP1: 0.2835 (+42.32%) (RR:1.73)
☑️ TP2: 0.336 (+68.67%) (RR:2.81)
☑️ TP3: 0.4171 (+109.39%) (RR:4.48)
☑️ TP4: 0.549 (+175.6%) (RR:7.2)
☑️ TP5: 0.7437 (+273.34%) (RR:11.2)
☑️ TP6: Open 🔝
--------------------
❌ SL: 0.1506 (-24.4%) (-$100)
--------------------
💯 Maximum.Lev: 2X
⌛️ Trading Type: Swing Trading
‼️ Signal Risk: 🙂 Low-Risk! 🙂
--------------------
🔗 www.tradingview.com
❤️ Your Like & Comments are valuable to us ❤️

Algo Bullish FlagAlgo formed a bullish wedge and it's about to break the trend line.
Wait for it to break the resistance and when it established above we can enter.
Stops at 0.22.

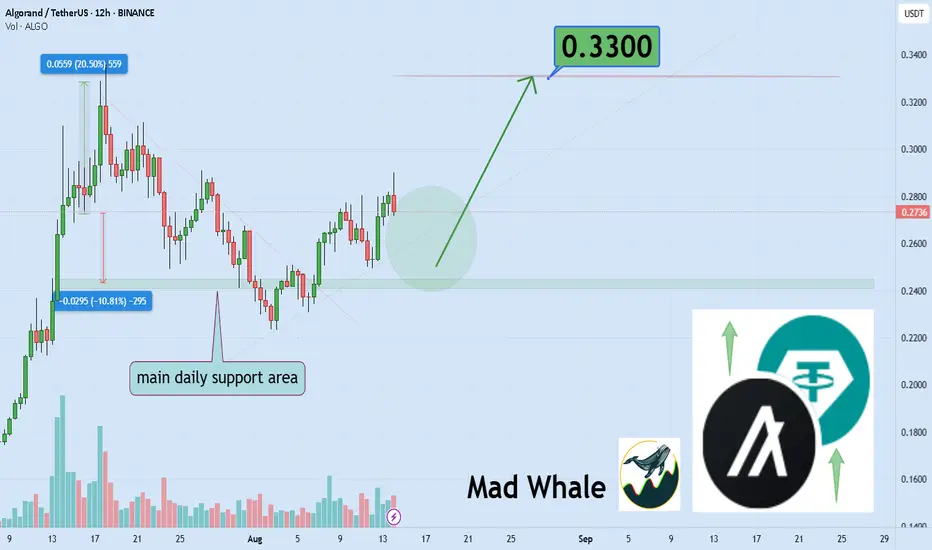
Algorand Trading Volume Signals Potential 20% Gain To 0.33Hello✌️
Let’s analyze Algorand’s price action both technically and fundamentally 📈.
🔍Fundamental analysis:
Algorand has updates coming new wallet, quantum-proof security, and enterprise tools.
Big moves like 100M USDC minted and partnerships with FIFA & TravelX show real-world use.
If the roadmap works out, demand might rise, but ALGO’s still far from its all-time high. 📈🚀
📊Technical analysis:
BINANCE:ALGOUSDT shows solid trading volume with a nearby daily support level. If this zone holds, a potential 20% upside could be expected, aiming for $0.33. Monitor the price closely and manage risk accordingly. 📈🛡️
✨We put love into every post!
Your support inspires us 💛 Drop a comment we’d love to hear from you! Thanks, Mad Whale
ALGO – Finally Getting the Retrace
Back at EURONEXT:ALGO —missed the lows, but finally seeing the retrace I’ve been waiting for.
Should’ve entered alongside CRYPTOCAP:HBAR , but this is the next best spot.
If this level doesn’t hold, we’re likely heading back below 20c, and many alts could retrace their entire impulse moves.
Starting to bid here—let’s see if it holds. BINANCE:ALGOUSDT
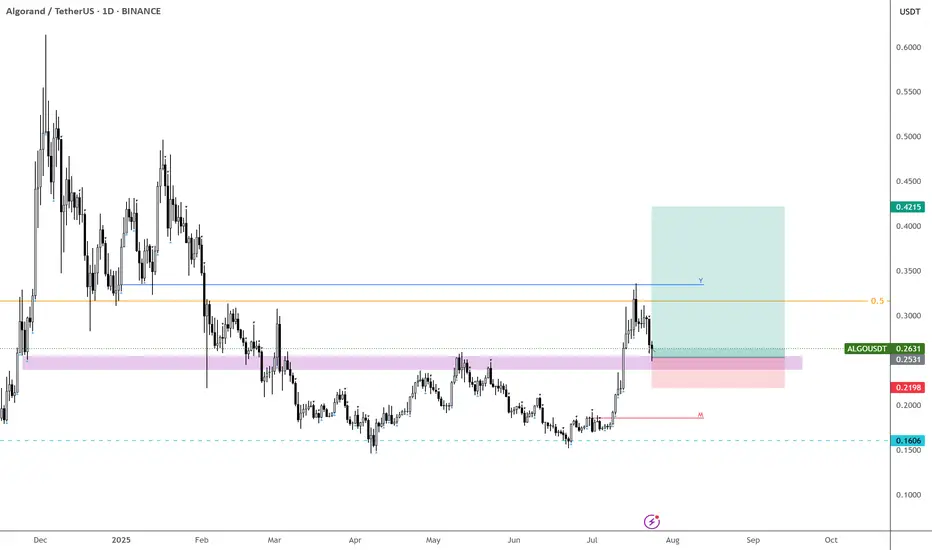
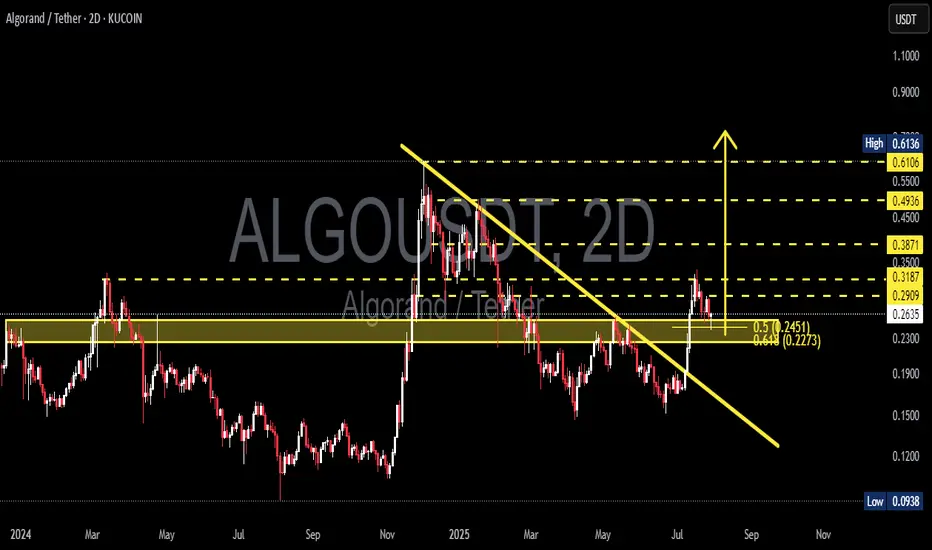
ALGOUSDT Break Downtrend – Reversal in Progress or Just a Retest📊 Technical Analysis Overview:
The Algorand (ALGO) / Tether (USDT) pair has shown a notable technical development by successfully breaking above a medium-term descending trendline that has acted as resistance since early 2025.
---
🔍 Pattern & Structure:
A clean breakout above the descending trendline (yellow sloped line) indicates a potential shift in trend from bearish to bullish.
Price is currently undergoing a retest of the breakout zone, aligning with the Fibonacci retracement levels 0.5 ($0.2451) and 0.618 ($0.2273).
The yellow horizontal zone ($0.25–$0.29) has been a significant support/resistance flip zone, showing strong historical reaction throughout 2024 and early 2025.
A higher high and higher low structure is starting to form — an early signal of a potential bullish reversal.
---
📈 Bullish Scenario:
If the price holds the support zone between $0.2451 and $0.2273, we could see a continuation of the upward move toward the following resistance levels:
$0.2909 (current minor resistance)
$0.3187
$0.3500
$0.3871
Mid-term targets: $0.4936 and $0.6106
A daily or 2D candle close above $0.3187 with strong volume would confirm a bullish continuation.
---
📉 Bearish Scenario:
On the other hand, failure to hold above the $0.2451–$0.2273 support zone could lead to a renewed bearish move with potential targets at:
$0.1900 (weekly historical support)
$0.1500
Extreme support: $0.0938 (2024 cycle low)
A break below $0.2273 would invalidate the breakout and may signal a bull trap.
---
📌 Summary:
ALGO is at a key inflection point. The current pullback could be a healthy correction after a breakout or a failed retest. Watch for price action and volume reaction near $0.2451–$0.2273 to confirm the next move.
#ALGO #Algorand #ALGOUSDT #CryptoAnalysis #TechnicalAnalysis #Breakout #BullishReversal #Fibonacci #SupportResistance #Altcoins #CryptoSetup #PriceAction
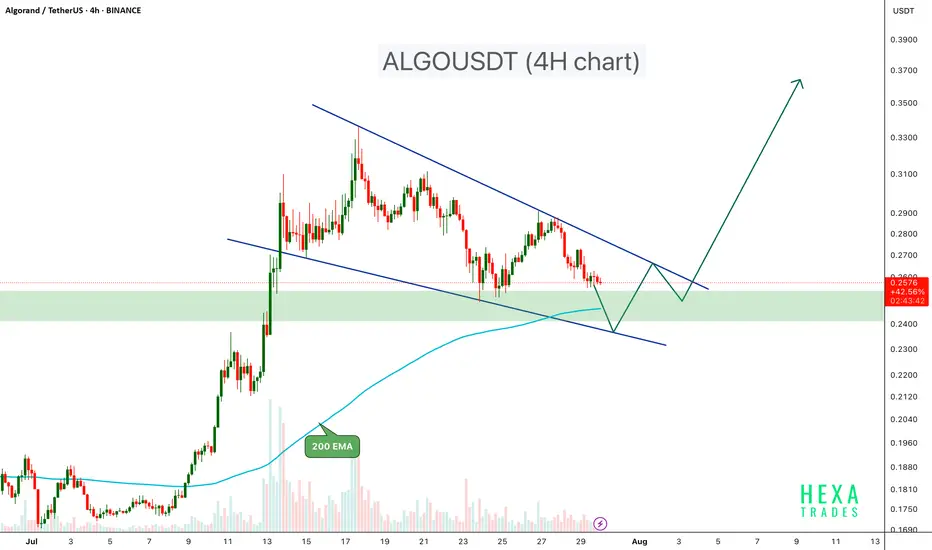
ALGOUSDT Forming Bullish Flag ALGOUSDT is currently trading inside a well-defined bullish Flag pattern on the 4-hour chart, a structure known for its bullish breakout potential. The price recently tested a significant demand zone, which previously acted as a base for a strong upward move earlier in July.
Key Points:
Bullish Flag Structure: Price is compressing within converging trendlines, forming lower highs and lower lows a classic bullish flag pattern.
Support Zone: The $0.24 – $0.255 area has acted as a strong demand zone, providing reliable support.
Bounce Potential: A bullish reaction from the lower flag boundary and demand zone could lead to a move toward the upper trendline and potentially trigger a breakout.
200 EMA Support: The 200 EMA is currently providing dynamic support, reinforcing the bullish setup.
Breakout Confirmation: A breakout above the flag resistance with strong volume could initiate a rally toward the $0.30 – $0.40 zone.
Cheers
Hexa
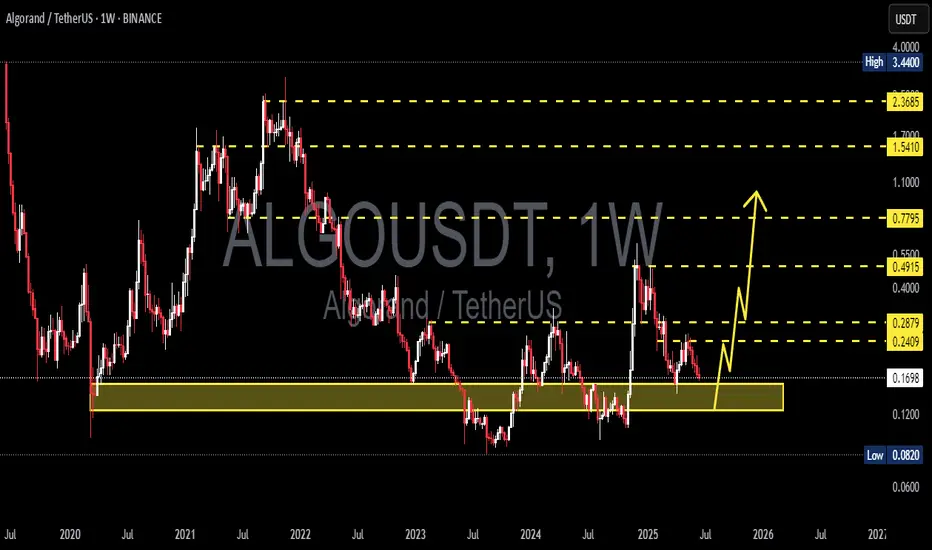
ALGOUSDT Approaching Breakout!BINANCE:ALGOUSDT is showing a potential trend reversal after bouncing from a strong historical demand zone around $0.15. Price action is testing the descending trendline for a breakout, which could trigger a bullish continuation move. Similar to the previous breakout in late 2024, this setup hints at a possible repeat rally. A weekly close above the trendline would confirm strength, opening targets at $0.32 and $0.70+.
COINBASE:ALGOUSD

Algorand breaking up from inverse head and shouldersSeems like most of the cryptos from the iso20022 compliant chains are breaking out right now and algorand is no exception. Most likely in anticipation of Fednow’s migration to it tomorrow. *not financial advice*

Algorand ALGO price analysis#Algo price is being held back from a deep dive, as far as it is appropriate to say that about altcoins right now.
The price decline on reduced volumes is similar to the previous two times on the OKX:ALGOUSDT chart.
🙂 A risky purchase from $0.15, if they hold the price there, it will be very cool.
📈 And if not, then “buckets” for buying in the $0.10-0.11 range, if you believe in the prospects of the #Algorand project
👊 And keep your fingers crossed, because there is a hypothetical chance that the price of #ALGO will rise to the $1.35-1.41 range by the end of this year, but everyone will have to be very lucky)
____________________
Did you like our analysis? Leave a comment, like, and follow to get more

ALGOUSDT 1W AnalysisALGO ~ 1W Analysis
#ALGO Buy back gradually from here with a short-term target of at least 20%++.
ALGOUSDT 1D AnalysisALGO ~ 1D Analysis
#ALGO Buy back gradually from here with a short term target of at least 15%+ from here.

ALGOUSDT making its way for journey towards 0.35$Here is the idea about ALGOUSDT.
The price is currently trading at daily support DS1.
The price was rejected from weekly resistance WR1 before coming back to daily support zone DS1.
I believe this daily support is very likely to provide support and make the price bounce from here.
The likely trajectory of the price is depicted in the chart.
The price is likely to aim for weekly resistance WR1 next on this bounce.
At WR1, the price is likely to face some pullback before ripping this resistance and target the next strong resistance which is quarterly resistance 3MR1.
Lets monitor this one as we go and adjust our expectations. But for now this is what I see as the likely path for ALGOUSDT.
Whats your thought?

How To Spot The Next Big Algorand Crypto Move!In the fast-paced world of crypto trading, many traders gravitate toward intraday and scalping strategies, chasing quick profits while often ignoring the powerful signals presented by higher timeframes. Yet, the smart money — institutional players, whales, and seasoned swing traders — operate differently. They focus on bigger timeframe supply and demand imbalances to enter high-probability trades with calculated risk and substantial reward potential. One such opportunity is currently setting up in Algorand ( BINANCE:ALGOUSDT ).
Why Higher Timeframes Matter in Crypto Trading
Most crypto traders operate on the 1-minute to 15-minute charts. While this can be effective, especially with crypto intraday strategies, it often leads to overtrading and emotional decision-making. In contrast, higher timeframes — such as the daily and weekly charts — provide clearer market structure, show major supply and demand imbalances, and are less noisy.
These timeframes reveal where whales and institutions place large orders, creating impulsive moves that leave behind clues for patient traders. Ignoring these clues is akin to trading blind.
The Weekly Demand Imbalance on BINANCE:ALGOUSDT
BINANCE:ALGOUSDT is currently showcasing a textbook example of a solid and strong weekly demand imbalance around the $0.1380 level. A few months ago, this zone sparked a massive bullish impulse — a series of consecutive large-bodied white candlesticks that broke through resistance with conviction.
Such moves don’t happen randomly. They’re often the result of institutional accumulation — smart money stepping in with size. These large players create imbalances where demand far outweighs supply, causing prices to rally aggressively. The key for retail traders is to identify the origin of these moves and wait patiently for the price to return.
