ALGO BULLISH SETUPALGO price tapped into bullish OB+FVG area and now we can see pump from here in this coin in coming days.
ALGOUSDTPERP

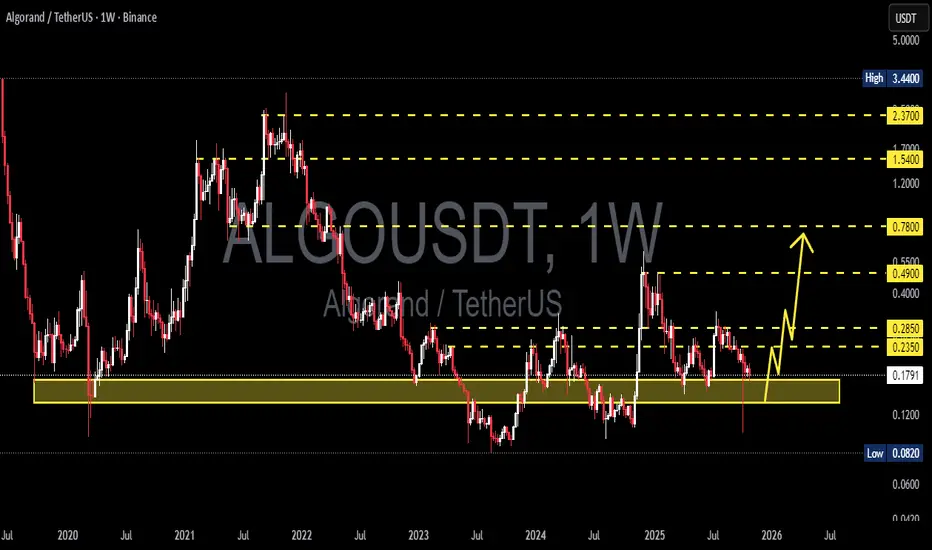
ALGO/USDT - Price at Major Demand Zone, Reversal or Breakdown?On the weekly timeframe, ALGO/USDT continues to trade within a long-term bearish market structure, defined by a sequence of lower highs and lower lows. Price is currently declining toward a key historical demand zone, highlighted by the yellow box between 0.1075 and 0.0850.
This area has historically served as a strong accumulation zone, where selling pressure was absorbed and followed by notable price reversals.
---
Pattern & Market Structure
From a technical perspective, ALGO shows:
A well-defined descending trend structure
Multiple failed attempts to reclaim major resistance levels:
0.50
0.285
0.235
0.160
Recent price action indicates bearish momentum is slowing as price compresses into a high-probability demand area
This setup often reflects a late-stage downtrend, where accumulation may begin.
---
Key Levels
Major Support (Demand Zone):
0.1075 – 0.0850 → Weekly demand & accumulation zone
Resistance Levels:
0.1600 → First key resistance
0.2350 → Structural resistance
0.2850 → Mid-range resistance
0.4000 – 0.5000 → Major resistance and trend reversal confirmation zone
---
Bullish Scenario
The bullish case remains valid if price respects and holds the demand zone:
1. Strong weekly rejection candles or long lower wicks from the zone
2. Formation of higher lows on lower timeframes
3. A confirmed weekly close above 0.1600
If confirmed, upside potential includes:
0.235 as the first target
0.285 as the second target
0.40 – 0.50 as an extended bullish target
This would signal the early phase of accumulation and a potential trend reversal.
---
Bearish Scenario
The bearish continuation scenario becomes dominant if:
1. Price breaks and closes below 0.0850 on a weekly basis
2. The demand zone fails to absorb selling pressure
3. No meaningful bullish reaction occurs
In this case:
The long-term downtrend remains intact
Price may seek lower liquidity zones around 0.070 – 0.060
The historical accumulation zone becomes invalidated
---
Conclusion
ALGO is currently trading at a critical long-term decision level.
The 0.1075 – 0.0850 zone represents a major inflection point:
Holding above it → accumulation and reversal potential
Breaking below it → continuation of the macro bearish trend
Patience and confirmation are essential at this stage.
---
#ALGOUSDT #Algorand #CryptoAnalysis #WeeklyChart
#DemandZone #AccumulationZone #PriceAction
#MarketStructure #AltcoinAnalysis

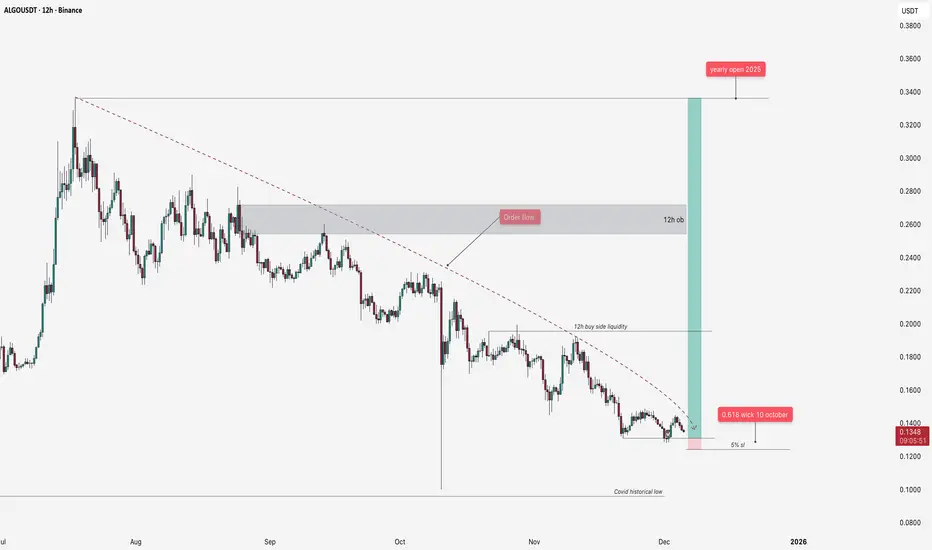
Algo trade idea for DecemberMain local trade idea for BINANCE:ALGOUSDT
Downtrend since July 2025 with sellers order flow - will be like a targets for hunt liquidity
After 10 October we formed correction 0.618 of wick D tf
Sl my personal is around 5% with 2x lev
Target Yearly open 2025
Also targets for step by step fixation Buy side liquidity (after this level sl to be)
12h order block and yearly open
#ALGO/USDT - this will go up
#ALGO
The price is moving in a descending channel on the 1-hour timeframe. It has reached the lower boundary and is heading towards breaking above it, with a retest of the upper boundary expected.
We have a downtrend on the RSI indicator, which has reached near the lower boundary, and an upward rebound is expected.
There is a key support zone in green at 0.1340. The price has bounced from this zone multiple times and is expected to bounce again.
We have a trend towards consolidation above the 100-period moving average, as we are moving close to it, which supports the upward movement.
Entry price: 0.1360
First target: 0.1374
Second target: 0.1394
Third target: 0.1417
Don't forget a simple principle: money management.
Place your stop-loss order below the support zone in green.
For any questions, please leave a comment.
Thank you.

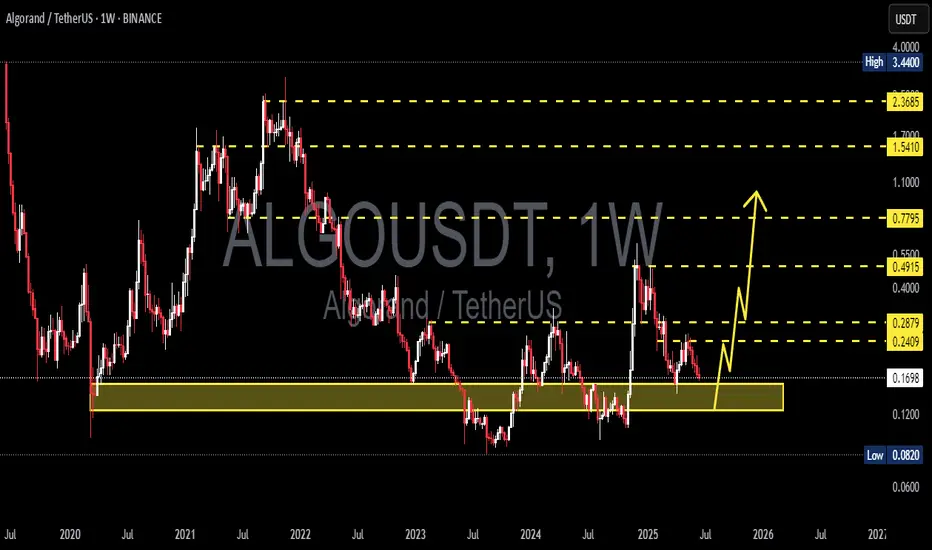
ALGO/USDT –Between Capitulation or Massive Reversal Zone?ALGO is now trading at one of the most decisive zones in recent years, a major historical support area between 0.17–0.135 — a battle zone between buyers and sellers since 2020.
Each time the price tapped this area, the market reacted with a strong reversal, signaling heavy accumulation by smart money. However, this time, selling pressure appears stronger, creating tension between a potential massive reversal or a final breakdown before a new redistribution phase.
The weekly structure continues to print consistent lower highs since 2021, confirming that the macro trend remains bearish. Yet, the recent price rejection around 0.135–0.17 and the presence of a liquidity sweep below that zone suggest that many retail stop-losses have been taken — possibly setting the stage for a mean reversion rally.
---
🟢 Bullish Scenario: “The Bottom Reclaim”
Confirmation only occurs if weekly close > 0.235 with strong volume.
A breakout above this level would signal a structural reclaim and open the path for a rally toward 0.285 – 0.49 as the primary targets.
If momentum strengthens, further expansion toward 0.78 – 1.54 remains possible (the former 2021–2022 distribution area).
Aggressive traders may consider accumulation within 0.17–0.135, with a tight stop below 0.12, aiming for a minimum 1:3 risk-reward ratio.
💡 Additional bullish narrative:
If the crypto market rotates capital from major layer-1 assets into mid-cap plays, ALGO could become one of the “revival candidates,” backed by strong liquidity and a recognizable brand.
---
🔴 Bearish Scenario: “Break the Floor”
If weekly close < 0.135, it would confirm a breakdown of multi-year structural support.
The next logical downside target lies around 0.082, the historical low and the last visible demand zone before uncharted territory.
Such a breakdown usually triggers a capitulation event, where short-term volume spikes due to panic selling.
In an extreme case, ALGO could establish a new structural range below 0.10 before attempting a long recovery.
💡 Additional bearish narrative:
If macro pressure persists (e.g., BTC retraces or USDT dominance rises), ALGO might experience a “final flush” before forming a structural bottoming pattern.
---
📊 Key Structure & Technical Patterns
Primary pattern: Long-term Accumulation Range with repeated liquidity sweeps below support.
Macro trend: still bearish, though momentum is weakening — visible through declining volatility and volume contraction.
Potential reversal trigger: a strong bullish engulfing candle from within the yellow box.
Volume divergence: watch for rising volume around 0.15–0.17 — it often signals silent accumulation by smart money.
---
🧭 Conclusion
ALGO is standing at a critical multi-year decision zone — it could either mark the beginning of a multi-year reversal or the final breakdown toward new lows.
Traders should focus on weekly reactions around 0.17–0.135 and wait for confirmed weekly closes before taking positions.
There is no “best” position yet — only patience and discipline will define the outcome at such a pivotal stage.
---
#ALGO #ALGOUSDT #Algorand #CryptoAnalysis #PriceAction #MarketStructure #SwingTrading #TechnicalAnalysis #CryptoBreakout #TradingViewCommunity
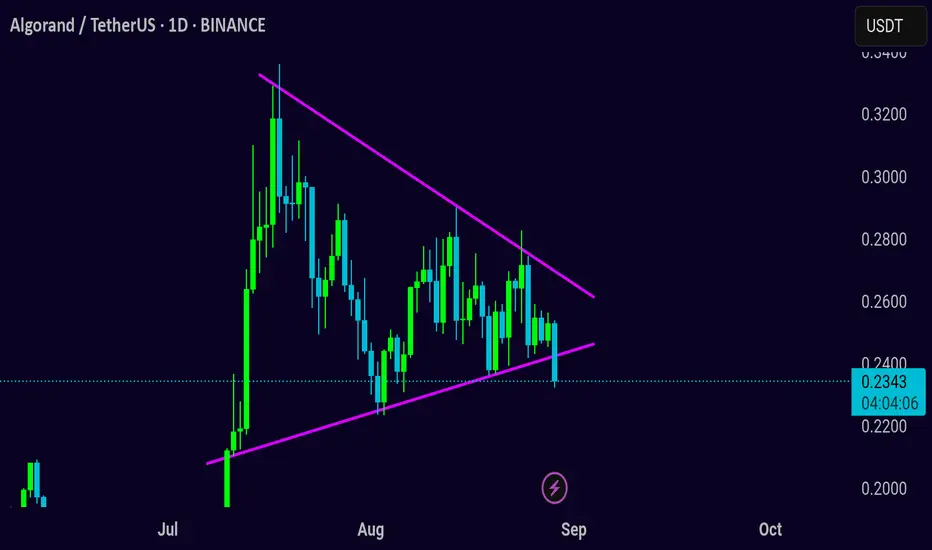
AlgoUsdt IdeaALGOUSDT UPDATE:
ALGO is currently trading around $0.2350. ALGO is breaking down a symmetrical triangle on the daily time frame. The possible scenarios are if the price successfully breaks the triangle and gives a daily close, then we may see bearish momentum in #ALGO. Otherwise, if it pumps from here and trades inside the triangle again, then it may go towards the upper resistance trendline of the triangle. Keep an eye on it.
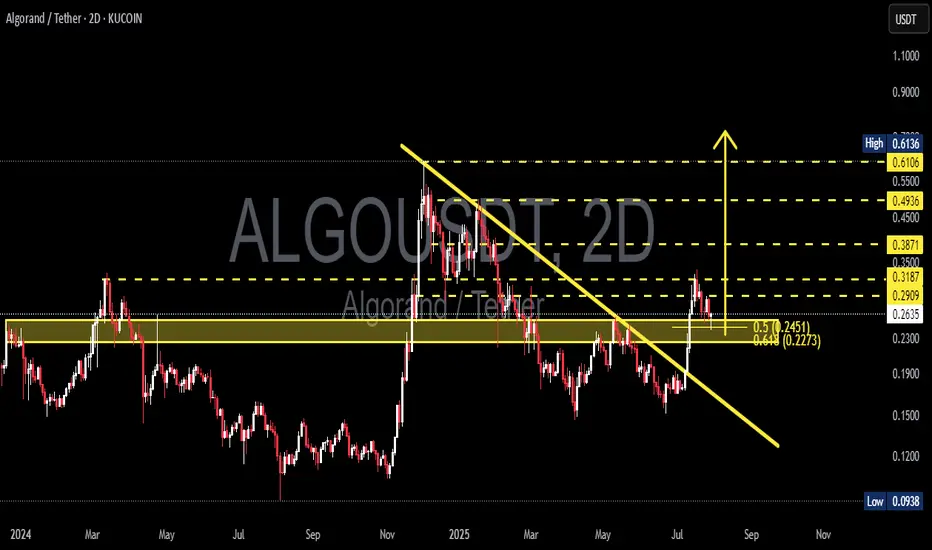
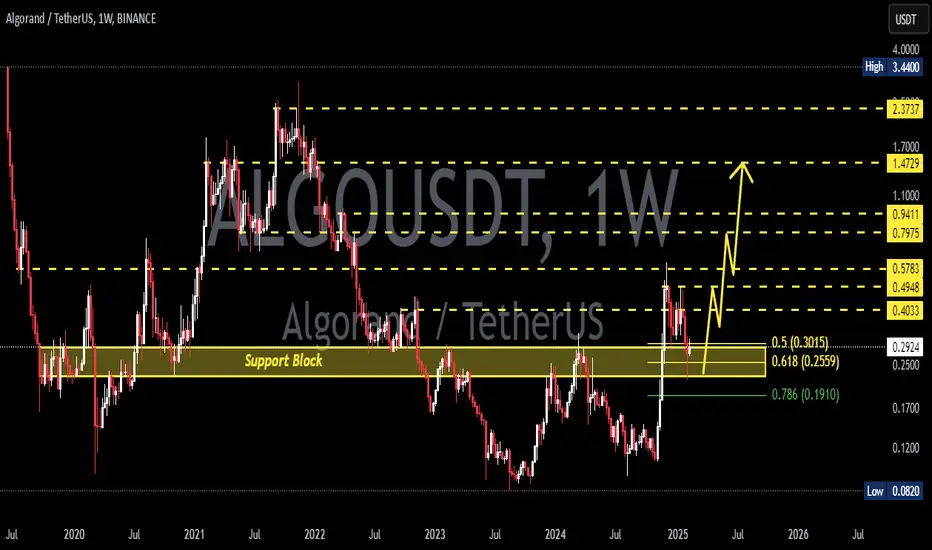
ALGOUSDT Break Downtrend – Reversal in Progress or Just a Retest📊 Technical Analysis Overview:
The Algorand (ALGO) / Tether (USDT) pair has shown a notable technical development by successfully breaking above a medium-term descending trendline that has acted as resistance since early 2025.
---
🔍 Pattern & Structure:
A clean breakout above the descending trendline (yellow sloped line) indicates a potential shift in trend from bearish to bullish.
Price is currently undergoing a retest of the breakout zone, aligning with the Fibonacci retracement levels 0.5 ($0.2451) and 0.618 ($0.2273).
The yellow horizontal zone ($0.25–$0.29) has been a significant support/resistance flip zone, showing strong historical reaction throughout 2024 and early 2025.
A higher high and higher low structure is starting to form — an early signal of a potential bullish reversal.
---
📈 Bullish Scenario:
If the price holds the support zone between $0.2451 and $0.2273, we could see a continuation of the upward move toward the following resistance levels:
$0.2909 (current minor resistance)
$0.3187
$0.3500
$0.3871
Mid-term targets: $0.4936 and $0.6106
A daily or 2D candle close above $0.3187 with strong volume would confirm a bullish continuation.
---
📉 Bearish Scenario:
On the other hand, failure to hold above the $0.2451–$0.2273 support zone could lead to a renewed bearish move with potential targets at:
$0.1900 (weekly historical support)
$0.1500
Extreme support: $0.0938 (2024 cycle low)
A break below $0.2273 would invalidate the breakout and may signal a bull trap.
---
📌 Summary:
ALGO is at a key inflection point. The current pullback could be a healthy correction after a breakout or a failed retest. Watch for price action and volume reaction near $0.2451–$0.2273 to confirm the next move.
#ALGO #Algorand #ALGOUSDT #CryptoAnalysis #TechnicalAnalysis #Breakout #BullishReversal #Fibonacci #SupportResistance #Altcoins #CryptoSetup #PriceAction
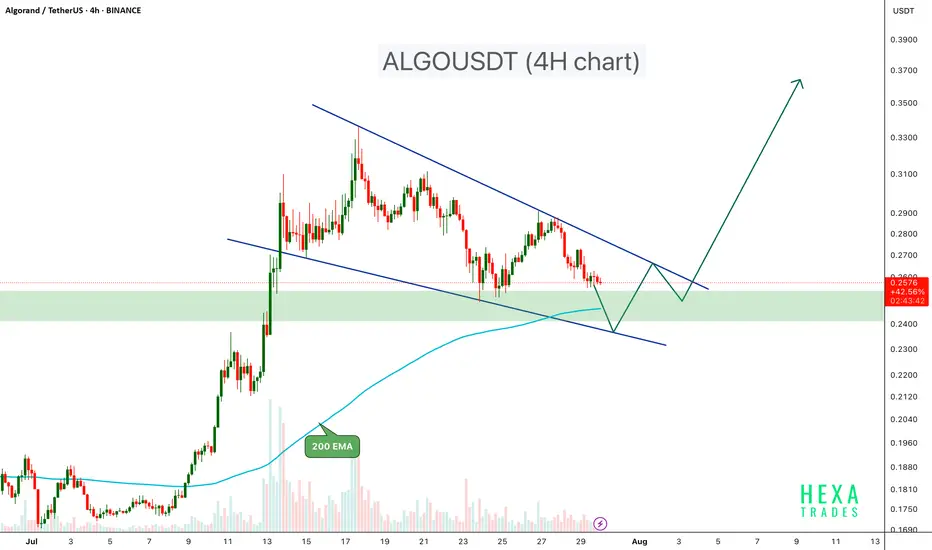
ALGOUSDT Forming Bullish Flag ALGOUSDT is currently trading inside a well-defined bullish Flag pattern on the 4-hour chart, a structure known for its bullish breakout potential. The price recently tested a significant demand zone, which previously acted as a base for a strong upward move earlier in July.
Key Points:
Bullish Flag Structure: Price is compressing within converging trendlines, forming lower highs and lower lows a classic bullish flag pattern.
Support Zone: The $0.24 – $0.255 area has acted as a strong demand zone, providing reliable support.
Bounce Potential: A bullish reaction from the lower flag boundary and demand zone could lead to a move toward the upper trendline and potentially trigger a breakout.
200 EMA Support: The 200 EMA is currently providing dynamic support, reinforcing the bullish setup.
Breakout Confirmation: A breakout above the flag resistance with strong volume could initiate a rally toward the $0.30 – $0.40 zone.
Cheers
Hexa
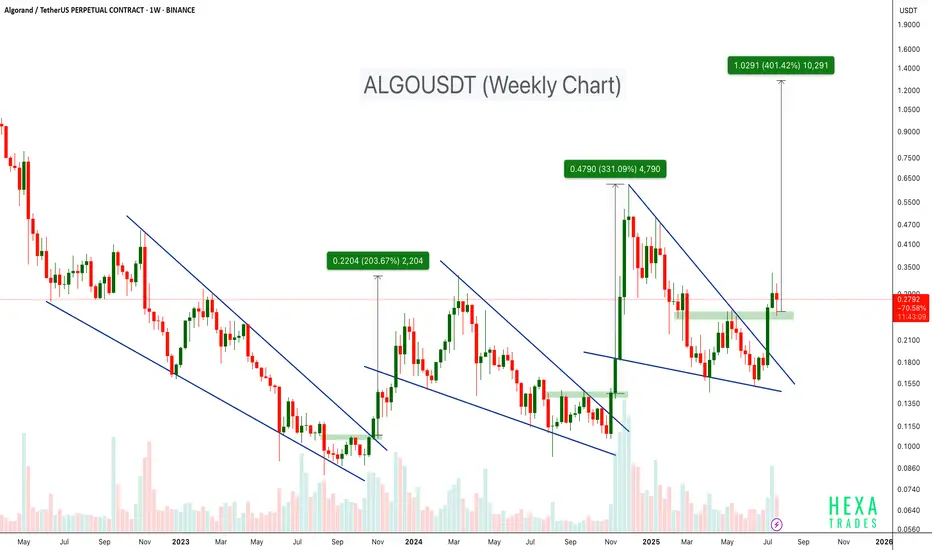
ALGO Breaks Out of Falling Wedge – 400% Target Ahead?BINANCE:ALGOUSDT has consistently followed a bullish pattern on the weekly timeframe. Each major rally has been preceded by a falling wedge breakout, as shown by the three highlighted instances on the chart.
- First breakout: ~200%+ move
- Second breakout: ~300%+ move
- Current breakout projection: Potential target up to +400%
The price has just broken above the wedge and is currently retesting the breakout zone. If history repeats itself, ALGO may be poised for a strong upside move from its current levels.
Cheers
Hexa🧘♀️
COINBASE:ALGOUSD EURONEXT:ALGO
ALGOUSDT Approaching Breakout!BINANCE:ALGOUSDT is showing a potential trend reversal after bouncing from a strong historical demand zone around $0.15. Price action is testing the descending trendline for a breakout, which could trigger a bullish continuation move. Similar to the previous breakout in late 2024, this setup hints at a possible repeat rally. A weekly close above the trendline would confirm strength, opening targets at $0.32 and $0.70+.
COINBASE:ALGOUSD

ALGOUSDT 1W AnalysisALGO ~ 1W Analysis
#ALGO Buy back gradually from here with a short-term target of at least 20%++.
ALGOUSDT 1D AnalysisALGO ~ 1D Analysis
#ALGO Buy back gradually from here with a short term target of at least 15%+ from here.

ALGOUSDT 1DALGO ~ 1D Analysis
#ALGO When this bullish pattern is successful, the sustainable increase may bring the price of this coin to increase at least 10%+ from here.

ALGOUSDT 1WALGO ~ 1W Analysis
#ALGO Buy from here if you still have a Conviction on this coin with a short -term target of at least 20%+.

algo ready for distribution/pump.algousdt is in manipulation of po3 formation. Also their team is very active now a days and doing partnerships. which can also be a good factor to buy this.

ALGOUSDT 1WALGO ~ 1W Analysis
#ALGO If you still have a Conviction on this coin. Maybe this is very good support to start buying again from here.
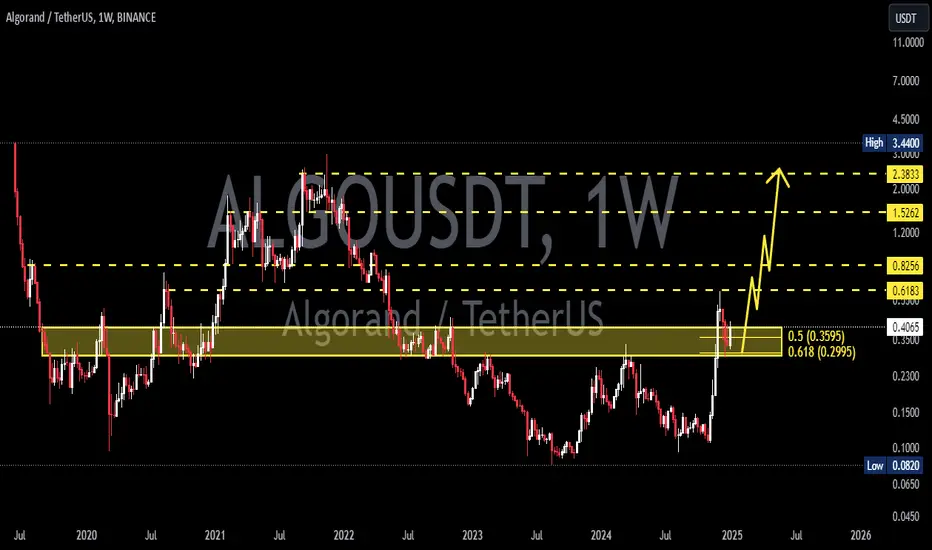
Algorand middle term targetsAlgorand middle term targets BINANCE:ALGOUSDT
Possible Targets and explanation idea
➡️We already sweep covid historical march 2020 low
➡️On a W tf we can see money inflow based on my Money Power indicator
➡️Perfect scenario with test of Buy line of my Take Profit indicator
➡️Target will be break out of downtrend line and test with full fill around 0.53$ monthly FVG.
Hope you enjoyed the content I created, You can support with your likes and comments this idea so more people can watch!
✅Disclaimer: Please be aware of the risks involved in trading. This idea was made for educational purposes only not for financial Investment Purposes.
---
• Look at my ideas about interesting altcoins in the related section down below ↓
• For more ideas please hit "Like" and "Follow"!

ALGOUSDT %150 HUGE VOLUME SPIKE!Green Line and Blue Box: Excellent Buy Zones
Both the green line and the blue box are thoroughly analyzed and show tremendous potential.
Highlights:
Green Line: A critical support level—simple yet effective. Buyers are likely to step in here.
Blue Box: Carefully selected using the best tools: volume footprint, volume profile, CDV, and liquidity heatmap. It’s a high-probability zone.
Buyer Confirmation: Early signs of buyer activity make these levels even more compelling.
Key Observations:
"The blue box is very carefully picked using volume footprint, volume profile, cumulative delta volume, and liquidity heatmap. When trading this zone, I will look for buyers and upward market structure breaks in lower time frames for confirmation."
This setup looks promising, and I’m optimistic about its potential. Let’s watch for confirmation before acting! 🚀
Let me tell you, this is something special. These insights, these setups—they’re not just good; they’re game-changers. I've spent years refining my approach, and the results speak for themselves. People are always asking, "How do you spot these opportunities?" It’s simple: experience, clarity, and a focus on high-probability moves.
Want to know how I use heatmaps, cumulative volume delta, and volume footprint techniques to find demand zones with precision? I’m happy to share—just send me a message. No cost, no catch. I believe in helping people make smarter decisions.
Here are some of my recent analyses. Each one highlights key opportunities:
🚀 RENDERUSDT: Strategic Support Zones at the Blue Boxes +%45 Reaction
🎯 PUNDIXUSDT: Huge Opportunity | 250% Volume Spike - %60 Reaction Sniper Entry
🌐 CryptoMarkets TOTAL2: Support Zone
🚀 GMTUSDT: %35 FAST REJECTION FROM THE RED BOX
🎯 ZENUSDT.P: Patience & Profitability | %230 Reaction from the Sniper Entry
🎯 DEXEUSDT %180 Reaction with %9 Stop
🐶 DOGEUSDT.P: Next Move
🎨 RENDERUSDT.P: Opportunity of the Month
💎 ETHUSDT.P: Where to Retrace
🟢 BNBUSDT.P: Potential Surge
📊 BTC Dominance: Reaction Zone
🌊 WAVESUSDT.P: Demand Zone Potential
🟣 UNIUSDT.P: Long-Term Trade
🔵 XRPUSDT.P: Entry Zones
🔗 LINKUSDT.P: Follow The River
📈 BTCUSDT.P: Two Key Demand Zones
🟩 POLUSDT: Bullish Momentum
🌟 PENDLEUSDT.P: Where Opportunity Meets Precision
🔥 BTCUSDT.P: Liquidation of Highly Leveraged Longs
🌊 SOLUSDT.P: SOL's Dip - Your Opportunity
🐸 1000PEPEUSDT.P: Prime Bounce Zone Unlocked
🚀 ETHUSDT.P: Set to Explode - Don't Miss This Game Changer
🤖 IQUSDT: Smart Plan
⚡️ PONDUSDT: A Trade Not Taken Is Better Than a Losing One
💼 STMXUSDT: 2 Buying Areas
🐢 TURBOUSDT: Buy Zones and Buyer Presence
🌍 ICPUSDT.P: Massive Upside Potential | Check the Trade Update For Seeing Results
🟠 IDEXUSDT: Spot Buy Area | %26 Profit if You Trade with MSB
📌 USUALUSDT: Buyers Are Active + %70 Profit in Total
🌟 FORTHUSDT: Sniper Entry +%26 Reaction
🐳 QKCUSDT: Sniper Entry +%57 Reaction
📊 BTC.D: Retest of Key Area Highly Likely
This list? It’s just a small piece of what I’ve been working on. There’s so much more. Go check my profile, see the results for yourself. My goal is simple: provide value and help you win. If you’ve got questions, I’ve got answers. Let’s get to work!

ALGOUSDT 1WALGO Update ~ 1W
#ALGO So far it still maintains its bullish structure. This buy range is very wide, buy in stages with a minimum target of 20%+
ALGOUSDTALGO ~ 1W
#ALGO If you still have Conviction on this coin,. This support block would be a very good buying place for now,. with a minimum target of 20%++

#ALGO/USDT#ALGO
The price is moving in a descending channel on the 1-hour frame and is sticking to it to a large extent and is expected to break it upwards
We have a bounce that was booked from the lower limit of the channel at a price of 0.1200
We have a downtrend on the RSI indicator which supports the rise
We have a trend to stabilize above the moving average 100
Entry price 0.1210
First target 0.1250
Second target 0.1300
Third target 0.1344

I'll let you know the direction of ALGO.Hello, my friends. Nice to meet you all
It's going from BEARISH EXTENDED WAVE to BULLISH EXTENDED WAVE.
We expect to break out the upper line of BULLISH WXTENDED WAVE with strong support from ZONE.

🚀💰 ALGOUSDT: 1 to 10 Trade Opportunity!Traders, get ready for a potential game-changer with ALGOUSDT! 🚀💰
🔍 Strong Support Zone:
We're eyeing a robust support zone where buyers are showing a strong reaction. It's highly probable that they'll step in again. Remember the last time? It sparked some impressive movement!
💡 Trade Strategy:
With the potential for a 1 to 10 trade, this setup could be a golden opportunity for profit! Keep a close watch on this support zone and be ready to seize the moment when the buyers make their move.
💬 Share Your Thoughts:
What's your take on this potential trade setup? Share your insights and let's discuss the possibilities together! Your input could be the key to unlocking this exciting opportunity!
💰 Unlock the Prize:
Remember, the best comment could unlock a special prize! So don't hold back—share your thoughts and join the conversation! 🏆💬
