#ALICE/USDT – Potential Trend Reversal After Long Accumulation#ALICE
The price is moving in a descending channel on the 1-hour timeframe. It has reached the lower boundary and is heading towards breaking above it, with a retest of the upper boundary expected.
We have a downtrend on the RSI indicator, which has reached near the lower boundary, and an upward rebound is expected.
There is a key support zone in green at 0.1724. The price has bounced from this zone multiple times and is expected to bounce again.
We have a trend towards consolidation above the 100-period moving average, as we are moving close to it, which supports the upward movement.
Entry price: 0.1807
First target: 0.1807
Second target: 0.1861
Third target: 0.1924
Don't forget a simple principle: money management.
Place your stop-loss order below the support zone in green.
For any questions, please leave a comment.
Thank you.
Alice

#ALICE/USDT – Potential Trend Reversal After Long Accumulation#ALICE
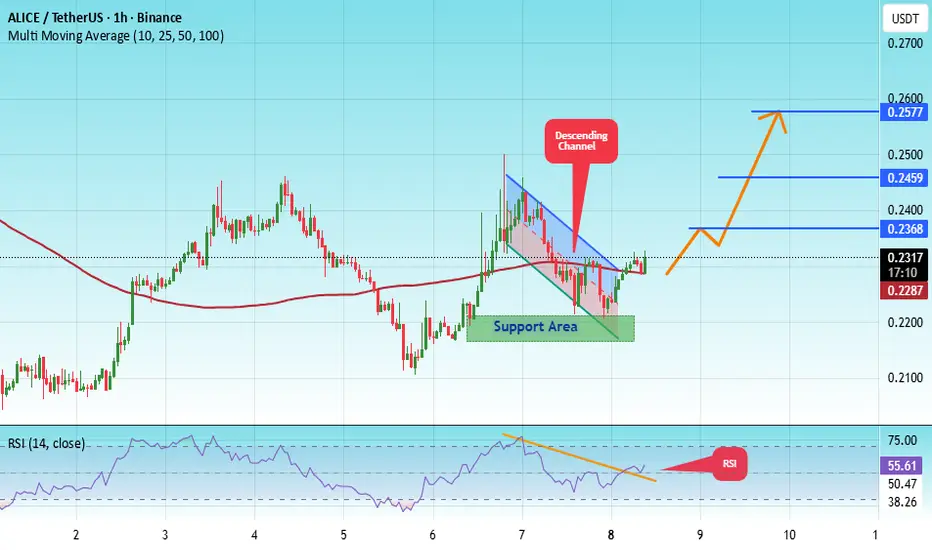
The price is moving in a descending channel on the 1-hour timeframe. It has reached the lower boundary and is heading towards breaking above it, with a retest of the upper boundary expected.
We have a downtrend on the RSI indicator, which has reached near the lower boundary, and an upward rebound is expected.
There is a key support zone in green at 0.2185. The price has bounced from this zone multiple times and is expected to bounce again.
We have a trend towards consolidation above the 100-period moving average, as we are moving close to it, which supports the upward movement.
Entry price: 0.2320
First target: 0.2370
Second target: 0.2460
Third target: 0.2577
Don't forget a simple principle: money management.
Place your stop-loss order below the support zone in green.
For any questions, please leave a comment.
Thank you.
#ALICE/USDT – Potential Trend Reversal After Long Accumulation#ALICE
The price is moving within an ascending channel on the 1-hour timeframe and is adhering to it well. It is poised to break out strongly and retest the channel.
We have a downtrend line on the RSI indicator that is about to break and retest, which supports the upward move.
There is a key support zone in green at the 0.2400 price level, representing a strong support point.
We have a trend of consolidation above the 100-period moving average.
Entry price: 0.2500
First target: 0.2578
Second target: 0.2661
Third target: 0.2272
Don't forget a simple money management rule:
Place your stop-loss order below the green support zone.
Once you reach the first target, save some money and then change your stop-loss order to an entry order.
For any questions, please leave a comment.
Thank you.

ENSO has found the bottom and is ready for growthIn addition to NTRN, I've hired ENSO today. It differs from NTRN by a significantly lower percentage of tokens in circulation, which will put pressure on the price and the dynamics will probably be smoother. Until October next year, emissions will be slow, exerting little pressure. In the future, I will indicate the target purchase and profit-taking zones for safe scalping in the form of inclined ranges that take into account the issue. At each test of the upper limit of profit taking, there is also an opportunity to work out long-term technical goals, according to ENSO, this is a retest of the range 1.75-2.5. After working out this range, there is a high probability of returning to the purchase zone at the next market drawdown. The main resistance today is the 1.0 level, the opening of a new month above which can lead to active purchases. The second half of the quarter opened above 0.850, which gives a signal for a stable consolidation above 1.0.
I am also considering TURTLE MITO VIC HOOK CHESS BMT with previously high technical goals for a retest of up to 300%. Against the background of the detected manipulation of issue data by binance, I will double-check the target levels for all coins and indicate them in further reviews, including inclined target ranges for reliable scalping, corresponding to further issuance for the coming year at least. I have checked the data for TURTLE ENSO and NTRN, they are reliable for scalping from the current levels.

Up to 200% on NTRNI hired NTRN today. For this token, the second half of the quarter opened above the 0.035 support, which gives a clear signal for growth. The first large investments have been made in recent days, but a stable trend can be expected by the end of the year with an attempt to consolidate in the range of 0.0750-1000. The main resistance is the 0.050-55 range. So far, it has not been taken against the background of a bearish trend that has gained a foothold on the indicators. Starting next week, the indicators will allow stable growth. If a new monthly candle opens above 0.05, further purchases will not be long in coming. The token has fallen to an extremely oversold position due to binance's speculation with the issue data. The actual number of tokens in circulation is still significantly lower, which gives great growth potential.
I'm also considering TURTLE CHESS HOOK VIC BMT MITO for work.

#ALICE/USDT – Potential Trend Reversal After Long Accumulation#ALICE
The price is moving within a descending channel on the 1-hour frame, adhering well to it, and heading for a strong breakout and retest.
We have a bearish trend on the RSI indicator that is about to be broken and retested, which supports the upward move.
There is a major support area in green at 0.3306, which represents a strong support point.
We are heading for consolidation above the 100 moving average.
Entry price: 0.4168
First target: 0.3473
Second target: 0.3580
Third target: 0.7300
Don't forget a simple matter: capital management.
When you reach the first target, save some money and then change your stop-loss order to an entry order.
For inquiries, please leave a comment.
Thank you.

#ALICE/USDT#ALICE
The price is moving within a descending channel on the 1-hour frame, adhering well to it, and is heading for a strong breakout and retest.
We have a bearish trend on the RSI indicator that is about to be broken and retested, which supports the upward breakout.
There is a major support area in green at 0.3500, which represents a strong support point.
We are heading for stability above the 100 moving average.
Entry price: 0.3849
First target: 0.3989
Second target: 0.4097
Third target: 0.4234
Don't forget a simple matter: capital management.
When you reach the first target, save some money and then change your stop-loss order to an entry order.
For inquiries, please leave a comment.
Thank you.

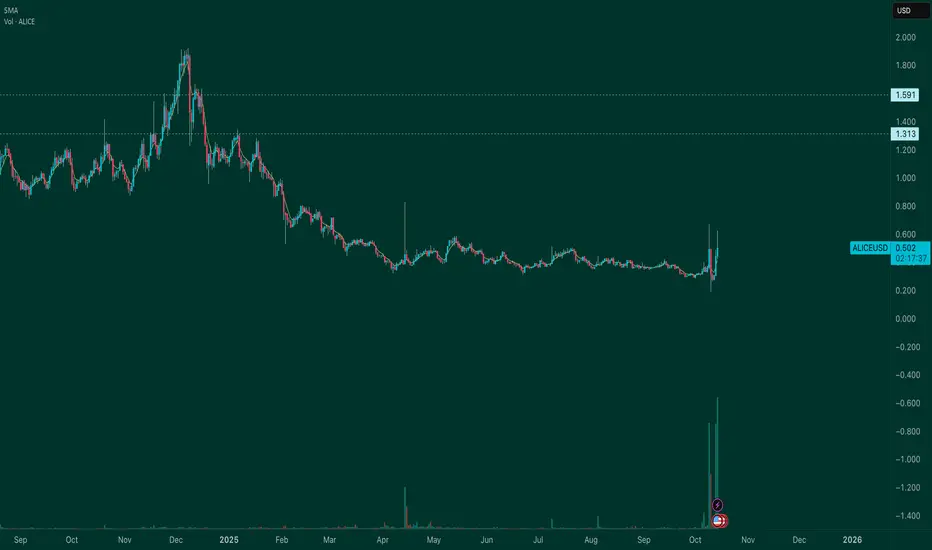
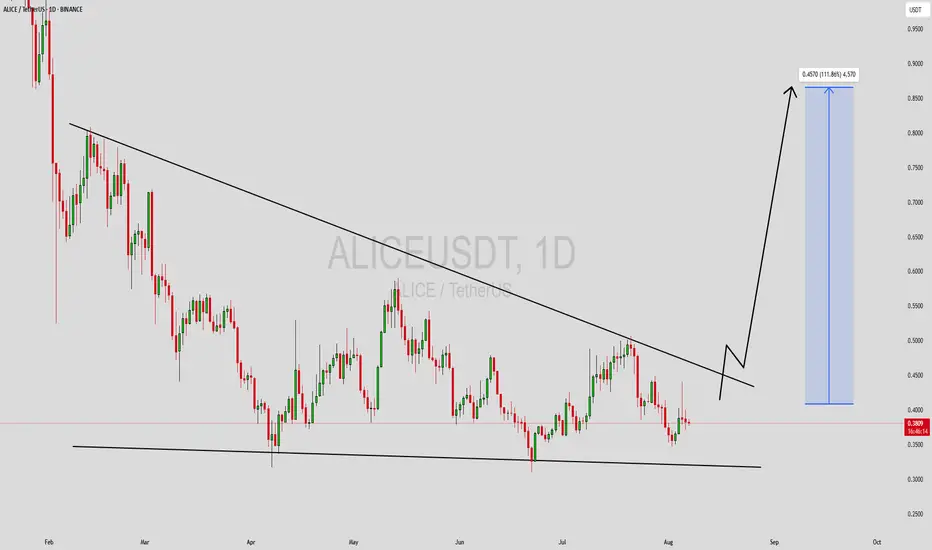
Rocket launch soon to 1.5?Looks bullish and could skyrocket to1.3-1.6 range. Must stay above 0.45. If it looses .45 then I m out. Safe trading. All the best.
Not a financial advise.
ALICEUSDT – Potential Trend Reversal After Long Accumulation PhaALICEUSDT – Potential Trend Reversal After Long Accumulation Phase
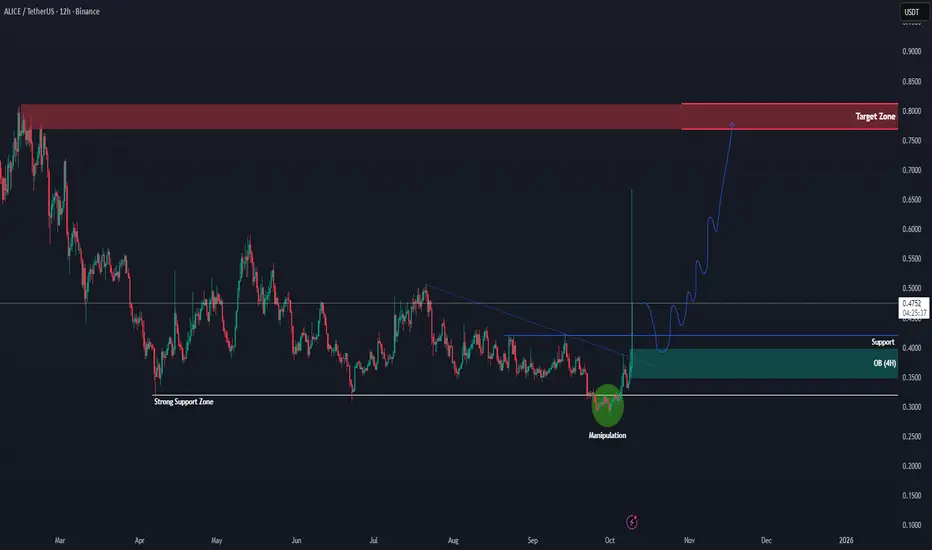
After several months of sideways movement, ALICE finally shows strong signs of reversal. The chart reveals a clear manipulation phase below the strong support zone, where price briefly dipped before quickly recovering. This manipulation often indicates that liquidity has been swept and smart money is entering the market. The breakout above the descending trendline confirms that bearish momentum is fading and a new bullish structure could be forming.
Currently, the 4H Order Block around 0.35–0.40 has turned into a solid support zone. As long as price holds above this area, the bullish outlook remains valid. A possible short-term pullback to retest this zone would create a healthy correction and a good entry opportunity for continuation toward higher levels.
The next major target sits around the 0.75–0.80 region, which aligns with the previous major resistance zone and liquidity area. However, if the price breaks back below 0.35, it would invalidate the current bullish setup and open a possibility for a deeper retracement. For now, ALICE is showing promising momentum, and the structure supports a potential mid-term bullish rally.
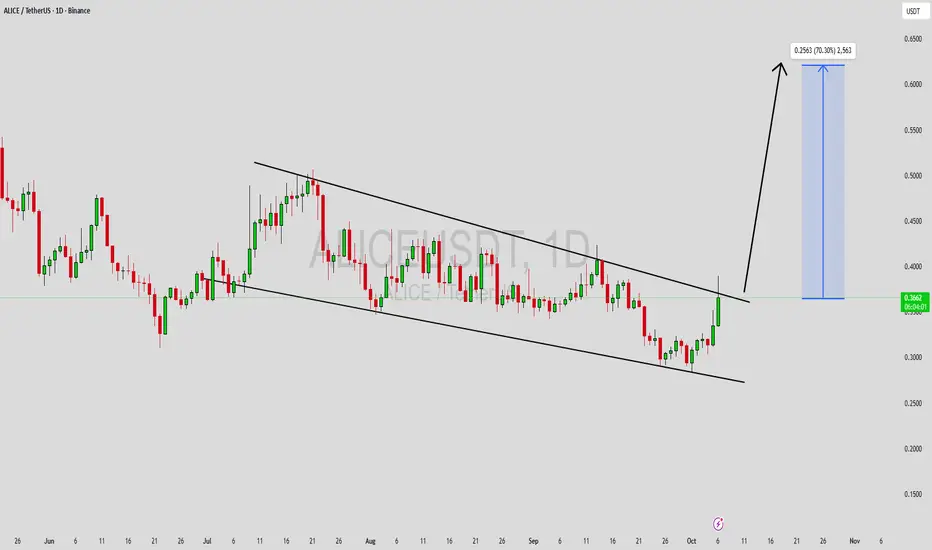
ALICEUSDT Forming Falling WedgeALICEUSDT is currently showing a clear falling wedge pattern, a strong technical setup that often signals a potential bullish reversal. This pattern forms when the price consolidates lower between two converging trendlines, reflecting decreasing selling pressure and a buildup of buying interest. The consistent decline in volatility within this wedge typically precedes a breakout, and with volume showing steady improvement, the setup looks primed for a potential surge once resistance is breached.
The recent market behavior around ALICEUSDT suggests accumulation by smart investors who anticipate a breakout rally. Historically, falling wedge breakouts lead to sharp upward momentum as traders recognize the shift in sentiment from bearish to bullish. With expectations of a 60% to 70% gai*, this coin could soon attract broader attention across the crypto market if price action confirms a bullish breakout above key resistance levels.
Investor confidence appears to be increasing, backed by healthy volume and renewed participation from traders seeking mid-term growth opportunities. If momentum continues to build and volume expands, ALICEUSDT may witness a swift recovery phase that aligns perfectly with the overall improving sentiment across altcoins. The coming sessions will be critical for confirmation of the breakout direction.
✅ Show your support by hitting the like button and
✅ Leaving a comment below! (What is You opinion about this Coin)
Your feedback and engagement keep me inspired to share more insightful market analysis with you!
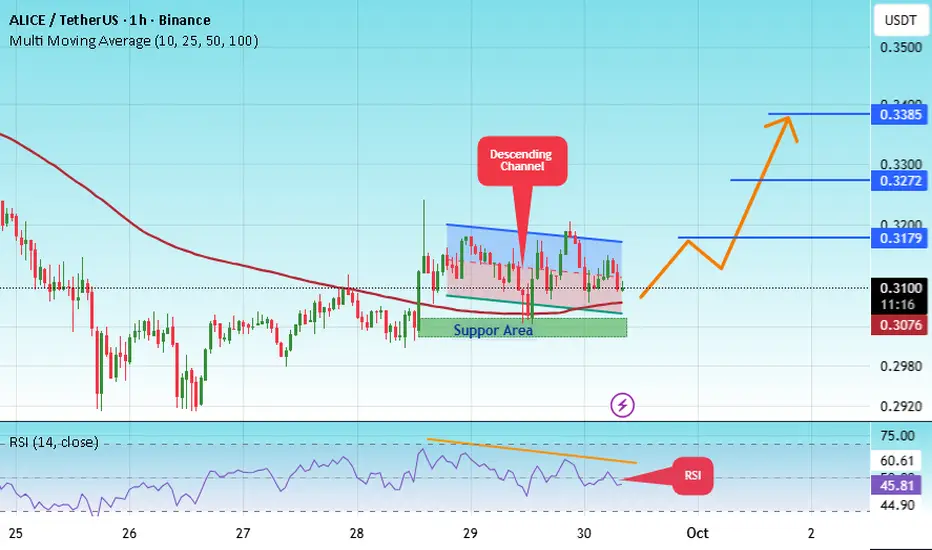
#ALICE /USDT — Descending Triangle at Demand Zone!
#ALICE
The price is moving within a descending channel on the 1-hour frame, adhering well to it, and is heading for a strong breakout and retest.
We have a bearish trend on the RSI indicator that is about to be broken and retested, which supports the upward breakout.
There is a major support area in green at 0.3040, which represents a strong support point.
We are heading for consolidation above the 100 moving average.
Entry price: 0.3070
First target: 0.3180
Second target: 0.3272
Third target: 0.3385
Don't forget a simple matter: capital management.
When you reach the first target, save some money and then change your stop-loss order to an entry order.
For inquiries, please leave a comment.
Thank you.
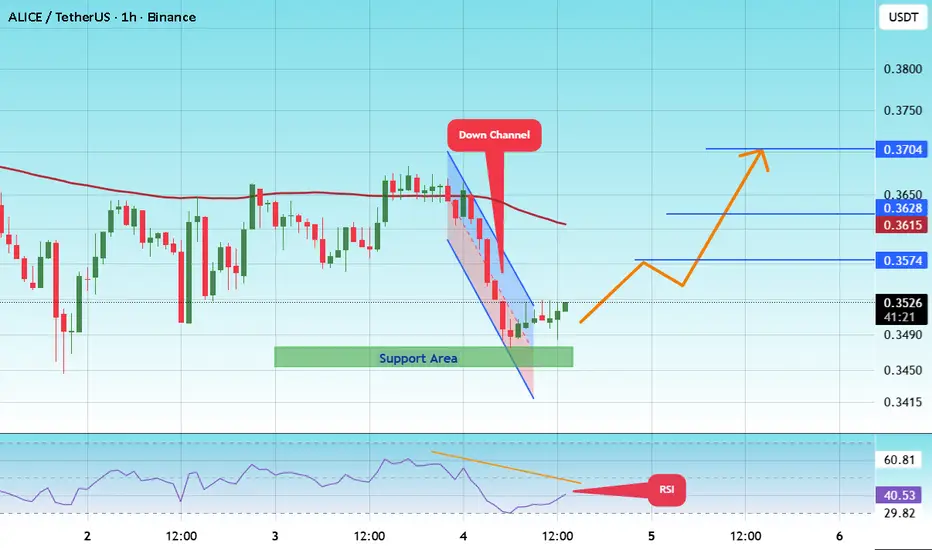
#ALICE/USDT — Descending Triangle at Demand Zone!#ALICE
The price is moving within a descending channel on the 1-hour frame and is expected to break and continue upward.
We have a trend to stabilize above the 100 moving average once again.
We have a downtrend on the RSI indicator that supports the upward move with a breakout.
We have a support area at the lower boundary of the channel at 0.3430, acting as strong support from which the price can rebound.
We have a major support area in green that pushed the price upward at 0.3470.
Entry price: 0.3520
First target: 0.3574
Second target: 0.3628
Third target: 0.3700
To manage risk, don't forget stop loss and capital management.
When you reach the first target, save some profits and then change the stop order to an entry order.
For inquiries, please comment.
Thank you.
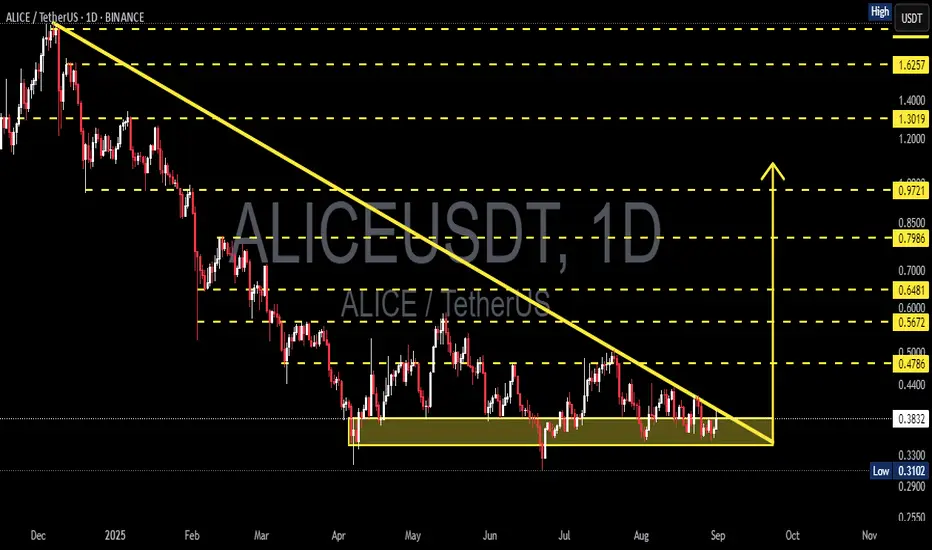
ALICE/USDT — Descending Triangle at Demand Zone!ALICE/USDT has been trapped in a mid-term downtrend since early 2025, consistently forming lower highs along a descending trendline. Despite the bearish pressure, price has repeatedly defended the 0.34–0.39 demand zone (yellow box) since May, creating a strong support base.
This consolidation has now shaped a Descending Triangle — a high-tension pattern that often leads to explosive moves once price breaks out of its narrowing range.
📌 Why it matters?
Descending Triangle is statistically a bearish continuation pattern.
However, when price compresses to the tip of the triangle, the probability of a strong breakout in either direction rises sharply.
---
🔑 Key Levels
Critical Demand Zone: 0.39 – 0.34
Supports below: 0.3102 → 0.2900 → 0.2550
Resistance to watch: 0.4786 → 0.5672 → 0.6000 → 0.6481 → 0.7986 → 0.9721 → 1.3019 → 1.6257
---
📈 Bullish Scenario
A daily close above the descending trendline (~0.40–0.41) would signal breakout confirmation.
If confirmed with strong volume, upside targets may unfold:
🎯 Target 1: 0.4786
🎯 Target 2: 0.5672 – 0.6000
🎯 Target 3: 0.6481 – 0.7986
Breakout + Retest = high-probability setup for trend reversal in the short term.
---
📉 Bearish Scenario
A clean breakdown below 0.34 confirms the Descending Triangle as bearish continuation.
Potential downside targets:
🎯 Target 1: 0.3102
🎯 Target 2: 0.2900
🎯 Target 3: 0.2550 (major support)
As long as price remains capped under the descending trendline, sellers retain the upper hand.
---
⚖️ Conclusion
ALICE is at a major crossroads:
Holding above 0.34–0.39 and breaking the trendline could spark a recovery rally.
Losing the demand zone opens the door to deeper downside levels.
➡️ Wait for daily close confirmation before taking positions.
➡️ Manage risk carefully — Descending Triangle breakouts are usually followed by high volatility.
#ALICEUSDT #ALICE #CryptoAnalysis #DescendingTriangle #Altcoins #Breakout #Breakdown #CryptoTrading #SupportResistance #PriceAction
ALICEBINANCE:ALICEUSDT
#ALICE/ USDT
Entry range (0.3600- 0.3850)
SL 1D close below 0.34
T1 0.44
T2 0.53
T3 0.71
**** This coin has a great targets , but it is only the beginning ****
_______________________________________________________
Golden Advices.
********************
* collect the coin slowly in the entry range.
* Please calculate your losses before the entry.
* Do not enter any trade you find it not suitable for you.
* No FOMO - No Rush , it is a long journey.

ALICE MAINNET ON WAY - PRICE CAN MOON TO $1.97ALICE is interesting coin to follow as swing, the price action can show new targets for the upcoming time.

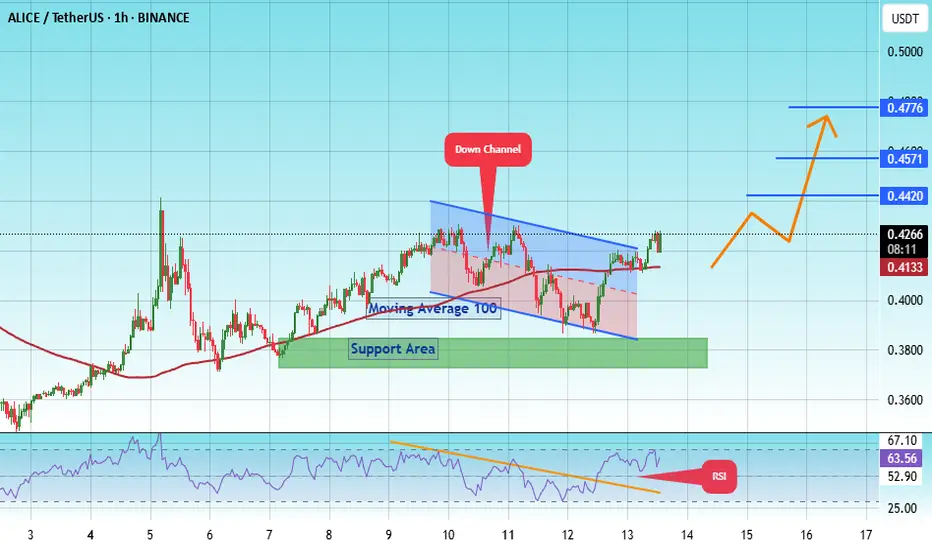
#ALICE/USDT Ready to go higher !#ALICE
The price is moving within an ascending channel on the 1-hour frame, adhering well to it, and is on track to break it strongly upwards and retest it.
We have support from the lower boundary of the ascending channel, at 3888.
We have a downtrend on the RSI indicator that is about to break and retest, supporting the upside.
There is a major support area in green at 0.3777, which represents a strong basis for the upside.
Don't forget a simple thing: ease and capital.
When you reach the first target, save some money and then change your stop-loss order to an entry order.
For inquiries, please leave a comment.
We have a trend to hold above the 100 Moving Average.
Entry price: 0.4250
First target: 0.4420
Second target: 0.4571
Third target: 0.4776
Don't forget a simple thing: ease and capital.
When you reach the first target, save some money and then change your stop-loss order to an entry order.
For inquiries, please leave a comment.
Thank you.
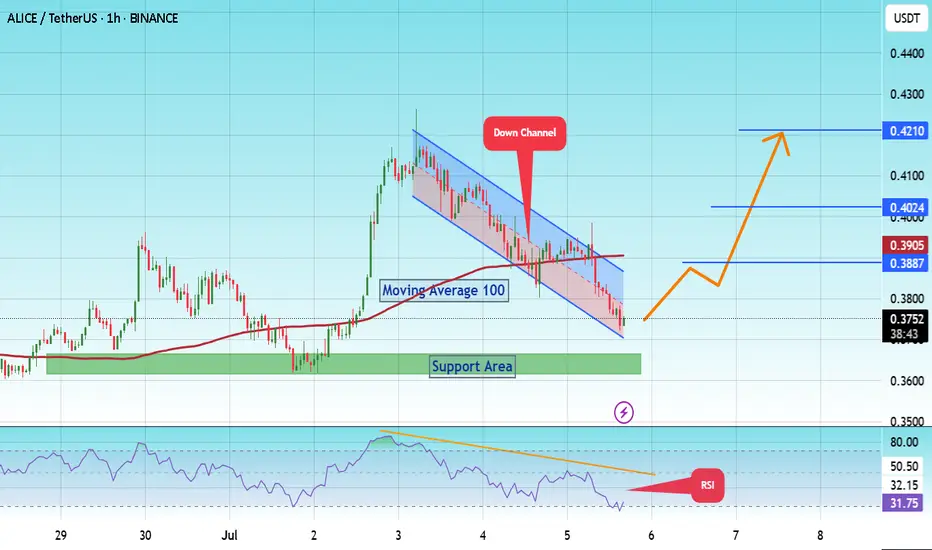
#ALICE/USDT Ready to go higher#ALICE
The price is moving within a descending channel on the 1-hour frame and is expected to break and continue upward.
We have a trend to stabilize above the 100 moving average once again.
We have a downtrend on the RSI indicator that supports the upward break.
We have a support area at the lower boundary of the channel at 0.3700, acting as strong support from which the price can rebound.
We have a major support area in green that pushed the price higher at 0.3632.
Entry price: 0.3753.
First target: 0.3887.
Second target: 0.4024.
Third target: 0.4210.
To manage risk, don't forget stop loss and capital management.
When you reach the first target, save some profits and then change the stop order to an entry order.
For inquiries, please comment.
Thank you.
ALICEUSDT Forming Descending ChannelALICEUSDT is currently trading within a descending channel pattern, a classic technical structure that often precedes a significant bullish reversal. This pattern forms when price action is contained between two downward-sloping parallel lines, signaling a gradual downtrend. However, these channels are known to break to the upside once bearish momentum weakens and buying interest returns. With ALICEUSDT showing good volume and healthy investor attention, the conditions are aligning for a potential breakout.
Descending channels are closely monitored by technical traders due to their strong risk-to-reward setup. ALICE is currently near the lower boundary of the channel, offering an ideal entry point for those anticipating a reversal. If the price manages to break out from the upper trendline with volume confirmation, we could see a sharp rally toward the projected gain range of 90% to 100% or even higher. Historical price behavior and market structure further strengthen this bullish outlook.
Investor sentiment around ALICEUSDT is building steadily, fueled by renewed interest in metaverse and blockchain gaming projects. As more investors take note of the technical setup and potential gains, we may see increased participation, driving momentum further. Technical indicators such as RSI and MACD are also showing signs of potential divergence, often seen before breakout moves.
Given the strong pattern formation, growing volume, and market interest, ALICEUSDT stands as a high-potential candidate for the coming weeks. Traders should keep an eye on key resistance levels and volume surges as potential breakout confirmation signals.
✅ Show your support by hitting the like button and
✅ Leaving a comment below! (What is You opinion about this Coin)
Your feedback and engagement keep me inspired to share more insightful market analysis with you!
ALICE/USDT – Will It Rebound from Demand Zone or Break Down?🧭 Analysis Summary:
ALICE is at a critical turning point, once again testing a historical demand zone that has provided strong support since Q2 2025. The current price action suggests potential accumulation, setting the stage for a significant move — either a powerful bounce or a devastating breakdown.
---
📌 Chart Details (Daily Timeframe):
Main Trend: Still in a macro downtrend since December 2024
Current Price: $0.3714
Key Demand Zone: $0.35 – $0.41 (highlighted yellow box)
Nearest Supports: $0.35 → $0.3102 (2025 low)
Layered Resistance Levels: $0.4786 → $0.5672 → $0.6481 → $0.7986 → $0.9754
---
🧱 Market Structure & Patterns:
Price has been consolidating in a tight range over recent weeks — indicating possible accumulation or distribution.
The long-standing descending channel shows signs of exhaustion, with repeated rejections from the demand zone.
A small double bottom pattern appears to be forming, suggesting a possible reversal if validated.
---
📈 Bullish Scenario – Reversal Potential on Confirmation:
✅ If the price holds above $0.35 and forms a higher low, a trend reversal could take shape.
✅ A breakout above $0.41 would act as the first bullish confirmation.
🎯 Upside Targets:
$0.4786 → minor resistance, good for short-term swing trades
$0.5672 – $0.6481 → mid-range resistance & Fibonacci levels
$0.7986 – $0.9754 → longer-term recovery zone if sentiment improves
💡 Stronger confirmation would come from increasing volume and Daily RSI crossing above 50.
---
📉 Bearish Scenario – Breakdown and Trend Continuation:
❌ A breakdown below $0.35 would likely push price toward the $0.3102 support — the lowest level of the year.
❌ If $0.31 fails, further downside toward $0.25 or even $0.20 is possible, due to a lack of nearby historical support.
💀 This would confirm the continuation of the major downtrend, signaling sellers still have control.
---
📊 Market Sentiment:
On a broader scale, altcoins are still under pressure amid regulatory uncertainty and declining DeFi activity.
However, ALICE’s demand zone remains a high-interest area for traders seeking mid-term accumulation opportunities.
---
🎯 Strategy Ideas:
Strategy Type Action Key Levels
Buy on Breakout Enter on confirmed breakout > $0.41 Target: $0.48 – $0.64
Sell on Breakdown Short below $0.35 Target: $0.31 or lower
Range Trade Buy low, sell high between $0.35–$0.41 Tight stop-loss recommended
---
📝 Conclusion:
ALICE/USDT is at a technical and psychological crossroads. This yellow zone is where big moves often begin — the question is, will bulls take control or will bears pull it deeper? All eyes should be on how price reacts to this demand area.
#ALICEUSDT #CryptoTA #AltcoinAnalysis #DemandZone #BreakoutOrBreakdown #PriceAction #VolumeAnalysis #CryptoReversal #SwingTradeSetup #ALICEAnalysis #CryptoTrend

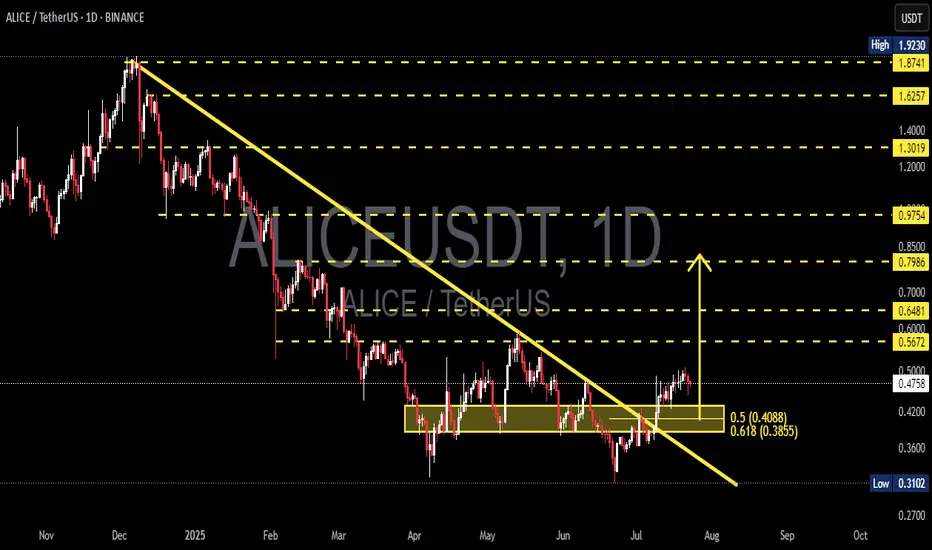
ALICEUSDT: Massive Trendline Breakout + Fibonacci Confluence🔍 Overview:
After months of relentless selling pressure, ALICE has finally broken out of a long-term downtrend that began back in late 2024. But this isn’t just any breakout—it's a strong technical signal pointing toward a potential shift from accumulation to expansion, and possibly a major bullish run.
📌 Key Technical Highlights:
✅ 1. Long-Term Downtrend Breakout:
The descending trendline that has acted as resistance since November 2024 has now been cleanly broken, indicating a reversal in trend and the start of a potential new bullish cycle.
✅ 2. Bullish Accumulation Box (April – July):
ALICE formed a solid horizontal accumulation range between $0.385 and $0.42 for more than three months. A breakout from this range is often the trigger for an impulsive rally.
✅ 3. Golden Pocket Fibonacci Retest:
Price has recently bounced precisely from the 0.5 (0.4088) and 0.618 (0.3855) Fibonacci retracement levels, also known as the “golden pocket”—a high-probability bounce zone favored by smart money.
✅ 4. Clean Fibonacci-Based Targets:
Future resistance levels are well-defined by historical supply zones and Fibonacci extensions—offering a structured pathway for swing trade setups.
🧠 Market Psychology Right Now:
Retail traders are still hesitant after a prolonged downtrend (reduced FOMO = smart entry zone).
Smart money likely completed accumulation within the yellow box range.
This type of breakout often triggers "delayed FOMO" once initial resistances start getting taken out.
📈 Bullish Scenario (High Probability):
As long as ALICE holds above the breakout support at $0.408–$0.42:
🚀 Target 1: $0.5672
🚀 Target 2: $0.6481
🚀 Target 3: $0.7986
🎯 Main Target: $0.9754 (potential 100%+ upside from breakout box)
📉 Bearish Scenario (If Breakout Fails):
If price drops below $0.385:
⛔ It could re-enter the boring sideways range
⛔ Loss of bullish momentum
⛔ Potential retest of $0.31 (previous cycle low)
🟠 This would signal a false breakout — although this scenario currently seems less likely due to strong breakout structure.
🔎 Additional Confirmations:
✅ Breakout volume higher than average
✅ Formation of Higher Highs and Higher Lows
✅ Daily close above both trendline and accumulation box
🧭 Trading Strategy Idea:
Ideal Entry: Pullback to $0.408–$0.42
Stop Loss: Below $0.385
Targets: Use Fibonacci levels for gradual take-profits
Risk/Reward: Setup offers 3:1 or better R/R
✍️ Final Thoughts:
> “The longer the base, the stronger the breakout.”
ALICE has built a solid foundation over several months and now shows all the right signs of a textbook bullish breakout. With a clean structure, Fibonacci alignment, and growing momentum—this setup should be on every swing trader’s radar.
#ALICEUSDT #TrendlineBreakout #FibonacciConfluence #CryptoSetup #AltcoinWatch #BreakoutTrading #TechnicalAnalysis #SwingTradeCrypto #VolumeBreakout
ALICE ( SPOT)BINANCE:ALICEUSDT
#ALICE/ USDT
Entry range (0.38- 0.41)
**** Wait for the price to come to the entry range ****
SL 4H close below 0.36
T1 0.5170
T2 0.5700
T3 0.6100
T4 0.6800
**** Wait for the price to come to the entry range ****
_______________________________________________________
Golden Advices.
********************
* collect the coin slowly in the entry range.
* Please calculate your losses before the entry.
* Do not enter any trade you find it not suitable for you.
* No FOMO - No Rush , it is a long journey.

#ALICE/USDT#ALICE
The price is moving within a descending channel on the 1-hour frame, adhering well to it, and is on its way to breaking it strongly upwards and retesting it.
We are seeing a bounce from the lower boundary of the descending channel, which is support at 0.4560.
We have a downtrend on the RSI indicator that is about to break and retest, supporting the upward trend.
We are looking for stability above the 100 moving average.
Entry price: 0.4835
First target: 0.5028
Second target: 0.5263
Third target: 0.5533

ALICEUSDT 1D AnalysisALICE ~ 1D Analysis
#ALICE Currently it comes out of this declining zone. Maybe this support block you can consider to start buying back from here with a short -term target of at least 10%+.
