Alice

ALICEUSDT. LONGTERM targetALICEUSDT weekly chart. This is what i see.
Alice's pullback is likely printed a right shoulder .
to make a huge ihns pattern (inverse head and shoulder).
It'll be a shaky climb. But holding it for a longterm, i think it's a good investment / good buy right now.
if you look closely at 4H timeframe . ALICEUSDT is having a bullish divergence .
so i think. this is an opportunity to accumulate.
target will follow the arrow.
waddya think?
*not financial advice

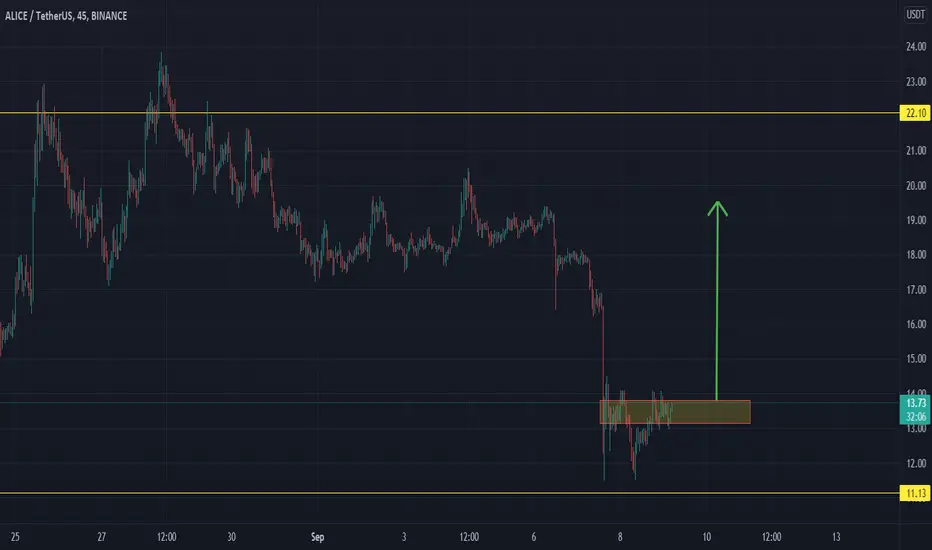
Alice symmetrical triangleAlice in a triangle, support at 12.58 holds for now. The next big support is at 11.6, if that is lost, ALICE could go down in big steps... We have a chance to see some upside movement in the near term, but I would be surprised if it would be a long-lasting trend. So it could be nice if you are in short-term trading. Set alarms. Good luck traders...

Is ALICE The next AXS?! Keep an eye on this!Here's a quick look at ALICE 1 hr chart. As we can see, the price has been going sideways and has printed a symmetrical triangle. Definitely one to keep an eye on.
The best entry would be, when the price breaks above the symmetrical triangle with good amount of volume .
-------------------------------------------
The idea is: Buy the breakout from the symmetrical triangle and take profits at the levels shown in the chart.
Targets:
- Profits can be taken in the resistance zone .
1. 14.4$
2. 15.2$
3. 16.4$
-------------------------------------------
If you like the content, then make sure to comment and like the post :D
Follow me for daily profitable trading setups
BTC dictates the market. If BTC falls, then Alts will fall as well. Trade safe!

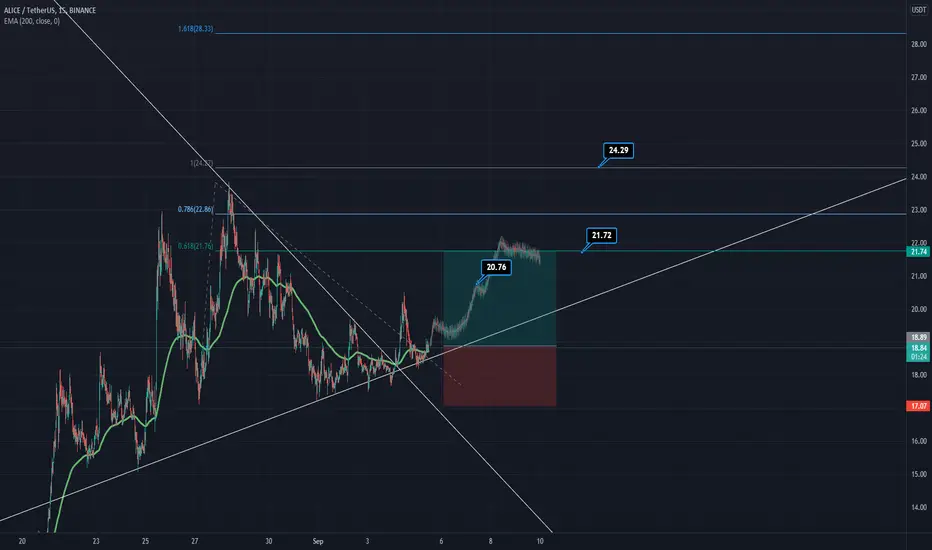
My take on ALICE / USDTThis is how I personally would trade ALICE / USDT based on the 1h timeframe. Targets are based on the Fibonacci retracement model.
Wait for the price to break out of the symmetrical triangle to the upside and take profits from either;
Target 1 - 14$ (approx. 5-6% gain)
Target 2 - 14.50$ (approx 9-10% gain)
Target 3 - 15$ (12-13% gain)
Target 4 - approtemately 16$ (approx 17-18% gain)
Every single comment, like and follow are dearly appriciated.
Follow me for more ideas and analysis.

ALICEUSDTDisclaimer: All Videos/Information on this channel are for Education purpose only .They are not buy/Sell Recommendations . Please consult your financial Advisor before taking any trade or investment decisions .
Discount Coming


Aliceusd(long)Bitcoin will rise slowly but other symbols can grow faster it’s the best time to have several perpetual trade in suitable symbols don’t forget set stop loss

Alice Next MoveMy Neighbor Alice is going to exploded, Be prepared for a huge and fast profit for this position, It has been indicated two Head & Shoulder patterns in 4hr time frame and currently performing a double bottom pattern, It will be good for Loooooooong.
#Iamnotafinancialadvisor#
#doyourownresearch#
Thank You!

ALICE ON INTERESTING TREND TO INCREASEHello trading friends,
✅Alice shows interesting increase trends.

alice/usdt technical analysisalice is fundamently strong coin and technical analysic is saying that alice is very bullish may be it will show in top gainors coin in just few days

alice/usdtguys i am bullish on alice... tp is 25.5
lets break this trend line and go up to 30%
sl is high but tp is high too (be carefully always)

ALICE WILL GO UP HAHAHAHbuy alice in spot . it is bulish chart and touch 3 target soon. be portifable
Alice Forming a uptrend Channel on 1hrSuper Profitale ,if it goes in right direction.
Alice is setting up on 1hr timeframe .
It might break it's ATH in the go...
So long ,BUY Hold , once ATH broken , road to 34 will be clear ...

ALICE TF 4H Can Move to $30 Alice's movement in TF4H is still on the uptrend line. There are several scenarios for Alice's Next Move. The first scenario is moving up towards the upside target of $30 maximum target of the sideway area of $17-$18. And the second scenario has to go back down to test the support between $16-$15 then rise again. These two scenarios show the positive side of the upward movement of ALICE on the 4h timeframe. The worst scenario is possible when price dump until breakdown $14. Always manage your risk management. #NotFinancialAdvice

ICP Rebounds from support, where to go from here?Welcome to my once a week commentary in English.
Today I will be talking about BTC, ETH, ALICE, ICP, DOGE and ADA.
My trading strategy is based on a combination of Harmonics and simple trendlines.
Hope you all find my commentray useful.
Good luck and good trading!


Another signal for uptrend is occur !!!In a previous analysis on Alice , I recognized the possibility of a price increase - now in 4-hour timeframe another signal is formed to Increase Price

Do not miss Alice 70% profit !!!Do not miss Alice 70% profit !!!
According to the chart - as you can see, Alice Currency has formed a cup pattern that has formed the cup handle well and started to climb.
The price is currently testing the edge of the cup
In addition to these signals - has also formed a valid ascending channel
After forming a valid ascending candlestick pattern, you can enter a suitable ascending position by considering trading points, which will bring 70% profit in your first target.
For our support - Like this analysis and follow us
Thanks
Hamid Mojarad
Trader and cryptographer
Consultant and investor of repu table investment companies

ALICE BREAKOUT THE FALLING WEDGE! 4H TFThe falling wedge pattern (Marked on the grey thick lines) is a continuation pattern that forms when price bounces between two converging and downward sloping trend lines. This is considered a bullish chart formation but can show both reversal and continuation patterns – depending on where it appears in the trend.
It breaks the falling wedge (red circle area) with a significantly higher volume than average. Meaning it has a good chance to continue the upward movement. The immediate resistance is on $20, then $21.65 area.
A major resistance is on $19.
This chart is only an analysis of the current trend, not a financial advice to do any action. Please trade responsibly, and do not forget to do your own research.

Alice possible breakout? 4TFA close above triangle and $18.8 may confirm trend reversal.
MACD on 4 hr looking bullish as well.
TP targets based on fibs.
As always DYOR, NFA , just an idea.

alice bottomed outso as it shown in the chart by gann angle and volume profile the Alice/usdt is bottomed out and ready for next bull run to 25 $ obviously this is not final target because there is long road for Alice in alt season. in my opinion till the april alice can go further than 60 $
"not suggested to buy or sell"
