#ALICE/USDT – Potential Trend Reversal After Long Accumulation#ALICE
The price is moving in a descending channel on the 1-hour timeframe. It has reached the lower boundary and is heading towards breaking above it, with a retest of the upper boundary expected.
We have a downtrend on the RSI indicator, which has reached near the lower boundary, and an upward rebound is expected.
There is a key support zone in green at 0.1724. The price has bounced from this zone multiple times and is expected to bounce again.
We have a trend towards consolidation above the 100-period moving average, as we are moving close to it, which supports the upward movement.
Entry price: 0.1807
First target: 0.1807
Second target: 0.1861
Third target: 0.1924
Don't forget a simple principle: money management.
Place your stop-loss order below the support zone in green.
For any questions, please leave a comment.
Thank you.
Alicebtc

#ALICE/USDT – Potential Trend Reversal After Long Accumulation#ALICE
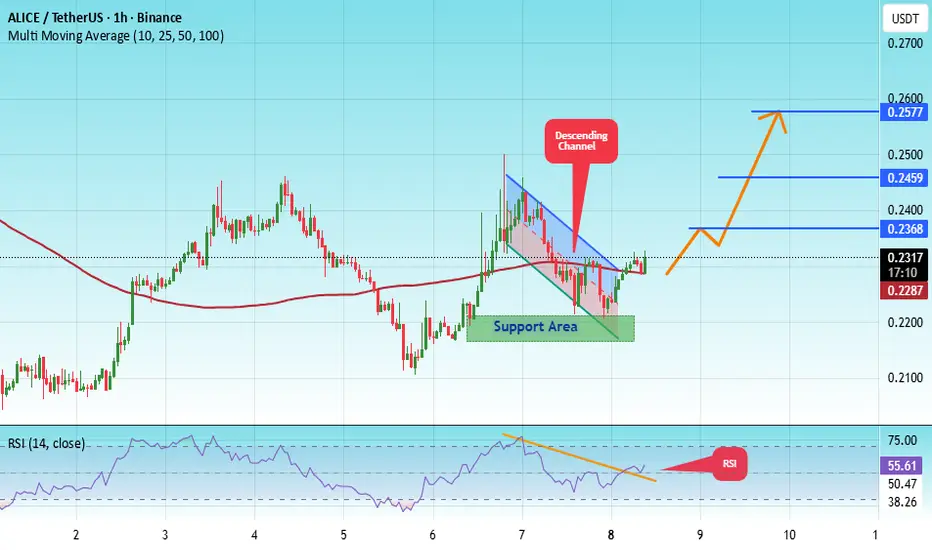
The price is moving in a descending channel on the 1-hour timeframe. It has reached the lower boundary and is heading towards breaking above it, with a retest of the upper boundary expected.
We have a downtrend on the RSI indicator, which has reached near the lower boundary, and an upward rebound is expected.
There is a key support zone in green at 0.2185. The price has bounced from this zone multiple times and is expected to bounce again.
We have a trend towards consolidation above the 100-period moving average, as we are moving close to it, which supports the upward movement.
Entry price: 0.2320
First target: 0.2370
Second target: 0.2460
Third target: 0.2577
Don't forget a simple principle: money management.
Place your stop-loss order below the support zone in green.
For any questions, please leave a comment.
Thank you.
#ALICE/USDT – Potential Trend Reversal After Long Accumulation#ALICE
The price is moving within an ascending channel on the 1-hour timeframe and is adhering to it well. It is poised to break out strongly and retest the channel.
We have a downtrend line on the RSI indicator that is about to break and retest, which supports the upward move.
There is a key support zone in green at the 0.2400 price level, representing a strong support point.
We have a trend of consolidation above the 100-period moving average.
Entry price: 0.2500
First target: 0.2578
Second target: 0.2661
Third target: 0.2272
Don't forget a simple money management rule:
Place your stop-loss order below the green support zone.
Once you reach the first target, save some money and then change your stop-loss order to an entry order.
For any questions, please leave a comment.
Thank you.

#ALICE/USDT – Potential Trend Reversal After Long Accumulation#ALICE
The price is moving within a descending channel on the 1-hour frame, adhering well to it, and heading for a strong breakout and retest.
We have a bearish trend on the RSI indicator that is about to be broken and retested, which supports the upward move.
There is a major support area in green at 0.3306, which represents a strong support point.
We are heading for consolidation above the 100 moving average.
Entry price: 0.4168
First target: 0.3473
Second target: 0.3580
Third target: 0.7300
Don't forget a simple matter: capital management.
When you reach the first target, save some money and then change your stop-loss order to an entry order.
For inquiries, please leave a comment.
Thank you.

#ALICE/USDT#ALICE
The price is moving within a descending channel on the 1-hour frame, adhering well to it, and is heading for a strong breakout and retest.
We have a bearish trend on the RSI indicator that is about to be broken and retested, which supports the upward breakout.
There is a major support area in green at 0.3500, which represents a strong support point.
We are heading for stability above the 100 moving average.
Entry price: 0.3849
First target: 0.3989
Second target: 0.4097
Third target: 0.4234
Don't forget a simple matter: capital management.
When you reach the first target, save some money and then change your stop-loss order to an entry order.
For inquiries, please leave a comment.
Thank you.

ALICEUSDT Forming Falling WedgeALICEUSDT is showing a strong technical setup with the formation of a falling wedge pattern, a structure that often precedes a bullish breakout. After a prolonged consolidation phase, price action suggests that sellers are losing momentum, and buyers are gradually stepping back in. This pattern typically indicates a potential trend reversal, with the market preparing for an upward move once a clean breakout above the resistance line occurs.
Trading volume is currently healthy, signaling active participation and growing investor interest in ALICE. The combination of increasing volume and narrowing price action points to an upcoming volatility surge that could lead to a 60% to 70%+ price gain once the breakout is confirmed. The wedge’s lower boundary has been tested multiple times, showing strong support and reinforcing the bullish outlook.
Investor confidence in ALICEUSDT appears to be building as the project gains attention among mid-cap altcoins with solid fundamentals and growing community support. If buying pressure continues to increase around key support zones, ALICE could initiate a significant bullish rally, potentially targeting higher resistance levels in the near term.
✅ Show your support by hitting the like button and
✅ Leaving a comment below! (What is You opinion about this Coin)
Your feedback and engagement keep me inspired to share more insightful market analysis with you!

ALICEUSDT UPDATE#ALICE
UPDATE
ALICE Technical Setup
Pattern: Bullish falling wedge pattern
Current Price: $0.92
Target Price: $1.45
Target % Gain: 75.61%
$ALICE is breaking out of a falling wedge pattern on the 1D timeframe. Current price is $0.92 with a target near $1.45, showing about 57% potential upside. The breakout indicates strong bullish momentum, with price action favoring continuation if support holds. Always use proper risk management.
Time Frame: 1D
Risk Management Tip: Always use proper risk management.

#ALICE /USDT — Descending Triangle at Demand Zone!
#ALICE
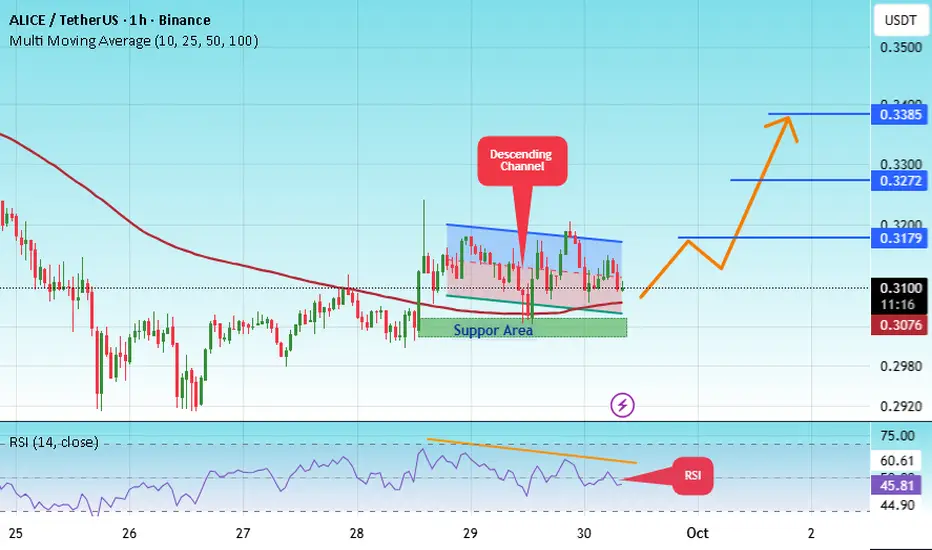
The price is moving within a descending channel on the 1-hour frame, adhering well to it, and is heading for a strong breakout and retest.
We have a bearish trend on the RSI indicator that is about to be broken and retested, which supports the upward breakout.
There is a major support area in green at 0.3040, which represents a strong support point.
We are heading for consolidation above the 100 moving average.
Entry price: 0.3070
First target: 0.3180
Second target: 0.3272
Third target: 0.3385
Don't forget a simple matter: capital management.
When you reach the first target, save some money and then change your stop-loss order to an entry order.
For inquiries, please leave a comment.
Thank you.
#ALICE/USDT — Descending Triangle at Demand Zone!#ALICE
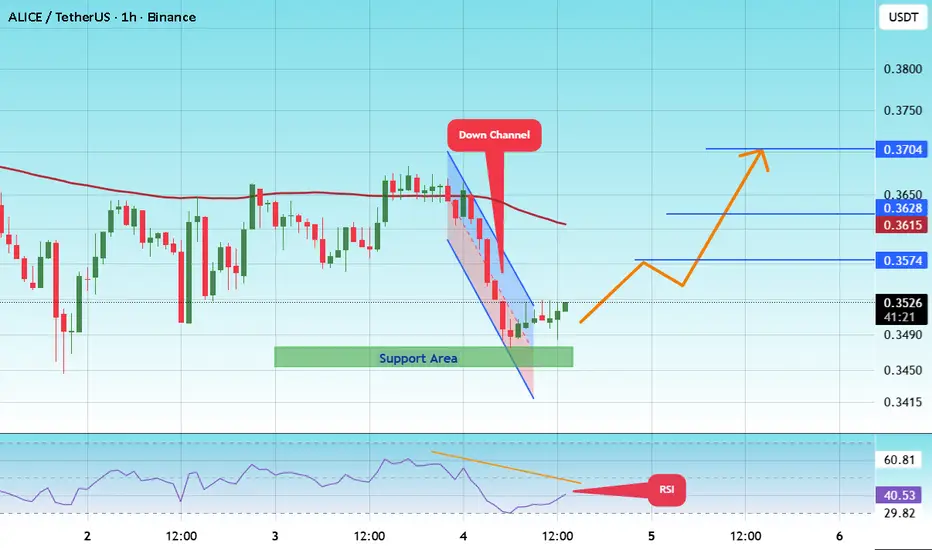
The price is moving within a descending channel on the 1-hour frame and is expected to break and continue upward.
We have a trend to stabilize above the 100 moving average once again.
We have a downtrend on the RSI indicator that supports the upward move with a breakout.
We have a support area at the lower boundary of the channel at 0.3430, acting as strong support from which the price can rebound.
We have a major support area in green that pushed the price upward at 0.3470.
Entry price: 0.3520
First target: 0.3574
Second target: 0.3628
Third target: 0.3700
To manage risk, don't forget stop loss and capital management.
When you reach the first target, save some profits and then change the stop order to an entry order.
For inquiries, please comment.
Thank you.
#ALICE/USDT Ready to go higher !#ALICE
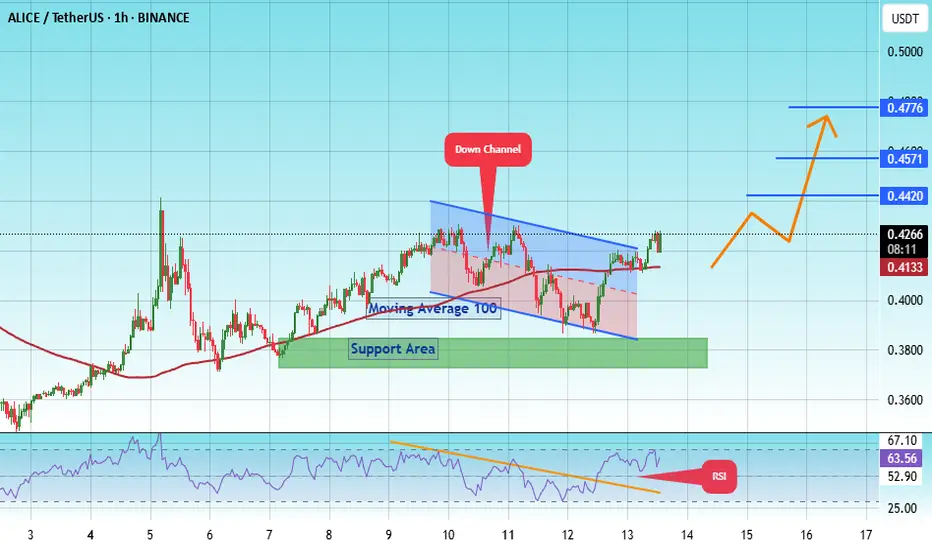
The price is moving within an ascending channel on the 1-hour frame, adhering well to it, and is on track to break it strongly upwards and retest it.
We have support from the lower boundary of the ascending channel, at 3888.
We have a downtrend on the RSI indicator that is about to break and retest, supporting the upside.
There is a major support area in green at 0.3777, which represents a strong basis for the upside.
Don't forget a simple thing: ease and capital.
When you reach the first target, save some money and then change your stop-loss order to an entry order.
For inquiries, please leave a comment.
We have a trend to hold above the 100 Moving Average.
Entry price: 0.4250
First target: 0.4420
Second target: 0.4571
Third target: 0.4776
Don't forget a simple thing: ease and capital.
When you reach the first target, save some money and then change your stop-loss order to an entry order.
For inquiries, please leave a comment.
Thank you.
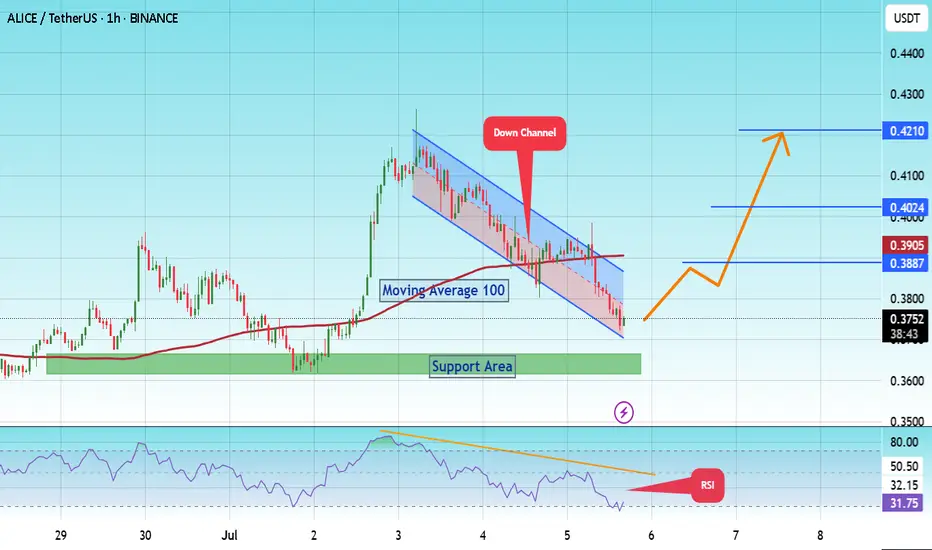
#ALICE/USDT Ready to go higher#ALICE
The price is moving within a descending channel on the 1-hour frame and is expected to break and continue upward.
We have a trend to stabilize above the 100 moving average once again.
We have a downtrend on the RSI indicator that supports the upward break.
We have a support area at the lower boundary of the channel at 0.3700, acting as strong support from which the price can rebound.
We have a major support area in green that pushed the price higher at 0.3632.
Entry price: 0.3753.
First target: 0.3887.
Second target: 0.4024.
Third target: 0.4210.
To manage risk, don't forget stop loss and capital management.
When you reach the first target, save some profits and then change the stop order to an entry order.
For inquiries, please comment.
Thank you.
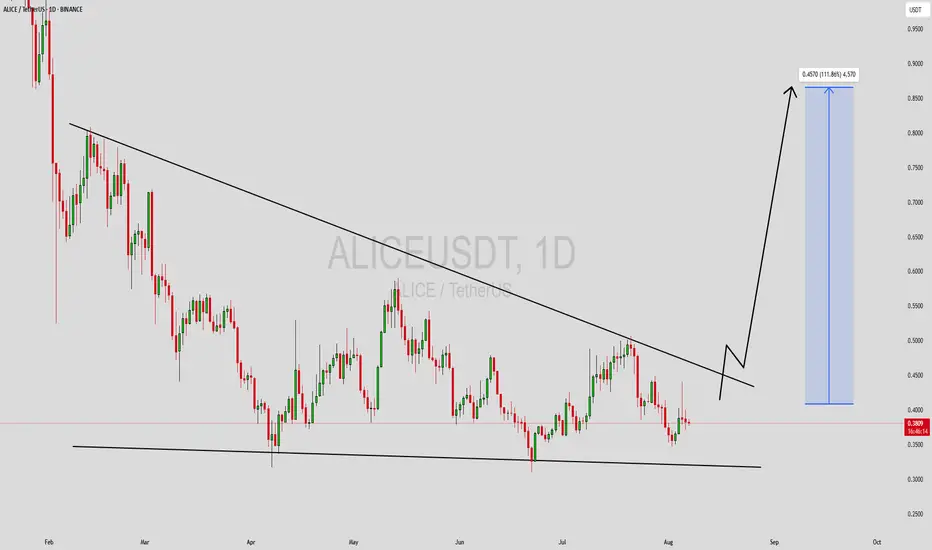
ALICEUSDT Forming Descending ChannelALICEUSDT is currently trading within a descending channel pattern, a classic technical structure that often precedes a significant bullish reversal. This pattern forms when price action is contained between two downward-sloping parallel lines, signaling a gradual downtrend. However, these channels are known to break to the upside once bearish momentum weakens and buying interest returns. With ALICEUSDT showing good volume and healthy investor attention, the conditions are aligning for a potential breakout.
Descending channels are closely monitored by technical traders due to their strong risk-to-reward setup. ALICE is currently near the lower boundary of the channel, offering an ideal entry point for those anticipating a reversal. If the price manages to break out from the upper trendline with volume confirmation, we could see a sharp rally toward the projected gain range of 90% to 100% or even higher. Historical price behavior and market structure further strengthen this bullish outlook.
Investor sentiment around ALICEUSDT is building steadily, fueled by renewed interest in metaverse and blockchain gaming projects. As more investors take note of the technical setup and potential gains, we may see increased participation, driving momentum further. Technical indicators such as RSI and MACD are also showing signs of potential divergence, often seen before breakout moves.
Given the strong pattern formation, growing volume, and market interest, ALICEUSDT stands as a high-potential candidate for the coming weeks. Traders should keep an eye on key resistance levels and volume surges as potential breakout confirmation signals.
✅ Show your support by hitting the like button and
✅ Leaving a comment below! (What is You opinion about this Coin)
Your feedback and engagement keep me inspired to share more insightful market analysis with you!
#ALICE/USDT#ALICE
The price is moving within a descending channel on the 1-hour frame, adhering well to it, and is on its way to breaking it strongly upwards and retesting it.
We are seeing a bounce from the lower boundary of the descending channel, which is support at 0.4560.
We have a downtrend on the RSI indicator that is about to break and retest, supporting the upward trend.
We are looking for stability above the 100 moving average.
Entry price: 0.4835
First target: 0.5028
Second target: 0.5263
Third target: 0.5533

ALICE Looks Bearish (4H)The ALICE structure is bearish. It has been rejected from premium zones and a bearish internal CHoCH has also formed.
A move from the identified supply zone toward the demand zone is expected.
A daily candle close above the invalidation level would invalidate this analysis.
Do not enter the position without capital management and stop setting
Comment if you have any questions
thank you

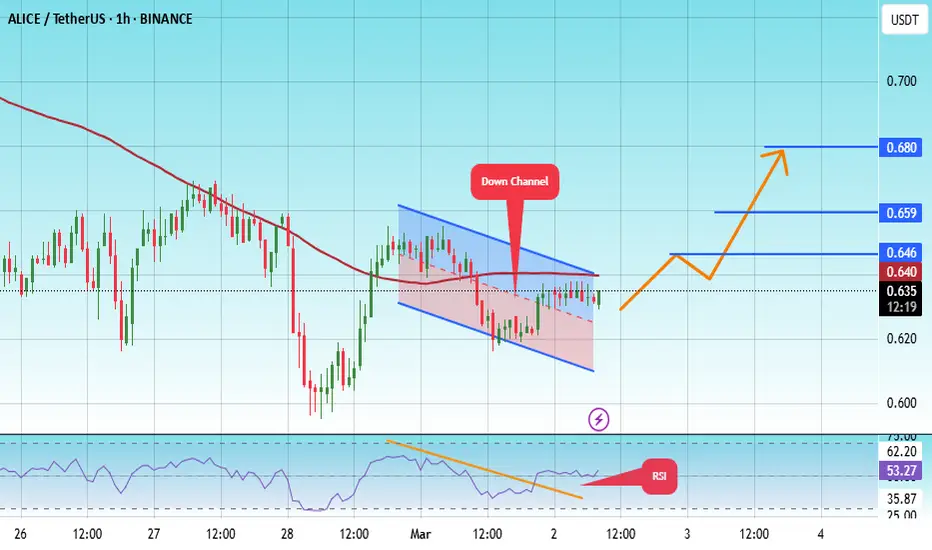
#ALICE/USDT#ALICE
The price is moving in a descending channel on the 1-hour frame and is adhering to it well and is heading to break it strongly upwards and retest it
We have a bounce from the lower limit of the descending channel, this support is at a price of 0.615
We have a downtrend on the RSI indicator that is about to break and retest, which supports the rise
We have a trend to stabilize above the moving average 100
Entry price 0635
First target 0.646
Second target 0.660
Third target 0.680
#ALICE/USDT Ready to go higher#ALICE
The price is moving in a descending channel on the 1-hour frame and sticking to it well
We have a bounce from the lower limit of the descending channel, this support is at 1.08
We have a downtrend on the RSI indicator that is about to break, which supports the rise
We have a trend to stabilize above the moving average 100
Entry price 1.18
First target 1.22
Second target 1.264
Third target 1.325

#ALICE/USDT#ALICE
The price is moving in a bearish channel on a 4-hour frame and is holding it strongly and is about to break it upward
We have a bounce from the green support area at 1.10
We have a tendency to stabilize above the Moving Average 100
We have a downtrend on the RSI indicator that is about to break higher and supports the rise
Entry price 1.26
The first goal is 1.57
Second goal 1.91
Third goal 2.32

#ALICE/USDT#ALICE
We have a bearish channel on a 4-hour frame,
the price moves within it and adheres to its limits well
We have a major support area at Saad 1.0
We have a tendency to stabilize above moving average 100
We have a downtrend on the RSI indicator that has been broken to the upside
Entry price is 1.19
The first goal is 1.44
Second goal 1.79
Third goal 2.20

#ALICE/USDT#ALICE
The price has been moving in a bearish flag since April 2022
We are now on the verge of breaking that pattern by breaking the downtrend
Supported by oversold on MACD
Current price 1.030
First goal 1.18
Second goal 1.255
The rise will be supported by the break of Moving Average 100
You must pay attention to the correction points on the chart

#ALICE/USDT LONG#ALICE
The price has been moving in a bearish flag since April 2022
This pattern was broken by breaking the downtrend
Supported by my sell saturation on the MACD on a daily frame
Current price 1.18
First goal 1.79
Second goal 2.25
The rise is supported by the moving average 100 break of
We have a lot of bullishness in Bitcoin

ALICE ANALYSIS (1D)I must honestly say that we are not ALICE buyers here. You can buy for wave G on the green zone.
We expect another bottom to complete the G wave and finally the big B wave. As the price reaches the green range, ALICE's 2-year corrective diametric can be finished and we can enter the rising wave.
For risk management, please don't forget stop loss and capital management
Comment if you have any questions
Thank You

Alice Forming Bulish Pennant Formed Bulish Pennant In h4 Timeframe
Incase Of breakout expecting 25 to 30% bulish Move
Seems Like Alice Is ready For Continuation
Keep Eyes Alice For breakout

