ALICEUSDT. LONGTERM targetALICEUSDT weekly chart. This is what i see.
Alice's pullback is likely printed a right shoulder .
to make a huge ihns pattern (inverse head and shoulder).
It'll be a shaky climb. But holding it for a longterm, i think it's a good investment / good buy right now.
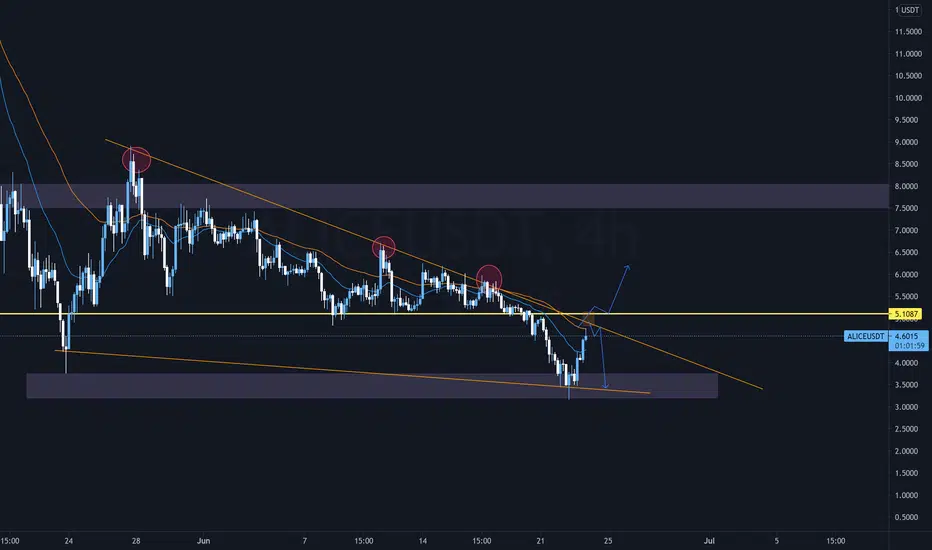
if you look closely at 4H timeframe . ALICEUSDT is having a bullish divergence .
so i think. this is an opportunity to accumulate.
target will follow the arrow.
waddya think?
*not financial advice
ALICEBUSD

Alice possible breakout? 4TFA close above triangle and $18.8 may confirm trend reversal.
MACD on 4 hr looking bullish as well.
TP targets based on fibs.
As always DYOR, NFA , just an idea.

Aliceusd dailyin this chart we can see the weaakness in uptrend and blockage the bull by static resistance and top side of price channel, so downtrend is more possible and after getting more energy the next uptrend can bee predicted.....

ALICE/USDT (Testing Daily Resistance Area)💎Technical Analysis Summary💎
ALICE/USDT
-The daily resistance level is being tested
-If ALICE can hold above the resistance area
-And form any bullish continuation pattern
-The Fib extensions are the potential upside targets
-Since this is an ATH gameplay the sky is full of potentials
-Good luck everyone and please manage your risk
⚠️Please always read the description⚠️
Thanks for donating 💰 via Tradingview coins bitcoinpam 🙏🎉
``````````````````````````````````````````````
If you need help🙋 don't hesitate to
Send me a message here PolarHusk 😊
``````````````````````````````````````````````
Trading Involves High Risk ⚠️
Not Financial Advice 💸
Exercise Proper Risk Management 💱
``````````````````````````````````````````````

alice to the moonits good for buy.....
buy in 12-13
tp1 14
tp2 15
tp3 16
tp4 17
... 19
sell no = hodl

ALICEUSDT Breakout ImminentALICE has possibly formed a symmetrical triangle which is a continuation pattern.
In this case, it has more chance to breakout to the upside.
My very hopeful target is 18.6 which give nearly 35% gains, and my alternative target is 16.1202(0.786fib).

Alice updateMarket Cap $235,349,287
24 Hour Trading Vol $124,798,899
Fully Diluted Valuation $1,352,582,108
Circulating Supply 17,400,000
Total Supply 100,000,000
Max Supply 100,000,000
Non-Fungible Tokens (NFT)


ALICE/USDT BINANCEALICE/USDT BINANCE
4H hollow candlesticks.
Price breakout at the end of asymmetric triangles.
Steady volume.
MACD shows a sideways movement.
MyNeighborAlice Price (ALICE) = $6.30 -12.83%
0.0001698 BTC -8.56%
0.002321 ETH -8.99%
Good Luck
CryptoHellas Team

ALICEBUSD (ALICE) - BULLISH SETUP ANALYSIS 🔎
- There's a potential formation of the bullish inverse head and shoulders (IH&S) pattern.
- Price hit a swing high and retraced (right shoulder formation).
- Price is testing the horizontal support level (S1) and the key fibonacci retracement zone (0.5 - 0.618 - 0.786).
- There's a relatively high concentration of buyers at this zone.
- The minor retracement at the right shoulder is resisted by the descending trendline resistance.
- Breakout above the descending trendline resistance could lead to the test of inverse head and shoulders neckline resistance (complete formation of the inverse head and shoulders pattern).
- Further breakout above the inverse head and shoulders neckline resistance could be a bullish confirmation.
BUY ENTRY ⬆️
- Breakout above the descending trendline resistance.
- Retest of the descending trendline resistance after the breakout.
TARGETS 🎯
- Horizontal resistance level (R1).
- Neckline resistance (NR).
- Fibonacci extension levels.
SETUP INVALIDATION ❌
- Initial invalidation : breakdown below 0.786 fibonacci retracement level.
- Final invalidation : breakdown below previous swing low horizontal support level (S2).


💡 ALICE/USDT💡 Hello everyone, if you like my idea, follow me with likes and comments, I will also try to share the best ideas with you, Always do your own research before opening positions and always put stop limit.

ALICE is a good NFT play to go back above $14+Bithumb has finished its listing pump and dump. Now it is time for the Koreans to buy it all back up. Kimchi premiums please.

ALICEBUSD (ALICE) - BULLISH SETUP ANALYSIS 🔎
- ALICEBUSD brokeout above the double bottom (DB) neckline resistance (NR).
- The market hit a swing high and retraced.
- Price is retesting the neckline resistance (NR) and key fibonacci retracement zone (0.5 - 0.618 - 0.786).
- There is a relatively high concentration of buyers at the retest zone (High buying pressure).
- The retracement is resisted by the descending trendline resistance (DTR).
- A breakout above the descending trendline resistance (DTR) could be a bullish signal.
BUY ENTRY ⬆️
- Breakout above the descending trendline resistance (DTR).
TARGETS 🎯
- Horizontal resistance level (R1).
- Horizontal resistance level (R2).
- Horizontal resistance level (R3).
- Fibonacci extension levels.
SETUP INVALIDATION ❌
- Breakdown below the 0.786 fibonacci retracement level.


ALICEBUSD (ALICE) - POTENTIAL BUY ENTRY ANALYSIS 🔎
- ALICEBUSD brokeout above the double bottom (DB) neckline resistance (NR).
- The market hit a swing high and retraced.
- Price is retesting the neckline resistance (NR) and key fibonacci retracement zone (0.5 - 0.618 - 0.786).
- There is a relatively high concentration of buyers at the retest zone (High buying pressure).
- The retracement is resisted by the descending trendline resistance (DTR).
- A breakout above the descending trendline resistance (DTR) could be a bullish signal.
BUY ENTRY ⬆️
- Breakout above the descending trendline resistance (DTR) and the horizontal resistance level (R1).
TARGETS 🎯
- Horizontal resistance level (R2).
- Horizontal resistance level (R3).
- Fibonacci extension levels.
SETUP INVALIDATION ❌
- Breakdown below the 0.786 fibonacci retracement level.

💡 ALICE/USDT💡 Hello everyone, if you like my idea, follow me with likes and comments, I will also try to share the best ideas with you, Always do your own research before opening positions and always put stop limit.

ALICE/BUSD BINANCEALICE/BUSD BINANCE
30' hollow candlesticks.
After Binance Launchpad public token sale a huge dump followed.
Still too early for TA, but there are a few things to say about this project.
We have a strong support level of 13$.
The bar pattern shows possible movement for the next hours.
Multiple support and resistance levels shown as horizontal lines.
High volume.
At the current price, we have a nice entry point, with huge potential.
MyNeighborAlice Price (ALICE) = $13.64 -10.39%
0.0002379 BTC7.21%
0.007621 ETH6.95%
Good Luck
CryptoHellas Team
