ALICE update.we structuring right now minor 2nd wave , probably will be a zigag.
touching (y) bottom will invalid this chart, and we have to recount after.
SL is 10.48
we might get extended impulsive waves due the 1-2 1-2 .
Its open for discussion.
I see great potential in this chart.
ALICEUSD

$ALICEInvalidation point is given on red
(iv) and (v)
are not accurate till wave (iii) is completed.


ALICE loading up for a massive move soon! Here's a quick Look at ALICE daily chart. As we can see, the price has been forming a bigger falling wedge and we could see a break to the upside soon! Definitely one to keep an eye on.
The best entry would be, when the price breaks above the falling wedge with good amount of volume .
-------------------------------------------
The idea is: Buy the breakout from the falling wedge and take profits at the levels shown in the chart.
Targets:
- Profits can be taken in the resistance zone .
1. 13.35$
2. 17.2$
3. 19.2$
-------------------------------------------
If you like the content, then make sure to comment and like the post :D
Follow me for daily profitable trading setups
BTC dictates the market. If BTC falls, then Alts will fall as well. Trade safe!

💥ALICE LIKELY MOVE - RISE TO $14.80 OR FALL TO $10.13Please support this idea with a LIKE👍 if you find it useful🥳
We have too falling wedge pattern shown on this chart. As seen here, price broke the the first wedge upward and got into the another he wedge and it's currently making effort to break out of the current falling wedge.
Therefore, if the current support trendline holds, price is expected to go long as o $14.80 but if it fails, it's going to fall to $10.13.
What do you think?
Share your opinion in the comment section✍️
Follow me to receive more updates on ALICE (ALICEUSDT) 🤗
Happy Trading💰🥳🤗

ALICEUSDTBINANCE:ALICEUSDT
We can see a formation of head and shoulders but at the same time a harmonic pattern on shorter TF that could be an opportunity for shorting before it goes back up to the major resistance level.
Manager your risk.


ALICE ALICEUSD myneighboralice ALICE ANALYSIS BASED ON NOEWAVE
myneighboralice
ALICE ANALYSIS BASED ON NOEWAVE
myneighboralice
ALICE ANALYSIS BASED ON NOEWAVE
myneighboralice
ALICE ANALYSIS BASED ON NOEWAVE
myneighboralice
ALICE ANALYSIS BASED ON NOEWAVE
myneighboralice
ALICE ANALYSIS BASED ON NOEWAVE
myneighboralice


A Reverse Head and ShouldersHi traders,
ALICEUSDT may follow a reverse Head and Shoulders formation. I've drawn all key points. In my opinion, the price may follow the orange path. Of course, it is totally dependent to the market.
The orange circle seems to created in order to hunt stops around that area, which is a good indicator for me to distinguish bullish price pattern.
Stay safe.

ALICE will hit $40 in December?While the altcoin market is red, it doesn't make much sense to watch the price.
I tried analyzing time frames and price movements to forecast Alice. One of my favorite altcoins!
During the course of the price, there may be a trend to continue or reverse. However, prices still tend to repeat the story of the past.
So I try to imagine the price path in Q4.
And expect the price to drop to $40 before Christmas!
Alice has a solid foundation, and is a hot game in the future. I think so. So on the length of time I believe the price of Alice will go even further. For the time being, I expect the price to return to 40% only!

Another buy on $AliceAfter reaching the target of the previous buy, Alice has now formed an QM pattern that provides us with a great buy opportunity.

Alice going down, but...Hi everyone,
Alice break the neckline and now price is dropping.
Due to the upcoming lottery, the demand for buying X will increase and it is possible to buy in terms of holding and participating in the lottery within the specified ranges.

ALICE , Two Inverse Head And Shoulders ! 200% Gain Long-Term?hey yall ! ( read the description !!!)
so here we are with ALICE , it is making an inverse head and shoulders pattern . we have a strong resistance line on the way , it's from the ATH . target is also shown in the chart .
BUT , the pattern is not confirmed yet . WHEN should we get in ? WHAT is our confirmation here ?
wait for the price to get to the neckline . if it did, and it also went upper than the neckline then it's time to BUY .
that's it BUT
the analysis isn't over yet , wanna see something crazy ? take a look at this pic and tell me what else you see :
didn't notice anything ? it's ok , cuz now you will :
:D
yep , bigger inverse head and shoulders ! it's being made for seven months !
now , still we are not sure about that until it gets confirmed , and I told you how is the confirmation . price has to go upper than the neckline.
if that happened , we will have this :
targets and everything is on the chart.
if you liked the idea , give it a like .
and if you wanna see more of these , follow , heck of analysis are on the way !
also tell me your opinions on this idea in the comments .
GoOOoOd LuUuUUuck

nothing interstingjust for fun
only want to test system
so im typing this part just to pass the error and you can ignore it
and not wasting your time

ALICEUSDT: Massive Gains in Upcoming WeeksAlice closed strong bullish candle on weekly timeframe . i m personally holding this GEM ..i m expecting in in next 2 months target 1 and 2 will be achieved.

ALICE/USDTI see the inverted head and shoulders pattern in this chart.My targets are:
tp1:20$
tp2:30$
tp3:45$
tp4:60$

Alice watch out for small breakoutIn recent pump of AXIE. alice will most likely to follow it!
It is a strict setup with strict stoploss, must exit if triggered SL
Cheers🥂

ALICEUSDT | Long/buyMy Argument
1. Correction Wave 5 is over.
2. divergence will happen on RSI For near future,
3. Golden area of Fibonacci
4. Wait until the candle break resistance trendline
for me, I think I will entry on the reversal area with small size and then when everything becomes clear I will increase my size.
two type entry position

ShortHello friends, it seems that Alice will fall in price again when she hits her downward trend line, but we can wait for $ 10 to consider the trading position of the shorts if the break is fixed until the specified range.

Alice / USDT Long Alice about to enter in a good entry zone. Next rally could hit $25.
Keep following for the updates

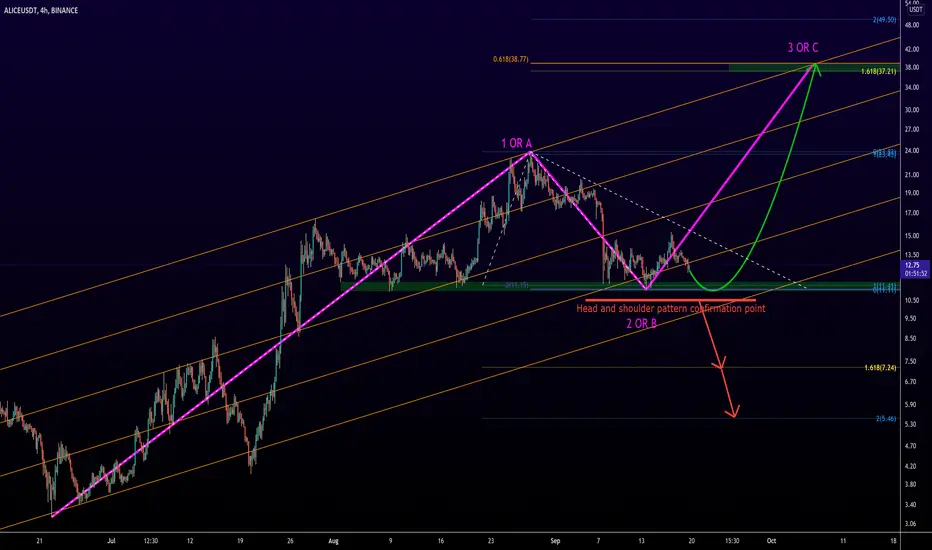
#ALICE 4H ANALYSIS#ALICE 4H ANALYSIS
Depending on the movement channel as well as the correction made, the price can be expected to rise to at least $ 37.
The upside of this uptrend is around $ 10.5.
A very important point about this loss limit is that if the loss limit is activated, we will have an approved head and shoulder pattern that can lead to a price drop to the range of $ 5.5-7.5.
ALICE , what to do ?hallo everyone .
there are 4 possible scenarios :
number 1 :
price consolidating in this range , either it breaks the top or the bottom of the channel.
number 2 :
the price breaks the local resistance and MA50 , rises to the strong resistance , comes back down will be in this range.
number 3 :
price breaks both resistances , and reaches the target of 161.80% Fibonacci which is 38 $.
number 4 :
price after consolidating in this range , will break the support and fall to the green line.
after all , in my opinion , it's more likely to break the local resistance in the following days and pump to the strong resistance , that time we'll decide either it goes down again or breaks the strong resistance ...
I'll keep y'all updated .
don't forget to hit the like !
