Alphabet - This rally will soon be over!🪦Alphabet ( NASDAQ:GOOG ) will end its rally soon:
🔎Analysis summary:
Starting back in 2025, Alphabet created a major bullish break and retest. Following this behavior, we witnessed an expected strong rally of about +120%. But with the current retest of the upper resistance trendline, Alphabet will soon create a healthy retracement.
📝Levels to watch:
$300
SwingTraderPhil
SwingTrading.Simplified. | Investing.Simplified. | #LONGTERMVISION
Alphabetsignals

Alphabet’s to Invest $6 Billion in Germany as Stock Eyes $300Alphabet Inc. (NASDAQ: GOOGL) surged to new highs this week as reports surfaced that Google plans to invest approximately €5 billion ($5.8 billion) in Germany to expand its data center and infrastructure footprint. According to sources cited by Reuters, the plan includes the construction of a new data center in Dietzenbach, near Frankfurt, and the expansion of an existing facility in Hanau. Both projects reinforce Google’s growing commitment to Europe’s largest economy and its long-term push toward artificial intelligence and climate-neutral innovation.
The investment marks one of Google’s most significant in Europe, aligning with its broader strategy to enhance data processing power and sustainability. A press conference is scheduled for Tuesday, where German Finance Minister Lars Klingbeil is expected to provide additional details. Analysts view this expansion as a strong signal of confidence in Europe’s digital economy and AI-driven transformation.
On the technical front, Google’s stock has been on a powerful uptrend, recently reaching around $290 after breaking through long-term resistance. The bullish momentum shows little sign of slowing, with traders eyeing the key psychological level of $300 as the next major target.
Volume and trend structure remain supportive, with an ascending trendline acting as a potential area of support in case of a retracement. A bounce from that region could further fuel continuation toward fresh record highs.
With strong fundamentals backed by a major European investment and a bullish technical setup, Google appears poised to extend its rally. Investors will be watching whether this momentum can push GOOGL beyond $300, a move that could signal the next chapter of growth for one of the world’s leading tech giants.

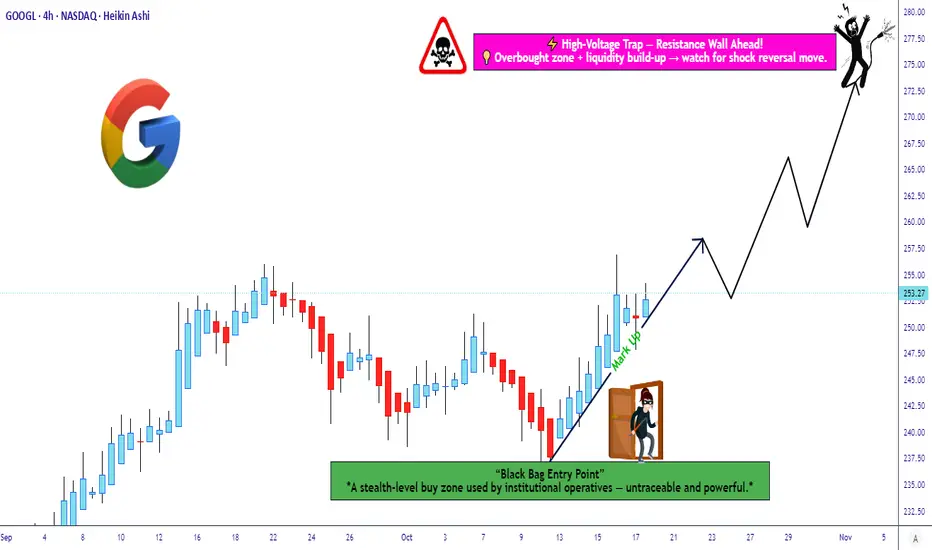
Is This the Perfect Entry Zone for the Next GOOGL Upside Run?🎯 GOOGL: The "Thief's Heist" Trading Strategy | Layered Entry Playbook 📊
💼 Asset: ALPHABET INC. (GOOGL)
Market: NASDAQ | Style: Swing/Day Trade Hybrid
🎭 The Setup: Bulls Running the Show
Bias: 🟢 BULLISH
Listen up, trading family! 👋 GOOGL is setting up what I call the "Thief's Entry Strategy" - a layered approach that lets you accumulate positions like a professional poker player stacking chips. No FOMO, no chasing - just calculated, methodical entries that would make Ocean's Eleven jealous. 🎰
🚪 Entry Strategy: The "Thief Layering" Method
Instead of going all-in at one price (rookie move 🙅♂️), we're using multiple limit orders to build our position:
📍 Layered Buy Limits:
Layer 1: $240.00
Layer 2: $245.00
Layer 3: $250.00
💡 Pro Tip: You can add more layers or adjust levels based on your risk appetite and account size. This method reduces average cost and minimizes timing risk - basically, you're stealing better prices while everyone else panic-buys at the top! 😎
Alternative: If you prefer simplicity, current market price entry works too - but where's the fun in that? 🤷♂️
🛡️ Risk Management: The "Escape Route"
Stop Loss: $235.00
⚠️ Reality Check: Dear Thief OG's (Original Gangsters of Trading), this is MY stop loss level based on technical structure. YOU need to assess your own risk tolerance, position size, and account management rules. Your money = your rules. Trade at your own risk, always! 🎲
🎯 Target Zone: The "Electric Fence"
Take Profit: $275.00
This level represents a confluence of:
⚡ Strong resistance zone (high voltage wall!)
📈 Potential overbought conditions
Bull trap territory where late buyers get caught
Strategy: Scale out as we approach target. Don't be greedy - banks get robbed, but smart thieves get away clean! 💰
⚠️ Reality Check #2: This is MY target. You might want to take profits earlier, hold for more, or scale out in portions. Your trading plan, your decision. Secure the bag at your own discretion! 💼
🔗 Related Pairs to Watch (Correlation Play)
Keep your eyes on these tech titans - they often move in sympathy:
NASDAQ:MSFT - Microsoft Corp | Big tech correlation, AI play
NASDAQ:AAPL - Apple Inc. | FAANG/tech sector leader
NASDAQ:META - Meta Platforms | Ad revenue correlation with GOOGL
NASDAQ:NVDA - NVIDIA | AI infrastructure play
NASDAQ:QQQ - Nasdaq 100 ETF | Overall tech sector health indicator
Why it matters: If these pairs show weakness, GOOGL might follow. If they're pumping, wind's at our back! 🌊
📊 Key Technical Points
✅ Support holding at current structure
✅ Bullish momentum building on lower timeframes
✅ Risk-reward ratio favorable with layered entries
✅ Volume profile suggesting accumulation phase
🎬 The "Thief Style" Philosophy
This isn't financial advice - it's a trading game plan based on technical analysis and strategic positioning. The "Thief" approach means:
Stealth entries (layering in)
🧠 Smart exits (not overstaying the party)
🎯 Calculated risk (always know your out)
🎪 Having fun while staying professional
📉 Trading involves substantial risk of loss and is not suitable for everyone. Past performance is not indicative of future results.
✨ If you find value in my analysis, a 👍 and 🚀 boost is much appreciated — it helps me share more setups with the community!
🏷️ Tags:
#GOOGL #Alphabet #StockMarket #SwingTrading #DayTrading #TradingStrategy #TechnicalAnalysis #StockAnalysis #NASDAQ #TechStocks #LayeredEntry #RiskManagement #TradingIdeas #PriceAction #SupportAndResistance #ThiefStrategy #FAANG
Trade smart, stay safe, and remember: the market doesn't care about your feelings - only your strategy matters! 🎯💪
Alphabet - The textbook break and retest!📧Alphabet ( NASDAQ:GOOGL ) will head much higher:
🔎Analysis summary:
If we look at the chart of Alphabet we can basically only see green lines. And despite the recent correction of about -30%, Alphabet remains in a very bullish market. Looking at the recent all time high break and retest, there is a chance that we will see new all time highs soon.
📝Levels to watch:
$200
🙏🏻#LONGTERMVISION
Philip - Swing Trader

Alphabet(Google) Long BullishTechnical Bullish
HHHL above 99
Trendomat BuySell pressure Bullish
Weekly average price above Monthly average price
145.32 is critical as Volume value is weak.
Incase volume would increase and abreak above 151
Alphabet will potentially walk to above 210
A break below 86 is bearish.
Return vs Industry: GOOGL underperformed the US Interactive Media and Services industry which returned 22.5% over the past year.
Return vs Market: GOOGL underperformed the US Market which returned 14.5% over the past year.
Stable Share Price: GOOGL is less volatile than 75% of US stocks over the past 3 months, typically moving +/- 4% a week.
Volatility Over Time: GOOGL's weekly volatility (4%) has been stable over the past year.
Price-To-Earnings vs Peers: GOOGL is good value based on its Price-To-Earnings Ratio (26.7x) compared to the peer average (51x).
Price-To-Earnings vs Industry: GOOGL is expensive based on its Price-To-Earnings Ratio (26.7x) compared to the US Interactive Media and Services industry average (19.9x)
What is the Fair Price of GOOGL when looking at its future cash flows? For this estimate we use a Discounted Cash Flow model.
Below Fair Value: GOOGL ($123.1) is trading below our estimate of fair value ($160.36)
Significantly Below Fair Value: GOOGL is trading below fair value by more than 20%.
Alphabet is forecasted to grow earnings and revenue by 13.1% and 9% per annum respectively. EPS is expected to grow by 14.6%. Return on equity is forecast to be 22.3% in 3 years.
Analyst Future Growth Forecasts
Earnings vs Savings Rate: GOOGL's forecast earnings growth (13.1% per year) is above the savings rate (2.1%).
Earnings vs Market: GOOGL's earnings (13.1% per year) are forecast to grow slower than the US market (15.7% per year).
High Growth Earnings: GOOGL's earnings are forecast to grow, but not significantly.
Revenue vs Market: GOOGL's revenue (9% per year) is forecast to grow faster than the US market (7.5% per year).
High Growth Revenue: GOOGL's revenue (9% per year) is forecast to grow slower than 20% per year.
Future ROE: GOOGL's Return on Equity is forecast to be high in 3 years time (22.3%)
Earnings and Revenue History
Quality Earnings: GOOGL has high quality earnings.
Growing Profit Margin: GOOGL's current net profit margins (20.6%) are lower than last year (27.6%).
Earnings Trend: GOOGL's earnings have grown significantly by 25.9% per year over the past 5 years.
Accelerating Growth: GOOGL's has had negative earnings growth over the past year, so it can't be compared to its 5-year average.
Earnings vs Industry: GOOGL had negative earnings growth (-21.4%) over the past year, making it difficult to compare to the Interactive Media and Services industry average (-16.9%).
High ROE: GOOGL's Return on Equity (22.5%) is considered high.
Financial Position Analysis
Short Term Liabilities: GOOGL's short term assets ($162.0B) exceed its short term liabilities ($68.9B).
Long Term Liabilities: GOOGL's short term assets ($162.0B) exceed its long term liabilities ($39.7B).
Debt to Equity History and Analysis
Debt Level: GOOGL has more cash than its total debt.
Reducing Debt: GOOGL's debt to equity ratio has increased from 3.3% to 4.5% over the past 5 years.
Debt Coverage: GOOGL's debt is well covered by operating cash flow (757.9%).
Interest Coverage: GOOGL earns more interest than it pays, so coverage of interest payments is not a concern.
CEO Compensation Analysis
Compensation vs Market: Sundar's total compensation ($USD225.99M) is above average for companies of similar size in the US market ($USD12.23M).
Compensation vs Earnings: Sundar's compensation has increased by more than 20% whilst company earnings have fallen more than 20% in the past year.
Insider Buying: Insufficient data to determine if insiders have bought more shares than they have sold in the past 3 months.

Google -> Finally The BottomHello Traders,
welcome to this free and educational multi-timeframe technical analysis .
On the weekly timeframe you can see that Google stock just recently perfectly broke above and is now retesting a major previous weekly structure area which is now turned support at the HKEX:104 level.
You can also see that weekly market structure is now bullish, moving averages are also bullish and the recent price action on Alphabet stock just looks like a solid bottom formation so I simply do expect more continuation towards the upside from the current levels.
On the daily timeframe you can see that market structure is about to shift bearish so I am now just waiting for a clear bullish impulse and break above the daily HKEX:107 resistance before I then do expect more continuation towards the upside.
Thank you for watching and I will see you tomorrow!
You can also check out my previous analysis of this asset:


Google -> The Stock Is BackHello Traders,
welcome to this free and educational multi-timeframe technical analysis .
On the weekly timeframe you can see that Google stock has been trading in a range for quite some time now, you can also see that the upper resistance of this trading range is exactly at $105.
You can also see that we are currently again retesting this resistance area, from a weekly perspective the market seems definitely ready for a breakout so I think that this time Google stock will actually break above this key resistance area.
On the daily timeframe I am now just waiting for a breakout above this resistance area and if we then get a retest and bullish confirmation, it is quite likely that from there we will then see more continuation towards the upside.
Thank you for watching and I will see you tomorrow!
You can also check out my previous analysis of this asset:

Google Analysis 22.01.2023Hello Traders,
welcome to this free and educational analysis.
I am going to explain where I think this asset is going to go over the next few days and weeks and where I would look for trading opportunities.
If you have any questions or suggestions which asset I should analyse tomorrow, please leave a comment below.
I will personally reply to every single comment!
If you enjoyed this analysis, I would definitely appreciate it, if you smash that like button and maybe consider following my channel.
Thank you for watching and I will see you tomorrow!

GOOGLE A very bullish 2023 and this chart shows why.Alphabet Inc. (GOOG) broke two weeks ago below its 1W MA200 (orange trend-line) for the first time since the March 2020 COVID crash. The next Support level is the 1W MA300 (red trend-line). Since its IPO, the stock has had very symmetric Cycles which with the help of the Sine Waves can show tops and bottoms for consistent sells and buys.
On this pattern, the price level is not as important as the timing. As you see even the latest (All Time) High was fairly accurately predicted by the Sine Waves. The next bottom is projected to be by the first week of January the latest. As a result, on a multi-year scale investment strategy, the time to buy Google comes closer and closer.
Based on the Fibonacci extension levels involved, every Cycle High is at least +0.5 Fib higher than the previous one (basically only one has been +0.5, the rest have been at least +1.0 Fib). As a result, the High of the next Cycle should be at least on the 4.5 Fibonacci extension, around $198.00!
Can 2023 be such a bullish year for the tech giant amidst the Bear Market of rising inflation?
-------------------------------------------------------------------------------
** Please LIKE 👍, SUBSCRIBE ✅, SHARE 🙌 and COMMENT ✍ if you enjoy this idea! Also share your ideas and charts in the comments section below! This is best way to keep it relevant, support me, keep the content here free and allow the idea to reach as many people as possible. **
-------------------------------------------------------------------------------
You may also TELL ME 🙋♀️🙋♂️ in the comments section which symbol you want me to analyze next and on which time-frame. The one with the most posts will be published tomorrow! 👏🎁
-------------------------------------------------------------------------------
👇 👇 👇 👇 👇 👇
💸💸💸💸💸💸
👇 👇 👇 👇 👇 👇

Trade Setup For Google stockGoogle stock is likely to keep dropping for now.
Going back to 2020 Covid19 zone.

GOOGLE Excellent long-term buy opportunity for a $5000 target. GOOG has been trading around its 1W MA50 (blue trend-line) for the past weeks. The Ukraine - Russia war has managed to keep the stock on those low levels, longer than it should but this is a position Google is familiar with.
Ever since the beginning of its trading, the stock has been experiencing phases of growth and then pull-backs to the 1W MA50. Only during the peak of the U.S. - China trade war and the COVID crash, did the price manage to break considerably lower (still the 1W MA200/ orange trend-line supported).
As you see on the chart, every time the 1W RSI prints a Lower Highs sequence, GOOG posts the same Channel Down pattern to the 1W MA50. In all past cases, the price recovered and expanded rapidly to make new Highs on the next Fibonacci extension. The most recent All Time High (ATH) was just below the 4.0 Fib ext. Technically next to fill is the 5.0 Fib which is around the $5000 mark. That is our target for the next expansion cycle that should peak within 2023.
--------------------------------------------------------------------------------------------------------
** Please support this idea with your likes and comments, it is the best way to keep it relevant and support me. **
--------------------------------------------------------------------------------------------------------
