ALPHA/USDT — The Final Battle at the Descending Trendline!Full Daily Analysis
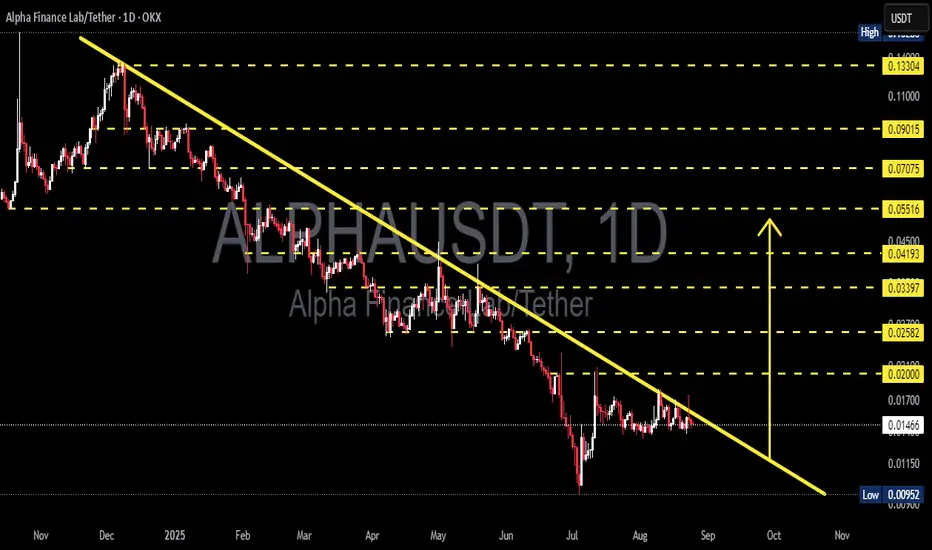
Since early 2025, ALPHA/USDT has been locked in a strong downtrend, forming a series of lower highs and lower lows along a descending trendline (yellow line). Selling pressure remains dominant, yet price action is now consolidating right below the trendline, with a tightening range that signals an explosive move ahead. The market is preparing for a major decision — breakout or rejection.
---
🔎 Structure & Price Pattern
Primary Trend: Long-term downtrend (dominant since Q1 2025).
Current Pattern: Compression zone under descending resistance — a setup often leading to a strong breakout or breakdown.
Nearest Support: 0.00952 (key low).
First Resistance: 0.02000 (psychological + structural level).
Key Levels Above: 0.02582 → 0.03397 → 0.04193 → 0.05516 → 0.07075 → 0.09015.
---
🚀 Bullish Scenario
If price successfully breaks out and closes a daily candle above the trendline (~0.016–0.017):
1. First confirmation: strong bullish daily close + rising volume.
2. Initial Target: 0.02000.
3. Next targets: 0.02582 → 0.03397 → 0.04193.
4. Mid-term potential: 0.05516 up to 0.07075 (+380% from current price).
5. Indicator signals: RSI >50, daily MACD bullish crossover.
📌 Note: A breakout retest of the trendline as support often provides a safer swing entry.
---
🔻 Bearish Scenario
If price fails at the trendline and faces strong rejection:
1. Downside path: revisit minor support 0.012–0.011.
2. Main target: 0.00952 (key chart low).
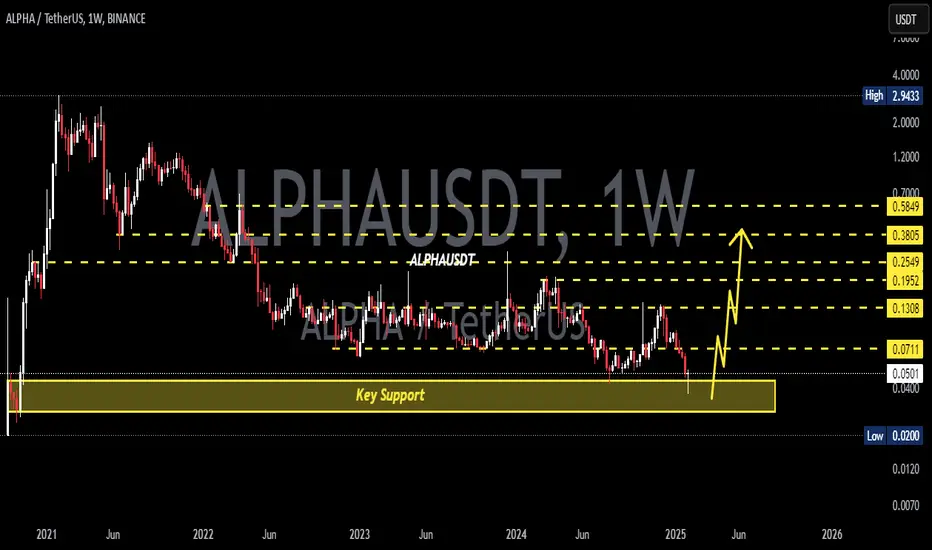
3. If 0.00952 breaks, further downside to new lows (check weekly chart for deeper historical levels).
4. Bearish confirmation: strong rejection candles + rising selling volume + RSI below 50.
---
🎯 Key Takeaways & Trading Strategy
ALPHA/USDT is approaching a decisive moment.
Breakout above the trendline → potential trend reversal toward 0.02–0.02582.
Rejection from the trendline → continuation of the bearish cycle toward 0.00952.
Aggressive traders: may scale in right after breakout confirmation with tight stops.
Conservative traders: wait for daily close + retest before positioning.
Risk management: never risk more than 1–3% per trade. Fakeouts are common in crypto — patience and discipline are key.
---
“ALPHA/USDT has been trapped under a heavy downtrend for months. Now price is consolidating just below the descending trendline — the decisive move is coming soon. Will ALPHA break out into a new bullish phase, or will bears push it back to the 0.0095 low?
Wait for daily close confirmation before making moves. Remember: in every opportunity lies risk, and proper risk management is your best weapon.”
#ALPHA #ALPHAUSDT #Crypto #Altcoin #TechnicalAnalysis #Breakout #Bullish #Bearish #CryptoTrading #SwingTrade #RiskManagement
Alphausdtanalysis
ALPHAUSDT breakdown alertALPHAUSDT breakdown alert
ALPHAUSDT has broken down from a descending triangle pattern, which is typically a bearish continuation setup. The price failed to hold above the lower support trendline, indicating increased selling pressure and a possible continuation of the downtrend.
If the breakdown sustains with strong volume, we may see further downside movement. However, if the price quickly reclaims the broken support level, the move could turn out to be a fakeout.
Key levels to watch:
* Previous support now acting as resistance
* Breakdown confirmation zone
* Volume strength for validation
Keep an eye on ALPHA — confirmation of this breakdown could lead to lower targets ahead.

ALPHAUSDT 1D Analyss ALPHA ~ 1D Analysis
#ALPHA Buy after successfully breaking through this resistance line with a short-term target of at least 15%++.

ALPHAUSDT 1WALPHA ~ 1W Analysis
#ALPHA This is the lowest support for now. Buy from here with a short -term target of at least 15%+. Trading is very high risk.

ALPHAUSDT 1WALPHA ~ 1W Analysis
#ALPHA If you still have a Conviction on this Coin, Maybe you can consider this support to start buying again, a minimum target of 20%+
ALPHAUSDT 1WALPHA ~ 1W
#ALPHA So far it continues to maintain this support block,. If you still have Conviction on this coin,. buy after retesting this support block, with a short-term target of at least 20%+

ALPHA Will Shows Significant Gains But Finally CollapsesHello, Skyrexians!
As you know we like to share with you analysis on crypto assets which are in uptrend and have significant potential to grow. Today we wanna show you the example of coin which is likely in global downtrend. For sure BINANCE:ALPHAUSDT has not set the lower low in comparison to previous bull run, but it dropped significantly to set the new ATH, that is we expect only exit pump.
Let's take a look at the weekly time frame. We can see that current bear market is much more intensive than on other assets. We can see here the clear 5 Elliott waves structure to the downside. The wave 5 is likely to be finished already finishing the wave 1 of higher degree. Green dot on the Bullish/Bearish Reversal Bar Indicator shows us the strongest reversal sign that bear market is finished.
It means, that large wave 2 can happen now. Despite this asset is in global downtrend it can make significant gains reaching 0.5-0.61 Fibonacci retracement level. Notice that this Fibonacci based on regular chart. We show Fibo chart for your convenience. The target is located between $1.47 and $1.87. After such incredible growth we expect the huge crash to new all-time low.
Best regards,
Skyrexio Team
___________________________________________________________
Please, boost this article and subscribe our page if you like analysis!

ALPHAUSDT 1WALPHA ~ 1W
#ALPHA If you still have Conviction on this coin,. Buy gradually inside this pattern,. it is only a matter of time that this resistance line is successfully broken, with a minimum target of 20%+

ALPHAUSDT 1WALPHA ~ 1W
#ALPHA Make purchases gradually on this support block. with a target of at least 15%+ from here.

ALPHA/USDT It required break the resistance for reversal to UP!💎 Paradisers, #ALPHA is indeed exhibiting promising movements that warrant close attention.
💎 Currently, it appears that the price is poised to undergo a retest of the support area around 0.115 before potentially bouncing back to face the resistance zone between 0.13 and 0.1415.
💎 Should ALPHA successfully break above this resistance, it could signify not only a breakout from the immediate resistance but also from the descending pattern.
💎 Such a breakout would likely indicate a shift towards bullish sentiment, potentially leading to significant upward movement towards our target strong resistance area.
💎 However, if ALPHA fails to bounce off the support level and instead breaks down below it, there's a possibility that the price may revisit the key support area.
💎 Given ALPHA's historical tendency to bounce off key support levels, revisiting this zone could serve as a potential reversal point, allowing ALPHA to once again attempt to break through the resistance.
💎 Nevertheless, it's crucial to monitor ALPHA's ability to sustain its price above the key support area. A breakdown below this level would validate bearish momentum, and the bullish thesis would be invalidated. In such a scenario, the price may experience further downward movement.
MyCryptoParadise
iFeel the success🌴

ALPHA/USDT Bullish Momentum for ALPHA back to upward movement!💎 ALPHA has recently experienced significant market dynamics, facing rejection at the supply area. There's a potential for the price to undergo a retracement phase, testing the support area that was previously a resistance.
💎 If this retest is successful, with the price bouncing off the support, it could signal an attempt to break through the supply area again. A successful breakout above this level could lead to a significant upward movement towards our target area.
💎 However, if ALPHA fails to bounce off the support and instead breaks down below it, the price may reverse its trajectory and head downwards towards the demand area to establish a new momentum.
💎 The demand area has historically shown strength, often resulting in significant bounces when tested. Therefore, if ALPHA returns to this zone, there's a strong possibility of an upward reversal. Yet, if the demand area is breached, it could signify a more bearish trend for ALPHA, potentially leading to further declines.

ALPHA target 0.21D time frame
-
ALPHA is creating a bottom structure ranging from 0.5~0.7, and there are 3 obvious resistance zones on the chart. Considering the potential trend of Bitcoin and Ethereum, the first resistance (0.2) is the possible PRZ before bull coming. However, if bull market start running, we can expect 0.6 in next year.
TP: 0.2~0.26 / 0.4~0.43 / 0.6~0.7
SL: 0.057

ALPHAUSDT - Buy Setup!!ALPHAUSDT (1D Chart) Technical analysis
ALPHAUSDT (1D Chart) Currently trading at $0.085
Buy level: Above $0.084
Stop loss: Below $0.073
TP1: $0.09
TP2: $0.1
TP3: $0.12
TP4: $0.145
Max Leverage 3x
Always keep Stop loss
Follow Our Tradingview Account for More Technical Analysis Updates, | Like, Share and Comment Your thoughts

Alpha USDT Long Entry Chats shows a bullish signBINANCE:ALPHAUSDT.P Alpha USDT
Price Break the resistance level .11276 now retest the in 1 Hr TF. Bullish Candle in 4 Hr very good bullish sign towards price more upward direction in coming hr. Price 2 times test the .12544 Level now again test this level. If price break this level or stay above this level at least 1 day then chances move upward direction. Otherwise again tested and rejected this level again.
Now we enter the .11500 level. And tp is .12511.

alpha breaking outhopefully you saw my early chart and caught the bottom and can now enjoy the ride
targets on chart

ALPHAUSDT - Descending Channel BreakoutALPHAUSDT (1D Chart) Technical analysis
ALPHAUSDT (1D Chart) Currently trading at $0.315
Buy level: Above $0.311
Stop loss: Below $0.250
Target 1: $0.349
Target 2: $0.456
Target 3: $0.60
Target 4: $0.78
Target 5: $1
Max Leverage 2x / Spot Market
Always keep Stop loss
Follow Our Tradingview Account for More Technical Analysis Updates, | Like, Share and Comment Your thoughts

ALPHA/USDT 6 HOURS UPDATE Welcome to this quick Update, everyone.
If you are reading my updates for the first time do follow me to get more complex charts in a very simplified way.
I also post altcoin setups on Spot, Margin, and Futures.
I have tried my best to bring the best possible outcome in this chart.
ALPHA /USDT breaks this bullish expanding triangle pattern and now retesting it or on the support of 21MA.
Entry: CMP or upside the 21MA
Targets: 50%TO 60%
Stop Loss: $0.4
What's your thought on this?
Do hit the like button if you like this update and share your views in the comment section.
Thank you
#PEACE

ALPHAUSDT AnalysisHello friends.
Please support my work by clicking the LIKE button(If you liked).Thank you!
Everything on the chart.
open pos: 0.96-1.02
target: 1.3 - 1.6 - 1.8
after first target reached move ur stop to breakeven
stop: ~0.75(depending of ur risk). ALWAYS follow ur RM .
risk/reward 1 to 3.5
Good luck everyone!
Follow me on TRADINGView, if you don't want to miss my next analysis or signals.
It's not financial advice.
Dont Forget, always make your own research before to trade my ideas!
Will be very APPRECIATE FOR UR DONAT/coins :)
Open to your questions or suggestions(Looking for investors!).

ALPHA GOING TO $1.63 this week. 37% EASY! Good set up by Alpha, ready to pump higher! HOLD on to your seat we're going to the bank to rob!
