ALPINE is testing the red resistance zone📊 $ALPINE Market Update
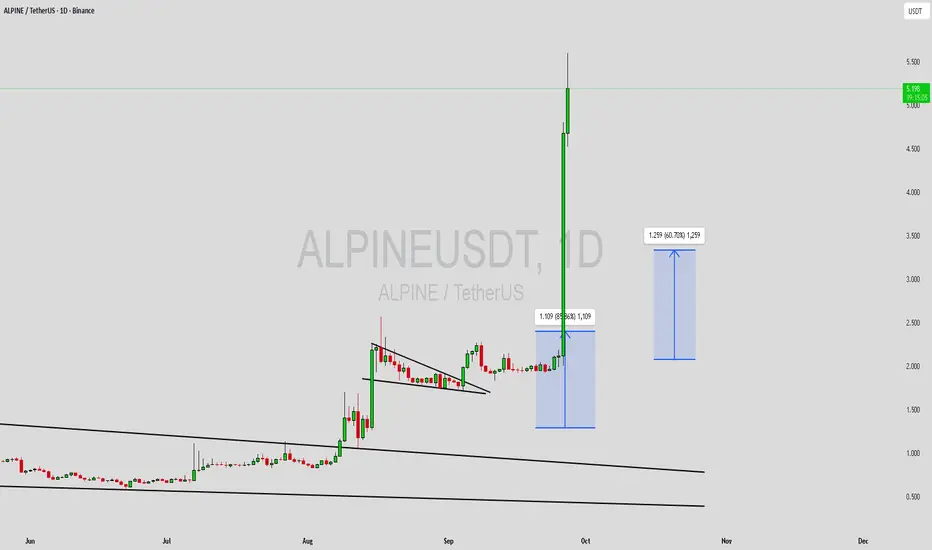
$ALPINE is testing the red resistance zone 🔴
If it breaks out with confirmation, the first target will be the green line level 🎯 — a move that could deliver up to 40% gain 🚀
ALPINEUSDT

ALPINEUSDT Forming Bullish Wave ALPINEUSDT is displaying a bullish wave pattern that signals strength and momentum in the market. The setup indicates that buyers are stepping in consistently, supported by solid trading volume. With this positive structure, ALPINEUSDT is showing potential for a 50% to 60%+ gain, making it an attractive opportunity for traders watching for breakout plays in the altcoin market.
The bullish wave pattern suggests that the price is in an upward continuation phase, where accumulation and retracement waves are creating a strong foundation for the next leg higher. Historically, such setups often lead to sustainable bullish moves once resistance levels are cleared with volume confirmation. ALPINEUSDT appears to be building toward that stage, which could unlock significant upside momentum.
Investor interest in this project is also increasing, adding another layer of confidence for the mid-term outlook. The combination of technical signals, volume participation, and growing sentiment positions ALPINEUSDT as a coin worth keeping on the watchlist for potential strong performance in the coming sessions.
✅ Show your support by hitting the like button and
✅ Leaving a comment below! (What is You opinion about this Coin)
Your feedback and engagement keep me inspired to share more insightful market analysis with you!
ALPINEUSDT Forming Bullish WaveALPINEUSDT is showing a bullish wave pattern, which indicates strong momentum building in favor of the buyers. This type of setup often reflects a series of higher highs and higher lows, suggesting that the trend structure remains intact and poised for further growth. The market is beginning to reflect renewed strength, making ALPINEUSDT an attractive opportunity for short to medium-term gains.
The volume profile looks healthy, supporting the idea that accumulation is underway. Increased trading activity is often a key signal of growing confidence among traders and investors, adding strength to the bullish wave formation. With this setup, ALPINEUSDT is expected to achieve a gain of around 50% to 60%+ if the trend continues to unfold.
Investor interest in ALPINEUSDT is on the rise, as enthusiasm grows around both the technical pattern and the project’s potential. The consistent flow of participation is helping create a solid foundation for sustained price action. A breakout continuation could attract even more momentum traders into the market, further driving its trajectory.
In conclusion, ALPINEUSDT is positioned at a favorable technical level where the bullish wave pattern and strong market sentiment align. If current conditions hold, the pair has a high probability of delivering significant upside in the weeks ahead.
✅ Show your support by hitting the like button and
✅ Leaving a comment below! (What is You opinion about this Coin)
Your feedback and engagement keep me inspired to share more insightful market analysis with you!

Unleash the Potential: $ALPINE Soars to New HeightsBINANCE:ALPINEUSDT
Unleash the Potential: $ALPINE Soars to New Heights
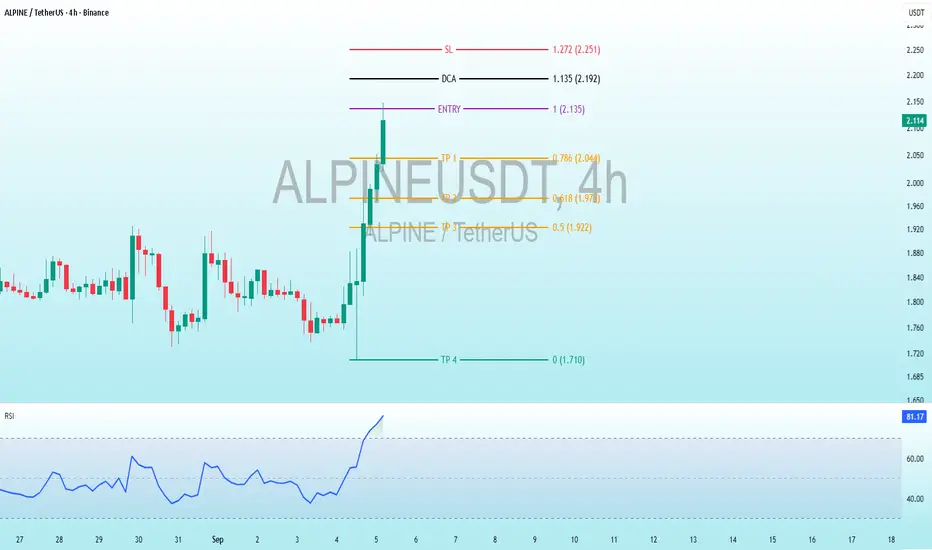
Price Action and Levels:
Entry Point: Marked at 2.130 - 2.125, indicating the price level to enter a long position.
DCA (Dollar-Cost Averaging): Set at 2.192, suggesting an additional buy level if the price dips.
Stop Loss (SL): Placed at 2.251, which is above the recent high, indicating a risk management level to exit if the trade goes against you.
Take Profit (TP) Levels:
TP1: 0.786 (2.044), a potential profit target.
TP2: 0.618 (1.973), another profit target.
TP3: 0.5 (1.922), a mid-range target.
TP4: 0 (1.710), the final target with the lowest Fibonacci retracement level.
Technical Analysis:
The chart shows a recent upward move with a strong green candlestick at the entry level (2.130 - 2.125), followed by a pullback.
The price appears to be testing support around the entry zone, with potential for further upside if it holds.
RSI (Relative Strength Index):
The RSI at the bottom shows the momentum. It has recently risen sharply, moving from below 40 to around 81.55
ALPINE/USDT - SHORTThe project will take approximately 1-2 months to complete.
(This is not an investment recommendation).
$ALPINE Momentum Shift: 4H Trading Guide with RSI EdgeBINANCE:ALPINEUSDT
Trading Levels:
Entry: 1.00 (2.040 USDT) - The level where the initial purchase is planned.
DCA (Dollar-Cost Averaging): 1.135 (2.174 USDT) - An additional buying point if the price rises.
SL (Stop Loss): 1.272 (2.310 USDT) - The level where the loss would be limited.
TP (Take Profit):TP1: 0.786 (1.828 USDT)
TP2: 0.618 (1.661 USDT)
TP3: 0.5 (1.545 USDT)
TP4: 0 (1.049 USDT) - A significantly lower target, likely an error or a long-term goal.
RSI (Relative Strength Index) Indicator:
The current RSI value is 72.06, which is approaching the overbought territory (above 70). This suggests the price may be nearing an overextended state, hinting at a potential reversal or consolidation.
Analysis and Interpretation:
Strategy: The chart uses Fibonacci levels to determine entry, exit, and loss points. The entry is set at 2.040 USDT, with a DCA at 2.174 USDT if the price continues to rise, and a stop loss at 2.310 USDT to protect capital.
Profit Targets: TP1 to TP3 are based on Fibonacci retracement levels (0.786, 0.618, 0.5), indicating a technical approach to taking profits incrementally. TP4 at 0.049 USDT seems unrealistically low and is likely a mistake.
RSI: The RSI value (72.06) indicates the price is nearing overbought conditions. This could suggest an impending pullback or consolidation, especially if the price fails to break past recent highs.
Recommendation:
Monitor the price closely around the entry level (2.040 USDT) and DCA (2.174 USDT). Given the rising RSI, caution is advised as the price approaches overbought territory. Consider preparing for a potential correction.

ALPINEUSDT Forming Falling WedgeALPINEUSDT has just broken out of a long-term falling wedge pattern on the weekly chart, which is a classic bullish reversal setup. This breakout is significant not only because of the pattern itself, but also because of the substantial volume accompanying the move. A falling wedge breakout after a prolonged consolidation phase often signals the beginning of a strong bullish trend, and ALPINEUSDT seems to be right at the start of such a move.
The volume surge validates growing investor interest and signals that accumulation is well underway. The price action is now positioned above the upper wedge resistance, indicating a confirmed breakout and suggesting strong upside potential. Based on the chart structure, the expected gain for this breakout is projected between 390% to 400%+, which makes ALPINEUSDT a high-potential candidate for medium- to long-term holding.
From a technical standpoint, the coin is entering a new phase of momentum. Historical resistance levels may become future support, and the breakout target aligns with both the pattern projection and psychological price levels. Such alignment between technical analysis and market interest can create strong bullish continuation patterns.
✅ Show your support by hitting the like button and
✅ Leaving a comment below! (What is You opinion about this Coin)
Your feedback and engagement keep me inspired to share more insightful market analysis with you!

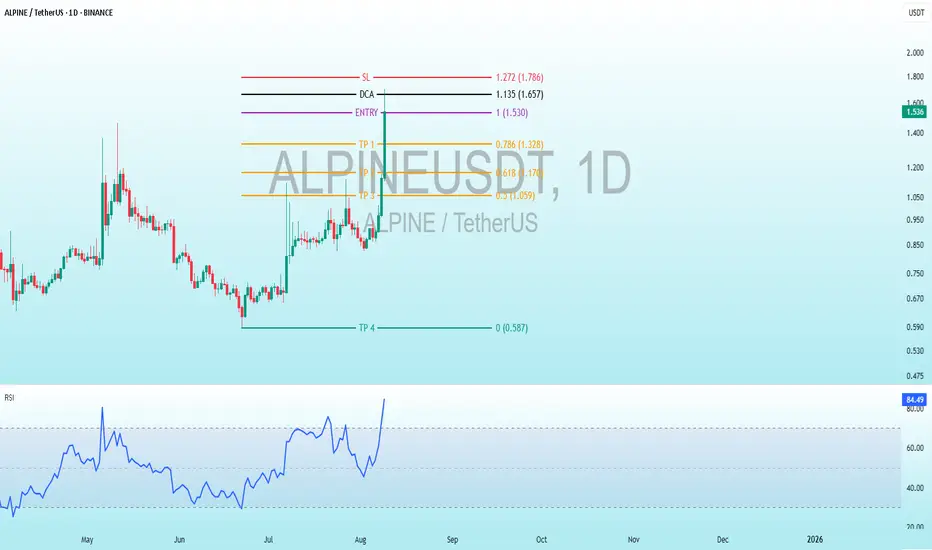
$ALPINE Bearish DivergenceBINANCE:ALPINEUSDT
Trade Setup:
Target 1: 1.328 (0.786 Fibonnaci Golden Zone).
Target 2: 1.170 (0.618 Fibonnaci Golden Zone).
Target 3: 1.059 (0.5 Fibonnaci Golden Zone).
Target 4: 0.587 (0 Fibonnaci).
DCA : 1.657 (1.135 Fibonacci)
Stop Loss: 1.786 (1.272 Fibonacci).
RSI Analysis: The RSI is showing a bearish divergence, suggesting potential bearish momentum. The current RSI is around 84.07, approaching oversold territory, so caution is advised.
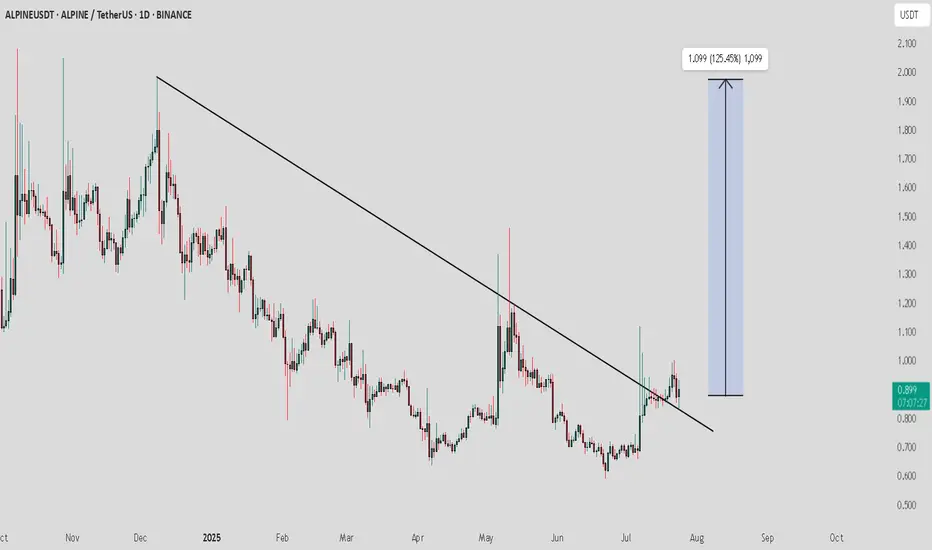
ALPINE / USDT : looking bullish ALPINEUSDT Analysis:
The price is currently retesting the downward trendline. This is a crucial point where the price may either bounce off or fail to hold the trendline, signaling the next major move.
Bullish Scenario:
Trendline Retest and Bounce: If the price holds above the trendline and shows bullish momentum, we could see a rise towards 1.099 (125.45% potential upside).
Confirmation: Look for strong buying volume during the retest to confirm the bounce.
Bearish Scenario:
Trendline Breakdown: If the price fails to hold the trendline and breaks below it, this could trigger a downward move.
Target: Watch for the next support levels to gauge the potential downside.
#ALPINE/USDT#ALPINE
The price is moving within a descending channel on the 1-hour frame, adhering well to it, and is heading for a strong breakout and retest.
We are experiencing a rebound from the lower boundary of the descending channel, which is support at 0.890
We are experiencing a downtrend on the RSI indicator that is about to be broken and retested, supporting the upward trend.
We are looking for stability above the 100 Moving Average.
Entry price: 1.08
First target: 1.10
Second target: 1.20
Third target: 1.35

LISTAUSDT | Rank : 1009👀 Welcome to my Trading View Analysis and Trading Channel Here , we share the latest market analysis, trading signals, and key insights together .
Ready for smarter trades ? ⭐️
⚡️Today , we're going to analyze the ALPINE (Alpine F1 Team Fan Token
) coin together on the daily timeframe and find triggers for our positions .
✨The outlook for the coming days looks very promising . We are witnessing a breakout from the descending trendline , which typically indicates positive changes in price . Additionally , a retest of this trendline has been performed and confirmed that the breakout is genuine and can be trusted .
🚀Moreover , the horizontal resistances that usually hinder price increases have now been cleared , and this is a sign of the strength of the upcoming bullish trend . In lower time frames , a bullish flag pattern has also formed , which generally indicates the potential for further price increases .
📊Given these conditions and the patterns observed in the market , we expect the price to double in the coming days , creating great investment opportunities . Therefore , we can confidently look forward to the bullish trend ahead and be prepared to enter the market! "
I researched this coin on CoinMarketCap on your behalf , and I'm sharing a summary of the information I gathered .
Read carefully , as you need to have this information . 🌈
The Alpine F1 Team Fan Token, also known by the symbol "ALPINE," is a type of non-fungible token (NFT) and fan token associated with the Alpine Formula One team. These tokens allow fans to participate in decisions related to the team and enjoy specific benefits.
### Key Features of the Alpine F1 Team Fan Token:
1. Fan Participation: By holding this token, fans can take part in polls and decisions concerning the team. These decisions may include choosing the color and design of the team's outfits or even naming certain elements of the team.
2. Benefits and Rewards: Holders of fan tokens typically receive special advantages such as ticket discounts, access to exclusive events, or closer interaction with the team.
3. Socio s.com Platform: The Alpine F1 Team fan tokens are usually offered on the Socios .com platform, allowing fans to buy and sell their tokens.
4. Exclusive Experiences: Token holders can gain access to unique and exclusive experiences, such as meeting drivers, attending special events, and more.
These tokens enable fans not only to show their support for the team but also to play a part in the team's management and decision-making processes. For more precise information, it's always recommended to refer to official resources and the team's website.
I love you all so much . 👀
don't forget about capital management and risk management .
Be careful with your positions . 🥇

Alpine showing a week level signal
BINANCE:ALPINEUSDT showing a strong weekly level signal. Don't know the reason why, but enjoy and see if it happens.
Basic information:
Alpine F1 Team a chance to engage with the racing brand. Binance promises that the token will "revolutionize the fan experience" by allowing fans to:
Participate in team voting polls
Hunt digital collectibles and purchase NFTs
Enjoy gamification features tied to fan rewards or great experiences
COINBASE:BTCUSD For long-term level, BTC will also reach a higher level, so be patient and do not use any emergency money to buy a long-term style coin.

ALPINEUSDT.1DOn this daily chart for ALPINE/USDT, we're presented with an outlook that incorporates the RSI (Relative Strength Index) and MACD (Moving Average Convergence Divergence) indicators along with key levels of support (S1, S2) and resistance (R1, R2).
The RSI, sitting just above the neutral 50 mark at 52.04, suggests a slight bullish bias but indicates that the market is neither overbought nor oversold at the moment. The MACD is almost flat and very close to the zero line, indicating that there is no strong momentum in either direction.
Price action is currently between S1 at $2.000 and R1 at $2.884, with the price at the time of the screenshot at $2.520. This suggests a consolidation phase within this range. The fact that the price is maintaining above the psychological level of $2.000 (S1) could be seen as a potentially bullish signal, as it may serve as a strong support level.
A break above R1 would indicate a potential bullish continuation, possibly heading towards R2. However, if the price breaks below S1, it could suggest a bearish reversal with the possibility of the price moving down to test the next support at S2 ($1.755).
For trading strategies, one might look for confirmation of a breakout above R1 with increased volume as a sign of bullish strength. Conversely, a drop below S1 with significant volume could indicate bearish momentum, and traders might look for short opportunities or exit long positions.
As always, additional analysis of ALPINE’s market conditions and potential news events should be considered in any trading decision. It's also essential to implement a sound risk management strategy, potentially setting stop-loss orders near the S1 level to manage downside risk.

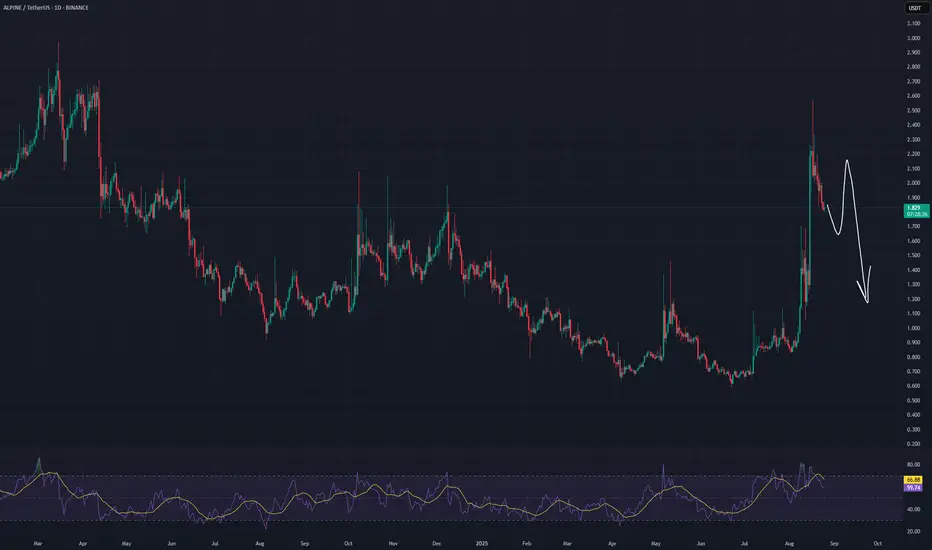
ALPINE ANALYSISFirst of all, note that ALPINE's movements are full of shadows and move slowly.
ALPINE seems to be in a large diametric that has just finished wave D. Wave D appears to have been a triangle.
The green area is a suitable place for a buy/long position.
Closing a daily candle below the invalidation level will violate the analysis
For risk management, please don't forget stop loss and capital management
When we reach the first target, save some profit and then change the stop to entry
Comment if you have any questions
Thank You

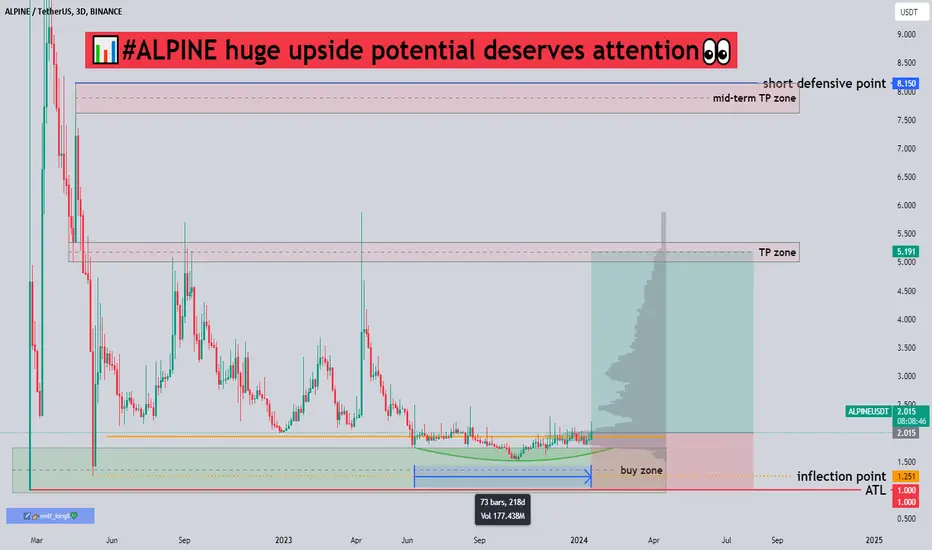
📊#ALPINE huge upside potential deserves attention👀🧠It is not difficult to find from the chart that we have been at the bottom for a long time. In this bullish craze, fan tokens do not seem to perform very well. Hot sectors are all rotating. After all, the funds in the market are turning from bear to bull. Once the bull market starts, the funds flowing into the market will increase sharply, so sectors that have not yet performed are worthy of our ambush.✔️
➡️From a technical perspective, we have been consolidating sideways near the buying zone for about 218 days, and there are signs of gradual increase, so we can consider using DCA to buy. If TP1 develops as expected, then our rate of return will be Can achieve 160%+ or more💥
🤜If you like my analysis, please like 💖and share it💬
💕 Follow me so you don't miss out on any signals and analyze 💯
Possible scenario for alpineBuy after the daily close of purple line .
Or if the channel fails buy in zone below.
DYOR.

ALPINEUSDT.1HBased on the given market data, ALPINE is currently trading at $1.983 against USDT.
The 4-hour chart shows that the Relative Strength Index (RSI) is at 69.59, which is close to the overbought territory (above 70) and could indicate a potential price pullback. The Moving Average Convergence Divergence (MACD) is slightly negative (-0.001), suggesting a bearish trend. The current price is slightly below the upper Bollinger Band (BB) of $1.997, which often suggests a potential pullback towards the mean.
In terms of support and resistance levels on the 4-hour chart, the first, second, and third support levels are at $1.917, $1.883, and $1.809 respectively. The first, second, and third resistance levels are at $2.112, $2.180, and $2.300 respectively.
On the daily chart, the RSI is at 55.52, indicating a more balanced market. The MACD is positive (0.018) which suggests a bullish trend. The current price is below the upper Bollinger Band at $2.062, indicating room for potential upside.
The support levels on the daily chart are at $1.886, $1.800, and $1.761, while the resistance levels are at $2.117, $2.192, and $2.300.
On the weekly chart, the RSI is at 49.36, indicating a balanced market, and the MACD is negative (-0.070), suggesting a bearish trend. The support levels are at $1.817, $1.601, and $1.500, while the resistance levels are at $2.210, $2.310, and $2.475.
In conclusion, ALPINE is showing mixed signals across different time frames. The short-term 4-hour chart is indicating a potential price pullback, while the daily chart suggests room for potential upside. The weekly chart suggests a bearish trend. Therefore, it is recommended to monitor the market closely and make decisions based on further market movements and individual risk tolerance.

ALPINE| On a rebound from the support levelHello trader! Today I have a new idea for you. Like and subscribe to the channel, there is a lot of useful information there.✅
Locally, the coin has lost a strong % in price; the buyer can become active near the 0.236 Fibonacci zone. You can try to go a little higher than the level.
Deal plan:
Entrance - 1.760/1.730$
Stop - $1.653
Take - $1.9
Guys, don’t forget about risk management and follow the risks!

ALPINEUSDT 3D LONG📈Hi all. Timeframe 3 days. ALPINEUSDT is at support. I consider a long position during a breakdown/retest of a trend line. Or a set to the spot now with an addition from the lower level. Marked targets and levels on the chart.

ALPINEUSDTALPINEUSDT is in good bullish momentum and respecting very well the bullish trendline.
Currently the price is retracing previous bullish leg and 50% fib retracement will be technically good for another bullish leg.

Alpine F1 Team Fan Token formed a Gartley for upto 153.50% pumpHi dear friends, hope you are well and welcome to the new trade setup of Alpine F1 Team Fan Token (ALPINE) with US Dollar pair.
Our last successful trade of ALPINE was as below:
Now a daily time frame, ALPINE has formed a bullish Gartley pattern for the next price reversal.
Note: Above idea is for educational purpose only. It is advised to diversify and strictly follow the stop loss, and don't get stuck with trade

ALong

alpine/busd buy callAlpinebusd buy call
Alpine is testing rising support
Buy : 3.8
SL : 3.68
TP : 4.06
ALong
