Envision (VIS) on BASEEnvision (VIS) on BASE – Multi-Target Accumulation Setup
This analysis focuses on the long-term accumulation structure forming on VIS/BASE following a prolonged downtrend and multi-month consolidation near historical lows. Price has compressed within a narrow range (~$0.0060–$0.0070), showing exhaustion in selling volume and the first signs of structural support holding above the previous capitulation wick.
Technical Outlook
Accumulation Zone: $0.0058–$0.0070
This zone aligns with the lowest historical range and coincides with visible demand clusters on weekly structure. A clean reclaim and close above $0.008 would confirm a short-term reversal.
Breakout Confirmation:
A break and weekly close above $0.008139 (≈125%) signals initial strength and potential rotation toward mid-range resistance.
Target Levels
Target 1: $0.008139 (short-term breakout target, +125%)
Reclaiming this level confirms strength and may attract early momentum traders.
Target 2: $0.023874 (mid-range retracement, +368%)
This area represents the 0.382–0.5 retracement zone of the prior impulse move and prior consolidation shelf.
Target 3: $0.029982 (major fib confluence and liquidity pocket, +463%)
This aligns with the 0.65–0.786 Fibonacci retracement range and a historically heavy supply area (60K–98K BKR levels).
Volume & Liquidity Context
Volume shows compression near the base, and historical BKR (breaker block) metrics indicate previous sell-side inefficiency around $0.023–$0.030. These zones are likely to attract liquidity hunts and partial profit opportunities during a recovery leg.
Not Ever Financial Advice.
Altisona

Copy / Paste / Push Play Used the bar tool to copy historical price action on the BTC INDEX.
Drew out Order Blocks to give future anchor points.
Circles line up.
Have some fun and push play.

VAL - Sora Validator TokenThis chart is a creative venture. I did something a little different. I pulled a volume profile for the entire uniswap history of VAL token. I then pulled a FIB range on that revealed VAH and VAL area (value area high, low).
It is creative in the sense that I want to see if the total buying and selling data from the volume profile will be respected in the future with external market conditions. It all plays together but so do the minor details.
So it's a bit predictive in nature but no guarantees, and no fortune telling.
I will make other charts on VAL but for now I will start here.

COCOSUSDT_Possible Repeat based on Total marketHistory repeats itself.
If the Total (Cryptocap) goes down from 1.15Trillion into the lower range,
then i see this scenario being possible.
Make sure to watch the total market for "confirmation". Don't just fomo in.
The volume profile reveals where the most buying and selling has occurred, the VAH (value area high), the VAL (value area low) and the white line POC (point of control). Notice the 618 fib Golden Pocket area. We tend to range in the boxes above. I simply used the copy candle feature and pasted the history over the unknown future. Lets see what happens. This is no fortune telling. Its only TA (technical analysis). Paper trade only for play.

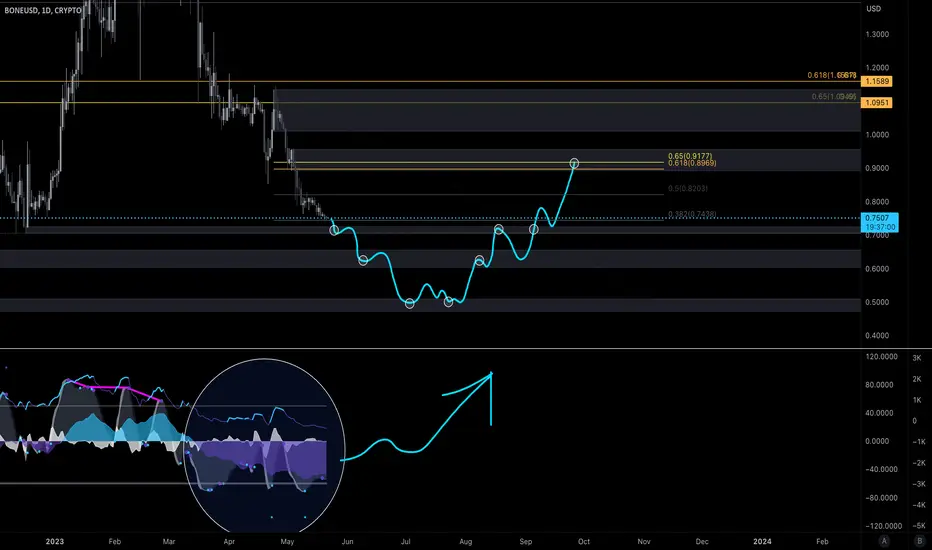
Bone Order Blocks Daily Chart Money flow has been going down.
We may see a bounce soon but I think it will drive down further after.
My opinion is that we will accumulate along side BTC and the TOTAL market until Jan 2024.
With that said. You really never know with the Shib army. Wild things have happened before. If they release new hype you could see volatility with low marketcap ecosystem tokens such as Leash, Fund, Xfund, and Bone.