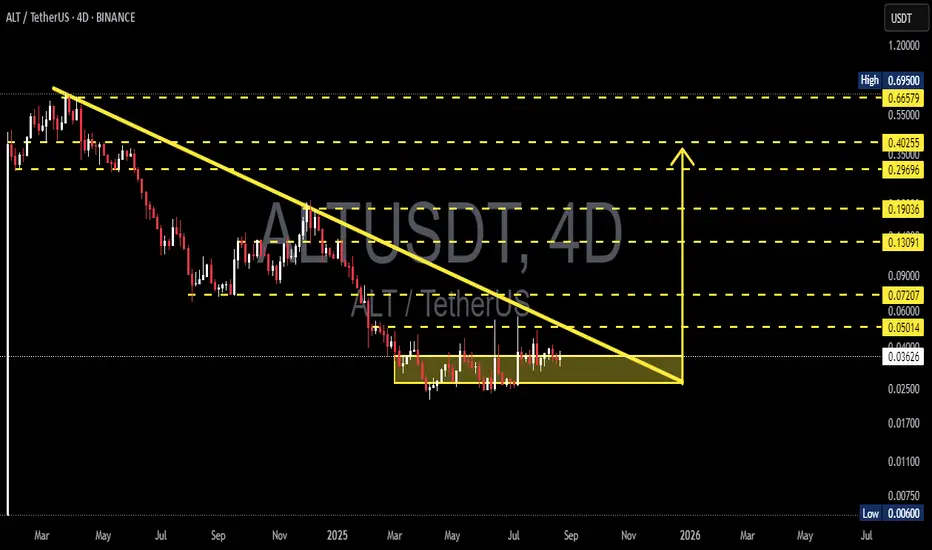
ALT/USDT — Descending Triangle: Breakout or Breakdown?🔎 Overview
ALT/USDT has been in a prolonged downtrend since 2024, consistently forming lower highs along a descending trendline. At the same time, buyers continue to defend the support base at 0.028–0.031 USDT, creating a clear Descending Triangle pattern.
Currently, price action is consolidating inside a yellow accumulation box — squeezed between strong demand below and heavy supply above. This kind of compression often ends with a large expansion move, either a breakout or a breakdown.
---
🧩 Technical Structure
Main Pattern: Descending Triangle (typically bearish continuation, but at the end of long trends it can act as a reversal).
Key Demand Zone (support): 0.028–0.031
Key Supply Zone (resistance + trendline): 0.040–0.042
Major Resistance Levels:
0.050 → 0.060 → 0.072 → 0.090 → 0.131 → 0.190 → 0.270 → 0.403 → 0.666
Support Levels if Breakdown:
0.017 → 0.011 → 0.006
---
🚀 Bullish Scenario (Potential Reversal & Breakout)
1. Confirmation: 4D close above 0.042 and a clean breakout from the descending trendline.
2. Entry Trigger: Retest of 0.040–0.042 holding as new support.
3. Short- to Mid-Term Targets:
0.050 (minor resistance)
0.060 (psychological barrier)
0.072–0.090 (major supply zone)
4. Long-Term Targets (if momentum builds): 0.130 → 0.190 → 0.270
5. Invalidation: Price closes back below 0.038–0.040 after breakout.
---
📉 Bearish Scenario (Trend Continuation)
1. Confirmation: 4D close below 0.028 with strong volume.
2. Entry Trigger: Retest of 0.028–0.031 fails to reclaim (acting as resistance).
3. Targets to the Downside:
0.017 (historical support)
0.011 (extreme support)
0.006 (all-time low risk zone)
4. Invalidation: Price reclaims above 0.031 after breakdown.
---
⚖️ Key Notes
Price is in a compression phase — the longer it consolidates inside the box, the stronger the eventual breakout or breakdown.
Watch for false breakouts/breakdowns, especially around 0.028–0.042 key levels.
The 4D timeframe provides stronger confirmation signals; patience is key.
Always manage risk: maintain R:R ≥ 1:2, scale in/out across marked levels.
---
🎯 Conclusion
ALT/USDT is at a critical decision point: Will it break out of its long downtrend and start a bullish reversal, or will sellers dominate again and push the price to fresh lows?
The Descending Triangle acts like a “technical time bomb” — pressure keeps building, and once released, it could result in a significant move.
Traders should closely watch for a confirmed breakout above 0.042 (bullish) or a breakdown below 0.028 (bearish) to determine the next major direction.
#ALTUSDT #ALT #Crypto #CryptoAnalysis #PriceAction #DescendingTriangle #Breakout #SupportResistance
Altusdtlong
ALTUSDT Forming Bullish ReversalALTUSDT is currently displaying a bullish reversal pattern that may mark the beginning of a significant trend change. After a prolonged period of downward or sideways movement, the asset has shown signs of accumulation, with increasing volume and a shift in price structure. This type of reversal formation typically signals that buyers are stepping back into the market with strength, aiming to reclaim lost levels and push higher.
Technically, the chart structure supports a strong recovery potential, as the price is attempting to break out of a consolidation zone with solid momentum. The bullish reversal pattern suggests that sellers have likely exhausted their control, and a trend shift is underway. With increasing interest and engagement around the ALT project, both technically and sentimentally, a price surge in the range of 90% to 100% becomes a realistic expectation.
From a market sentiment perspective, ALT is regaining attention from crypto traders due to recent development updates and growing adoption potential in its ecosystem. Investors are beginning to identify ALT as a sleeper altcoin that may deliver above-average returns once the reversal is confirmed. This momentum is backed by improved volume and clear buying pressure on critical support levels.
A confirmed breakout above resistance, with sustained volume, could act as the catalyst for a parabolic move. Traders should monitor this setup closely, as it may offer one of the best reward-to-risk ratios in the current market cycle. ALTUSDT could be setting up for a major rally in the coming days or weeks.
✅ Show your support by hitting the like button and
✅ Leaving a comment below! (What is You opinion about this Coin)
Your feedback and engagement keep me inspired to share more insightful market analysis with you!

ALTUSDT Forming Potential BreakoutALTUSDT is shaping up to be an interesting opportunity for crypto traders watching for potential breakout plays. The pair has recently tested a strong horizontal support zone multiple times, forming a solid base around that level. This accumulation range is a key area where buyers seem to step in aggressively, suggesting that a bounce and a trend reversal could be on the horizon. The technical outlook points toward a projected gain of around 90% to 100%+, which could attract more traders looking for high risk-to-reward setups in the altcoin market.
The trading volume remains healthy on ALTUSDT, confirming that there’s good liquidity and market participation to fuel a potential rally. When volume supports the price action like this, it generally adds strength to the bullish case. Many traders keep an eye on such setups because once the price breaks out from the consolidation phase, it often does so with momentum that can yield quick returns. The chart also shows early signs of a move upward with bullish candles forming off the support zone.
Investors are increasingly taking interest in the project behind ALTUSDT, drawn not just by its technical potential but by the community sentiment and developmental updates. This is critical because strong fundamentals combined with a bullish technical pattern can create the perfect storm for a powerful price surge. As the crypto market enters a more optimistic phase, coins like ALTUSDT could see amplified moves as traders look to rotate capital into promising altcoins with clear breakout setups.
✅ Show your support by hitting the like button and
✅ Leaving a comment below! (What is You opinion about this Coin)
Your feedback and engagement keep me inspired to share more insightful market analysis with y

ALTUSDT Forming Falling WedgeALTUSDT has recently completed a breakout from a well-formed falling wedge pattern, a strong bullish technical signal that often precedes significant upward momentum. The wedge breakout is backed by a noticeable spike in trading volume, adding credibility to the move and indicating growing market participation. This classic reversal pattern suggests that a major trend shift could be underway, and price projections indicate a potential gain in the range of 70% to 80%, aligning with historical performance of such breakouts.
What makes this setup more compelling is the structure of the wedge itself—tight, consistent, and with clear lower highs and lower lows, followed by a strong bullish candle cutting through resistance. This is a textbook example of a bullish breakout where the price decisively exits the consolidation zone and starts trending upward. With volume confirming the breakout, many traders see this as an early-stage rally signal with room to grow.
Investor sentiment around ALTUSDT is gaining strength, particularly on social platforms and trading communities. This surge in attention could fuel further buying pressure, particularly as the breakout becomes more visible to retail and technical traders. ALTUSDT has shown the ability to move sharply during bullish phases, and this breakout could signal the beginning of a new leg higher, especially if it maintains momentum over the next few daily closes.
With strong technical structure, increasing investor interest, and supportive volume, ALTUSDT is shaping up to be one of the stronger bullish breakout candidates in the current market environment. Traders looking for high-reward setups may find this an ideal entry point with a well-defined technical framework and attractive upside potential.
✅ Show your support by hitting the like button and
✅ Leaving a comment below! (What is You opinion about this Coin)
Your feedback and engagement keep me inspired to share more insightful market analysis with you!

ALTUSDT 1D AnalysisALT ~ 1D Analysis
#ALT This trade is very risky NASDAQ:ALT Trying to penetrate this resistant line, Buy if successfully penetrate this resistant line with a large volume to avoid false breakout.

ALTUSDT 3DALT ~ 3D
#ALT So far it still maintains this support block,. If you still have Conviction on this coin,. Buy from here with a minimum target of 20%+

$ALTUSDT - Expecting a high rise breakout from the triangleBINANCE:ALTUSDT - Looking pretty much bullish from this zone, expecting a breakout from the triangle. Upper TF's too validating the fact. Time to see what happens,

ALTUSDTALT ~ 1D
#ALT If you have Conviction on this coin, wait for this resistance line to be successfully broken and you can make purchases gradually.

ALTUSDTALT ~ 1D
#ALT If you have Conviction on this coin, wait for this resistance line to be successfully broken and you can make purchases gradually.

#ALT/USDT#ALT
The price is moving in a descending channel on the 12-hour frame and is sticking to it to a large extent and it was broken upwards
We have a bounce from the lower limit of the channel at a price of 0.07177
We have an upward trend on the RSI indicator, which supports the rise
We have a trend to stabilize above the moving average 100
Entry price 0.09400
First target 0.14500
Second target 0.1879
Third target 0.27000

ALTUSDT: Trend Shifting to BullishALTUSDT technical analysis update
ALT price has broken the double bottom neckline resistance with high volume and has successfully retested. The price is now moving bullish toward the next target, though it may consolidate sideways before continuing upward.
Target1: $0.160
Target 2: $0.285

ALT/USDT IDEA Alt/USDT
The market structure appears to be transitioning towards a bullish trend. The breakout from the trendline has already been confirmed, indicating a potential uptrend. It is currently undergoing a retest, and if this retest is successful, we may anticipate a significant bullish rally. There is a possibility that the price could surge up to $1 during this leg up. However, it is important to note that this information is not financial advice and should be considered for educational or informational purposes only.

ALTUSDT Good Buy!ALTUSDT Technical analysis update
ALT price recently surpassed its previous all-time high (ATH) and is currently trading above both the 100 and 200 exponential moving averages (EMAs) on the 1-hour chart.
Buy zone : Below $0.475
Stop loss : $0.430
Hexa
Thanks

ALTUSDT Inverse Head and Shoulder Pattern.ALTUSDT Technical analysis update
ALT formed an inverse head and shoulders pattern and price broke its neckline with high volume, indicating a potential upward move.
Buy zone : Below $0.388
Stop loss : $0.360
Take Profit 1: $0.410
Take Profit 2: $0.462
Take Profit 3: $0.550
Regards
Hexa
