AUUSD → Buyers Defend Structure, Upside Continuation in FocusHello everyone,
Gold is continuing to trade with a constructive tone, and the current structure suggests the bullish trend remains intact. From a macro perspective, the U.S. dollar has softened slightly while Treasury yields have stabilized , reducing downside pressure on non-yielding assets like gold. In an environment where investors remain cautious but not risk-off, gold continues to benefit from its role as both a hedge and a momentum asset .
From a technical standpoint on the H1 chart, price action is clearly supportive of further upside . Gold broke out of a bullish flag pattern after a strong impulsive move , then successfully respected the rising trendline on the pullback . This behavior signals healthy consolidation rather than weakness , with buyers stepping in at higher levels and maintaining control of the broader move.
As long as price holds above the trendline support, the bullish structure remains valid . A continuation above recent highs would open the door toward the 4,385 area, with extension potential toward 4,458 if momentum accelerates. Only a decisive break below the trendline would call for reassessing this bullish outlook .
In summary, XAUUSD is showing a well-organized uptrend supported by both structure and sentiment . Patience and discipline remain key, as the market appears to be positioning for the next leg higher rather than signaling exhaustion .
Wishing you clear judgment, disciplined risk management, and sustainable trading performance.
Alyanalysis

Gold Enters Controlled Consolidation Within a Bullish StructureGold is no longer advancing in an accelerated manner, but is instead entering a phase of controlled consolidation . This is a natural response following a clear impulsive move, as the market needs time to rebalance supply and demand. Despite a cautious overall sentiment amid mixed macro conditions, capital flows continue to maintain exposure to gold.
On the H1 timeframe , the technical structure continues to support the bullish bias. Price is rotating within a narrow range, with higher lows being preserved , indicating that selling pressure is not aggressive and is largely driven by short-term profit-taking. This suggests that buyers remain in control of the primary move .
Current price action reflects a supply absorption phase . If the upper resistance zone is absorbed and price achieves a clear and decisive close above it , the bullish trend will be reaffirmed, opening the path toward the 4,385 area . Conversely, further sideways movement should not be viewed as a negative signal; a well-formed consolidation base often precedes a more sustainable advance. Only a decisive break below support would require reassessing the bullish scenario.

GOLD → Bearish Pressure Builds, But Confirmation Still RequiredHello everyone,
At the moment, gold is being influenced by a relatively sensitive macro backdrop. The U.S. dollar remains firm and U.S. Treasury yields stay elevated, making capital flows into non-yielding assets like gold more cautious. However, these factors are not yet strong enough to trigger a decisive sell-off ; they are mainly causing price to stall and lose momentum.
From a technical perspective , the H1 chart shows that gold has not confirmed a break of the bullish structure . Price is still hovering around the ascending trendline and consolidating after forming a double top near the highs. This reflects market indecision—buying pressure is weakening, but sellers have not fully taken control.
Therefore, the bearish scenario is only activated if price breaks and closes clearly below the ascending trendline . If that happens, the short-term structure would shift from bullish to bearish, opening the door for a move toward 4,262 , and potentially deeper to 4,207 , where demand previously appeared.
Conversely, as long as no breakout occurs , current price action should be viewed as consolidation or a corrective phase within the trend. Selling prematurely without a confirmed break carries higher risk and does not align with disciplined trading.
In summary , macro news is applying downside pressure, but technically gold still requires clear confirmation. The rational approach right now is not to predict, but to wait for the market to confirm . Only when structure is truly broken does the bearish scenario become valid and actionable.

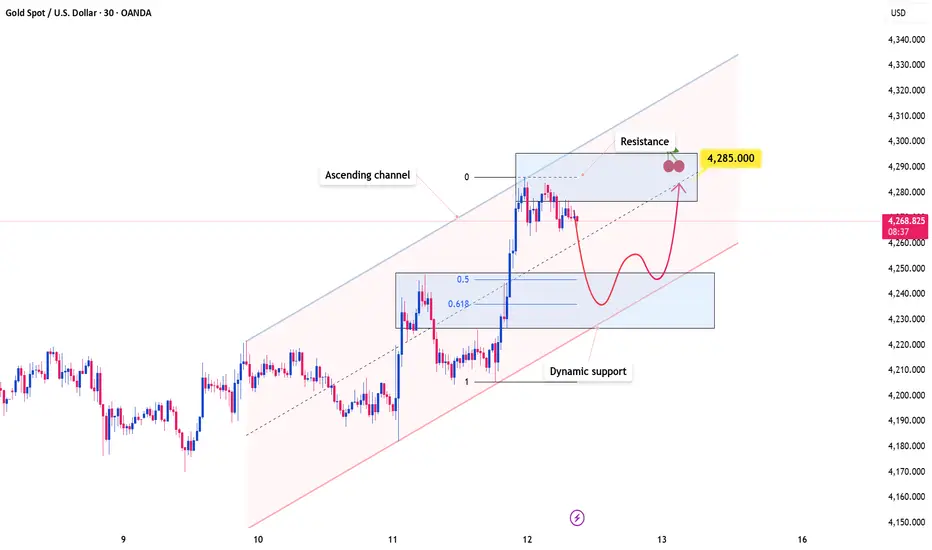
Gold Holds a High Ground While the Market Reprices RiskOANDA:XAUUSD continues to trade within a well-defined ascending channel, with price action consistently respecting both the upper and lower boundaries. This structure highlights strong bullish control, suggesting that buyers remain firmly in charge and that upside continuation is still favored.
Price has recently broken above a key resistance zone and may return to retest this level. If it holds as support, it would further validate the bullish structure and significantly increase the probability of a move toward the 4,285 target. This level aligns closely with the midline of the ascending channel as well as a previous resistance area, reinforcing its technical importance.
As long as price remains above this support zone, the bullish outlook stays intact. However, a failure to hold this level could weaken the current structure and open the door for a deeper pullback toward the lower boundary of the channel.
On the fundamental side, gold’s recent surge has been driven by an unexpected shift from the U.S. Federal Reserve toward monetary easing, including a return to bond purchases. This move pressured the U.S. dollar and effectively removed prior concerns over a prolonged hawkish policy stance, prompting renewed inflows into gold.
While short-term pullbacks remain possible due to overbought conditions, the broader trend continues to look constructive, supported by ongoing central bank buying and sustained demand for safe-haven assets.
Gold Bear Flag Ready for a Bullish BreakoutHello everyone, Helene here! XAUUSD is currently showing a more positive outlook as price structure starts shifting into a bullish direction.
The latest market interaction is particularly interesting. We’re seeing an early recovery phase, weakening bearish momentum, and low-volume candles suggesting seller exhaustion. This often acts as an early signal for a potential bullish move developing.
Based on the current pattern, my target is around 4,330 – a reasonable level aligned with the market structure. Should price continue in this direction, the next move could become a beautiful extension of the bullish story in Gold we’ve been following.
This setup looks very appealing. It’s a developing scenario, although it still requires patience and proper confirmation before fully validating the upside.
Even though a bearish scenario is still possible due to the clear support zone below, I personally lean toward additional bullish continuation as the pattern forming here supports that outlook.
Wishing you a successful trading session and the best of luck.

Gold’s Next Big Move: 4,350 Is Within Reach!Hello everyone, it's Helene here!
Gold is looking pretty interesting right now. As mentioned in the previous analysis, the price shot up. But guess what? Right now, it's slightly pulling back, moving in the opposite direction to the previous uptrend, which looks like a familiar bullish flag pattern. In this case, there's a scenario that could play out, and considering the market conditions are still bullish, I'm leaning toward the possibility that the price will break the flag pattern to the upside.
My target is 4,350.
Do you agree? Leave a comment below. Joining the TradingView community is always helpful to improve and develop your trading skills.

Gold completes its corrective phase and heads toward $4,250OANDA:XAUUSD is moving within a remarkably well-structured ascending channel, and the overall market structure clearly highlights the strength of the buying momentum. Each swing produces higher highs and higher lows, confirming that the bullish dynamic remains intact despite a few natural pauses along the way. The recent pullback looks more like a healthy technical breather than a sign of weakness, often the kind of pause that sets the stage for a new upward acceleration.
The price is now approaching a key support zone, where the lower boundary of the channel aligns with a previously proven demand area. If the market reacts here, buyers could find a highly favorable re-entry opportunity that aligns perfectly with both the channel structure and the logic of the current trend. In that scenario, the natural upside target is around 4,250 dollars, a level that combines the channel’s midline with a historical resistance, giving even more weight to this objective.
The bullish outlook remains valid as long as the price holds above the support zone and the ascending trendline. A decisive break below these levels would redefine the market context and open the door to a deeper correction, but for now, market conditions continue to favor long positions.
Stay disciplined in your market reading, validate your setups carefully, and protect your capital with strict risk management. Good luck.

XAUUSD: A new rise is possible after the pullbackXAUUSD has climbed strongly along a steep uptrend, and based on what I’m seeing on the chart, I expect the price to continue pushing toward the 4,265 area.
This zone could become a decision point where the price either finds support and bounces higher or breaks below and allows the move to extend deeper.
If I had to choose a direction right now, I’d lean toward more upside. But price action will always decide what comes next because the chart always speaks last.
When the price breaks below the trendline with real conviction, the bullish scenario loses validity. That could signal a pause in the uptrend or even a short-term reversal.
This is not financial advice, only my personal thoughts based on what I see on the chart.

Gold Bulls Smash Through the Flag PatternGold has climbed sharply, and after that sudden burst of momentum, the market naturally shifted into a cooling phase, forming a descending flag.
This pullback does not reflect weakness; instead, it represents a controlled pause as the market resets after a strong advance.
Sellers are attempting to push prices lower, yet the decline remains shallow. That limited retracement reveals that buyers are still firmly positioned and ready to defend the trend at every dip.
At this stage, price is breaking out of the flag with clear conviction, signaling that bullish strength is returning to the market. The breakout candle, supported by increasing volume, highlights strong market intent and renewed confidence from buyers.
With momentum building again, the next impulsive move is likely to extend toward the 4,300 target.

XAUUSD continues to rise after the Adam & Eve patternOANDA:XAUUSD is really interesting right now. The price seems likely to rise further after the formation of the Adam & Eve pattern. With such an easy-to-remember name, the Adam & Eve pattern is one of the most memorable. I will explain below the reasons and how to recognize it easily.
The Adam pattern is characterized by a sharp drop, followed by a quick recovery, forming a "V" on the chart. High, sharp, and aggressive! One could say it's more "masculine."
On the other hand, the Eve pattern develops more slowly. The price becomes more rounded, forming a wider and smoother base before rising again, creating a shape similar to the letter "U." Softer, more curved, and more "feminine."
Combining these two elements gives us the Adam & Eve pattern, which often signals a potential trend reversal. Especially when accompanied by fundamental analysis or other strong technical indicators.
This pattern will stick in your mind when you connect its shapes to the male and female aspects. A pattern that is truly hard to forget.

XAUUSD Bullish Momentum Continues — Target 4,350OANDA:XAUUSD is still trading within a clearly defined ascending channel, with recent price action bouncing off a key support level. This suggests that the bullish trend is likely to continue, with the next target being around 4,350, aligning with the upper boundary of the channel.
A short-term pullback could present a buying opportunity, especially if bullish candlestick patterns like engulfing or hammer appear, signaling strength from the buyers. A decisive breakout above recent highs would further reinforce the momentum towards the expected target.
However, if the price breaks below the lower boundary of the channel, it would invalidate the bullish outlook and potentially signal a shift in market direction.
This is just my perspective on the market, not financial advice. Best of luck!

An Opportunity to Short GOLD You Can't MissOn the chart, gold continues to move smoothly within a clear downtrend channel, with highs and lows forming at progressively lower levels over time. Currently, the price is once again approaching the upper boundary of the channel and interacting with the same resistance area, where sellers have appeared multiple times before, pushing the market to reverse. This behavior indicates that the potential for a continued corrective move downward in line with the main trend remains intact.
In this context, I see a price decline toward the area around 4,080 as a logical and reasonable target for this corrective wave. As long as the price hasn’t decisively broken the upper boundary of the channel, I will continue to favor the scenario where the downward trend remains dominant, considering most upward movements as merely pullbacks within the existing structure.
This is not investment advice, but simply my personal viewpoint based on the current price action.

Latest Gold Update Today!Hey traders,
As we kick off this new week, XAUUSD is holding steady, hovering around the 4,050-dollar level with barely any noticeable volatility.
This calm price action comes as the market keeps a close eye on what the Federal Reserve plans to do next. More and more participants are expecting the Fed to shift toward a more dovish stance and potentially move closer to a rate cut by the end of the year. With bond yields slipping, the dollar gradually losing strength, and safe-haven demand picking back up, gold is getting a solid foundation for a possible short-term push higher.
From a technical standpoint, XAUUSD is tightening inside a triangle pattern — a classic setup that usually signals accumulation before a stronger impulsive move. If price manages to break above the upper boundary, the next target could stretch toward the 4,500-dollar region, supported by the strength of the previous bullish leg.
From my perspective, market sentiment is slowly leaning toward the buyers, especially if upcoming U.S. data continues to ease pressure on gold.
What about you? How do you see things playing out? Are you expecting more upside, or do you think a correction is coming?
Wishing you a smooth, confident, and profitable trading week ahead.

The Gold Bullish Setup You Can't Afford to Miss!OANDA:XAUUSD The price is currently showing clear signs that it’s approaching a significant support zone, an area where the market has previously reacted positively. This zone is also near the psychological threshold of $4,000, a level that generally attracts considerable attention in the market.
The momentum from this zone suggests that buyers could step in and push the price higher. A positive confirmation, such as a strong rejection pattern, a bullish engulfing candle, or a long lower shadow, would increase the likelihood of a rebound from this level. If my prediction is
correct and buyers regain control, the price could reach $4,070.
However, a break below this support level would invalidate the bullish outlook and could lead to a deeper price decline.
This is not financial advice!

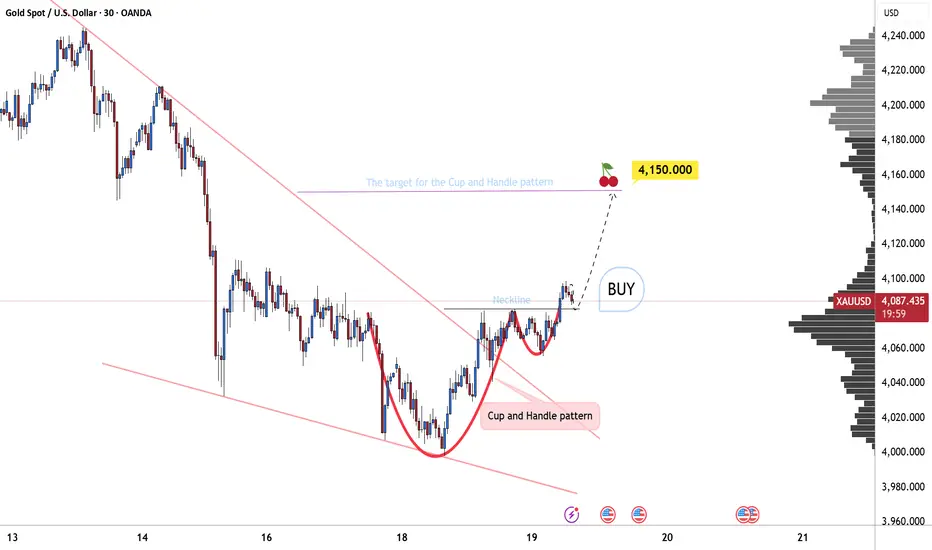
Cup and Handle: Bullish Outlook for GoldOANDA:XAUUSD is clearly forming a Cup and Handle pattern. The price previously dropped to the 4000 zone, then rebounded to 4080, completing the cup structure.
Afterward, the market is experiencing a slight pullback, forming a tight and well-controlled handle.
Finally, the price breaks through the neckline with strong momentum, and my next target is around 4150 , measured based on the height of the cup.
This is a classic bullish pattern, and market expectations are gradually being reinforced.
BTCUSD Technical Analysis – Is a Correction on the Way?BINANCE:BTCUSD is currently trading inside a well-defined falling wedge, and the price is pressing against the lower boundary of the pattern. This level could serve as dynamic support, and if a strong rejection occurs, we may see a corrective move toward the 102,000 resistance area.
If sellers successfully defend that zone, the bearish structure remains intact, increasing the likelihood of BTCUSD moving back down to lower price levels. However, if price breaks above this resistance, a deeper correction toward the upper boundary of the wedge could unfold.
At this stage, closely monitoring candlestick signals and volume activity around this key area is essential for spotting high-quality selling opportunities. Ensure every trade setup is backed by solid confirmation, and always maintain strict risk management.
If you have any thoughts or additional perspectives on this setup, I’d be happy to hear them. Feel free to share your opinion in the comments!

Gold Price Setup: The Pullback Signal Is Getting Stronger!OANDA:XAUUSD is currently trading within a well-defined ascending channel, with price action now testing the upper boundary. This level may act as a dynamic resistance, and a rejection here could trigger a correction toward 4,030.
Such a pullback aligns with expectations for a healthy retracement after a strong rally. I anticipate this move will serve as an important launchpad for buyers, defined by the confluence of horizontal support and the 0.618 Fibonacci retracement of the latest bullish impulse.
This zone will be critical in determining whether the broader bullish structure remains intact. If price holds and shows signs of reversal, it could offer a solid re-entry opportunity for buyers. However, a decisive break below this region would invalidate the current bullish outlook, opening the door for a deeper correction.
Always confirm your setups and manage risk wisely. Stay sharp, and trade smart.

Gold’s Inverse Head and Shoulders PatternThe price has been dropping steadily and consistently so far. Check out my previous analysis:
Or click on the attached idea on my chart.
But here’s the thing, momentum is starting to shift.
If you look closely, you'll see that we’re forming an inverse Head and Shoulders pattern. We have the first low, the left shoulder. Then, a deeper low, the head. And finally, a slightly higher low, the right shoulder.
Right now, price is sitting just above that downward-sloping neckline, which is a clear sign that momentum is beginning to change, and there are few obstacles in its way.
My expectation is for a pullback to retest the neckline, filtering out any fake moves, before potentially pushing upward toward 4,085. If the bullish momentum continues with strong volume, I’ll lock into the trend and plan my entry accordingly.
I might even take a buy position here for a more proactive setup. The risk is slightly higher, but with the market structure confirming it, I’m ready to enter because sometimes, the best trades come when you trust your setup.
Just sharing my thoughts on the chart, not financial advice. Always confirm your setup and manage your risk wisely.

XAUUSD Breaks Out and Continues Its Bullish RallyOANDA:XAUUSD The market is still in a strong downtrend, yet the bearish momentum is gradually losing strength as a double bottom pattern begins to form, a classic signal that sellers are running out of steam.
After the second bottom took shape, buyers stepped in with growing confidence, and the price is now testing the neckline, confirming a structural shift toward a potential bullish reversal.
At this point, all eyes are fixed on the neckline. If a breakout above this level occurs, it will confirm the pattern and open the path for buyers to push the price higher toward 4,135.

XAUUSD: The Bullish ABCD Pattern Signals Potential Price SurgeHey everyone, it's Erik!
The price has decreased within the bullish ABCD pattern, a pattern that often indicates that the sellers have exhausted their strength, with their momentum weakening near the bottom.
Recently, the price broke above the upper trendline, signaling that buyers are starting to intervene, shifting the market dynamics in their favor.
If the price stays above this recently broken level, we could see a significant rise. My target is for the price to reach around 4,130, a reasonable level based on the current setup.

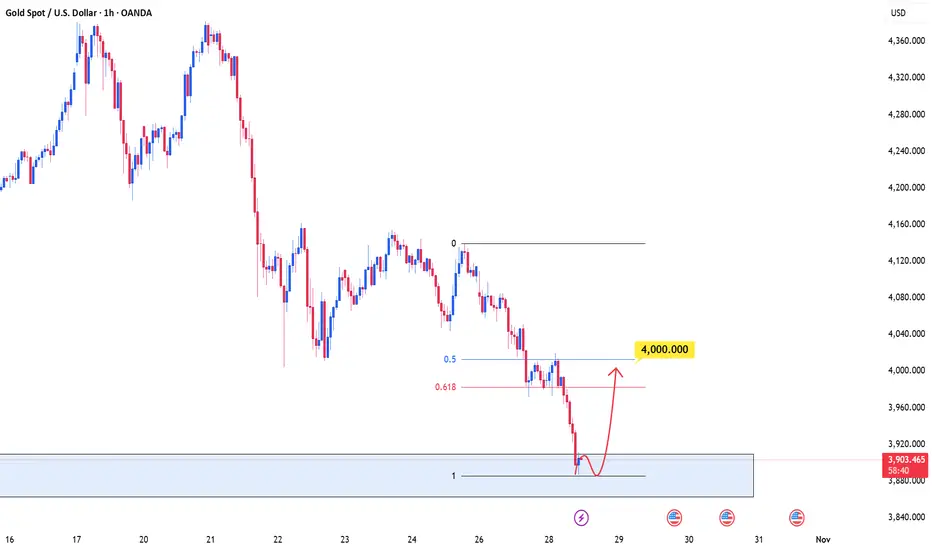
GOLD will return to the Fibonacci level after a sharp declineOANDA:XAUUSD The price recently experienced a sharp sell-off and, after being strongly rejected at a key resistance level, is now entering a stabilization phase. We’re currently in a consolidation phase, where the selling pressure is gradually subsiding.
If buyers can hold this level and push the price higher, the next target will be the Fibonacci retracement zone of 0.5–0.618, ranging between 4,000 and 4,020. This is a critical area, as it could mark the point where sellers may re-enter the market, creating further fluctuations.
Wishing you all successful trades and substantial profits!
XAUUSD remains stable at high levels, focus on what comes nextHey everyone, Erik here.
XAUUSD has been showing strong momentum lately. After a sharp decline, the market quickly recovered, rebounding powerfully from the lower boundary of the newly projected channel. What initially appeared as weakness was actually a calculated shakeout, trapping sellers before reversing upward with confidence.
This behavior is typical of strong bullish trends. It clears out weak positions, triggers stop losses, and restores balance before the next upward movement. At this stage, the market appears to be entering the early phase of a new bullish impulse.
There might be a short consolidation or a slight correction, but the momentum is clearly pointing toward the upper boundary of the channel. For XAUUSD, the bullish continuation scenario seems far more convincing.
My target is around 4,585, near the upper resistance zone of the projected channel. The overall market structure remains decisively bullish, and the emotional surge during the last drop may become the fuel that powers the next strong rally.

Gold Likely to Rise FurtherPEPPERSTONE:XAUUSD is demonstrating a well-structured movement within an ascending channel, where each price bounce is well-controlled, and every retracement follows a consistent pattern. The strength of the buyers is becoming increasingly evident, with technical dynamics becoming more organized and fluid.
After breaking through a key resistance level, the price is now retesting this level. If this level holds as solid support, the market is likely to continue its bullish momentum towards 4,500, which serves as the natural target aligned with the upper boundary of the ascending channel.
As long as the price remains above this support level, the upward trend will continue. However, if the price fails to hold and drops below this level, the trend structure will be at risk, and the likelihood of a technical correction towards the lower boundary of the channel will increase.
In this well-organized market condition, consistency and discipline in analysis are crucial. Carefully identify key points, wait for strong confirmation, and allow the trend to move in the predetermined direction.
