American Express (AXP) High-Risk Zone AnalysisThe stock is currently in a high-risk area for buying.
Chart A (Weekly): Price is near the upper boundary of its 5-year channel, accompanied by a clear RSI divergence.
Chart B (Daily): Price is at the top of its 5-month channel, while both MACD and RSI show strong divergences.
Based on these signals, this stock appears to be in a very risky buying zone, with a potential corrective move down to around $355.
This analysis will be updated as the situation develops.
Follow me on TradingView for more analyses and live stock trades.
NYSE:AXP
Americanexpress

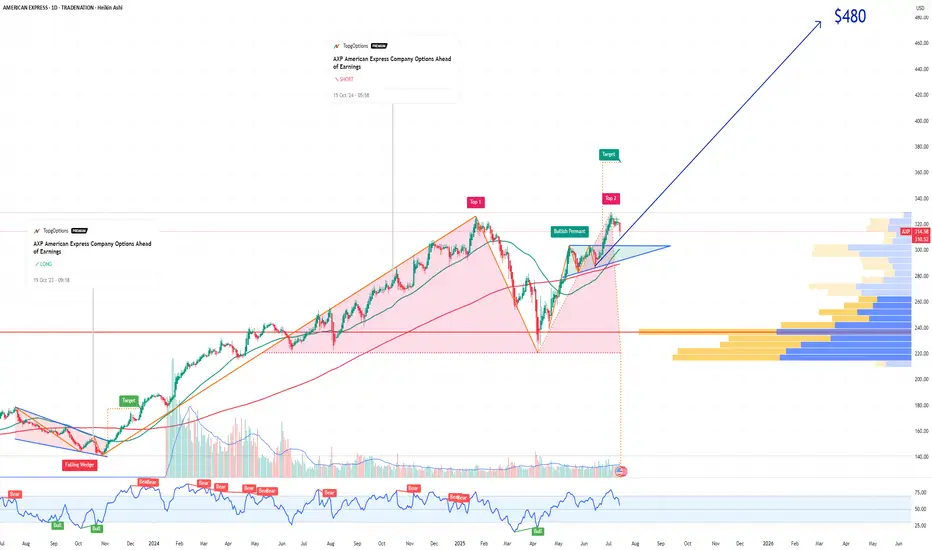
AXP American Express Company Options Ahead of EarningsIf you haven`t bought AXP before the rally:
Now analyzing the options chain and the chart patterns of AXP American Express Company prior to the earnings report this week,
I would consider purchasing the 480usd strike price Calls with
an expiration date of 2027-1-15,
for a premium of approximately $6.25.
If these options prove to be profitable prior to the earnings release, I would sell at least half of them.
Disclosure: I am part of Trade Nation's Influencer program and receive a monthly fee for using their TradingView charts in my analysis.
VISA BACK TO 370 BY 2026 Why Visa (V) Could Hit $370 by 2026: Payments Powerhouse Bull Case Visa’s trading at ~$344 today (Sep 23, 2025), up 15% YTD on digital payments surge, but with EPS climbing 12%+ and global transaction volumes booming, $370 (8% upside) by EOY 2026 is a low-bar target for this steady climber. Here’s the roadmap:Revenue & Payments Growth: Q3 '25 cross-border volume +16% YoY, driving $39B TTM revenue (11% growth). Analysts project 9.4% YoY to $43B+ in FY26 on e-comm (25% of sales) and emerging markets expansion, per Simply Wall St—fueling $370 at 25x forward sales.
2 sources
EPS Acceleration: Consensus EPS hits $10.50 in FY26 (up 12% from $9.37 '25), trading at 28x forward P/E—below historical 32x avg. At norm multiple, that's $336 base; add 11.2% earnings growth for $370 pop, aligning with LiteFinance's $370–$380 range.
2 sources
Innovation Tailwinds: Visa Direct + fintech ties (e.g., Ample Earth climate collab) boost B2B volumes 20%+, hedging crypto/reg risks. Tokenization and AI fraud tech scale margins to 67%+, per management.
Analyst Consensus Backs It: 27–51 firms avg $380–$396 PT (Strong Buy, high $430), with StockScan eyeing $351 avg '26 (high $390). Lows at $305, but bulls dominate on 10%+ CAGR.

American Express: Momentum StallingAmerican Express shares recently managed to further extend green wave C before shifting into a period of sideways movement. However, the stock is expected to resume its climb toward the high of beige wave b in the near term. After that, our primary scenario calls for a sharp pullback, which would bring price down into our blue long Target Zone between $205.35 and $167.99. We anticipate this range will mark the final low of the blue corrective wave (IV). If the stock instead maintains its momentum and decisively breaks through resistance at $397.21, the bullish alternative scenario will be triggered (probability: 38%). In that case, blue wave alt.(IV) would be considered already complete.

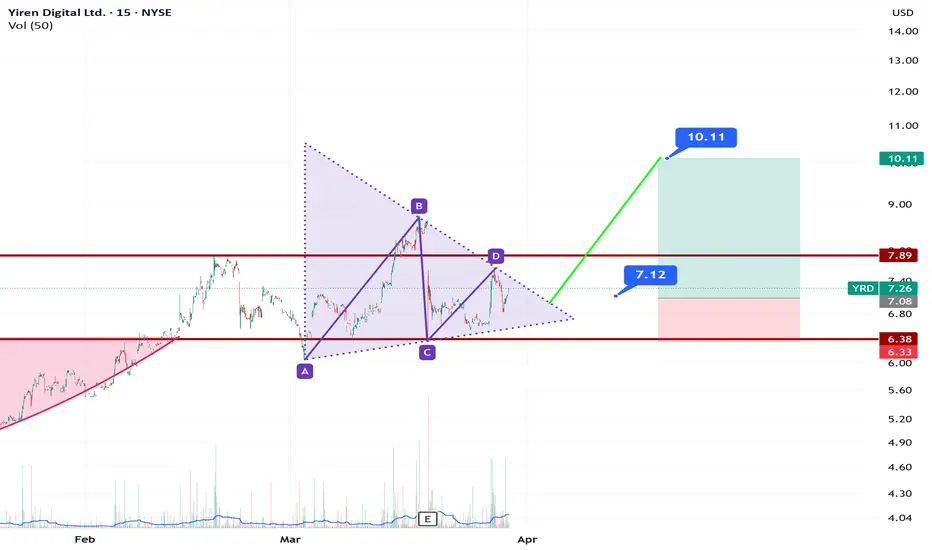
YRD Triangle PatternYRD has good financials in Credit Services. There are NYSE:V , NYSE:MA , NYSE:AXP , NASDAQ:PYPL like companies in Credit Services Industry. The Industry's average PE ratio is 25. YRD's current PE ratio is around 3,41 for latest quarter. It also has triangle pattern.
American Express: Room to Fall FurtherWhile it’s possible that we’ve already seen the low of the beige wave a, we’re not fully convinced. For now, we prepare for another potential decline toward the support at $222.03. That said, the stock should reverse well above this level and begin to rise again as part of the beige wave b, which should provide strong upward pressure. Once this corrective rebound is complete – well below the resistance at $345.03 – the final leg of the wave (IV) correction should bring the stock down into our blue Target Zone, which spans from $205.35 to $167.99. This price range is well-suited for long entries. However, reaching this Target Zone is not guaranteed. We still have to account for the possibility that the upcoming (or perhaps already settled) low may mark the end of the blue wave alt.(IV). But this 31% likely alternative scenario would only be confirmed by a breakout above the resistance at $345.03.

AXP -1d chart - long ideaI am long AXP
targets in the chart
Daily chart
It seems like once we break the ATH we can do a quick strong move higher.
SL is marked as well.
NFA
DYOR

Unleashing the Bull: Why AXP is Poised for a Breakout!Current Price: $324
Stop Loss: $310 (below key support). ( very tight SL )
TP1: $340 (short-term breakout target).
TP2: $360 (channel resistance).
TP3: $370 (analyst high target).
1️⃣ Strong Earnings Potential (Jan 24, 2025)
Analysts expect EPS of $3.03 (+15.7% YoY) and revenue of $17.18 billion (+8.8% YoY).
Solid growth driven by resilient consumer spending and premium travel recovery.
2️⃣ Premium Client Spending
AXP focuses on affluent clients, benefiting from higher spending levels and limited credit risk.
Strong performance in the travel and entertainment segments aligns with rising global travel demand.
3️⃣ Bullish Technicals
Channel Breakout: AXP has broken out above the ascending channel, signaling bullish momentum.
Indicators:
RSI above 70 indicates strong momentum.
MACD confirms bullish crossover.
Increased volume supports the breakout.
4️⃣ Interest Rate Tailwinds
Elevated interest rates enhance AXP’s interest income, bolstering profitability in its lending business.
5️⃣ Analyst Sentiment
Consensus Price Target: Analysts' median target of $360 , with high-end forecasts at $370 , offers an upside potential of 11% to 14% from the current price.

AXP | SHORTNYSE:AXP
Technical Analysis of American Express (AXP)
Key Observations:
Current Price Action:
Price: $232.28
Recent Drop: -16.40 (-6.59%)
Support and Resistance Levels:
Immediate Support: $227.69 (Target Price 1)
Further Supports: $219.31 (Target Price 2), $200.36 (Target Price 3), and $186.49 (Target Price 4)
Resistance: The price broke below a previous support level at around $244.51.
Trendlines:
The upward trendline has been broken, indicating a potential shift from a bullish to a bearish trend.
Relative Strength Index (RSI):
Current RSI: 51.36
The RSI shows a recent decline, approaching a neutral level, indicating that the stock is neither overbought nor oversold.
Target Prices:
Target Price 1: $227.69
This level is the immediate support and a potential first target for any continued downward movement.
Target Price 2: $219.31
If the price breaks below the immediate support, the next target is around $219.31, a previous support level.
Target Price 3: $200.36
Further downside could see the price reaching $200.36, a significant psychological and technical support level.
Target Price 4: $186.49
In a more bearish scenario, the price could fall to $186.49, another key support level.
Summary:
American Express (AXP) has experienced a significant drop, breaking below a key support level and its upward trendline. The next levels to watch are $227.69, $219.31, $200.36, and $186.49. The RSI is neutral, suggesting the potential for further declines if market conditions remain negative.

The Payment Card Titan: Comparing Visa, Mastercard, and Amex◉ Abstract
The global credit card market is projected to grow from USD 559.18 billion in 2023 to USD 1,146.62 billion by 2033, driven by advancements in digital payment technologies, e-commerce growth, increased financial literacy, and urbanization, especially in Asia-Pacific.
Visa leads the market with a 38.73% share, followed by Mastercard and American Express. Visa and Mastercard operate primarily as payment networks, while American Express both issues cards and offers unique rewards. Financially, all three companies show strong revenue growth, with American Express yielding the highest ROI but also carrying significant debt.
Despite this debt, American Express appears undervalued based on financial ratios. Overall, while American Express presents an attractive investment opportunity, Visa and Mastercard also demonstrate solid fundamentals and growth potential for investors in the expanding credit card market.
Read the full analysis here . . .
◉ Introduction
The Global Credit Card Market Size was Valued at USD 559.18 Billion in 2023 and the Worldwide Credit Card Market Size is Expected to Reach USD 1146.62 Billion by 2033,
◉ Key Growth Drivers
● Digitalization and Technology: Advancements in payment technologies, including mobile wallets and contactless payments, enhance convenience and security.
● E-Commerce Growth: The rise of online shopping increases demand for credit card payments, as consumers prefer their ease and safety.
● Financial Literacy: Improved understanding of financial products encourages more consumers, especially in developing regions, to adopt credit cards.
● Urbanization: Growing urban populations, particularly in Asia-Pacific, lead to greater access to banking services and credit facilities.
● Emerging Markets: Rising disposable incomes in developing countries drive new credit card accounts as financial institutions expand their offerings.
● Consumer Convenience: The preference for quick and easy payment methods boosts credit card usage over cash transactions.
● Rewards Programs: Attractive loyalty programs incentivize consumers to use credit cards for everyday purchases.
● Regulatory Support: Government initiatives promoting cashless transactions foster a favourable environment for credit card adoption.
◉ Market Overview
As of 2022, the global credit card market was primarily led by Visa, which held a 38.73% share of the worldwide payment volume. Mastercard followed with a 24% market share, while American Express (Amex) accounted for 4.61%. Notably, China UnionPay is also a major player in this space, surpassing Amex in terms of purchase volume
◉ Key Players in the Payment Card Industry
1. Visa NYSE:V
● Market Cap: $552 B
● Market Share: 38.73%
● Business Model: Payment network facilitating transactions between consumers, businesses, banks, and governments globally.
● Card Issuance: Does not issue cards itself.
● Global Reach: Extensive acceptance network across more than 200 countries.
2. Mastercard NYSE:MA
● Market Cap: $474 B
● Market Share: 24%
● Business Model: Payment processor and network partnering with banks to offer various card products.
● Card Issuance: Does not issue cards itself.
● Global Reach: Broad acceptance worldwide with diverse products catering to different consumer needs.
3. American Express NYSE:AXP
● Market Cap: $203 B
● Market Share: 4.61%
● Business Model: Card issuer and payment network offering unique benefits and rewards directly to cardholders.
● Card Issuance: Issues its own cards.
● Global Reach: High acceptance rate in the US (99% of merchants), lower in Europe and Asia due to higher transaction fees.
◉ Technical Aspects
● From a technical perspective, there's a notable similarity among the three stocks: each is exhibiting strong bullish momentum, consistently achieving higher highs and higher lows.
● All three stocks have formed a Rounding Bottom pattern, and after breaking out, their prices have climbed to new heights.
● While Mastercard and American Express are currently trading at their all-time highs, Visa is positioned just below its peak.
◉ Relative Strength
The chart vividly demonstrates that American Express has excelled remarkably, achieving a return of nearly 85%, whereas Mastercard and Visa have delivered returns of 28% and 20%, respectively.
◉ Revenue & Profit Analysis
1. Visa
● Year-over-Year
➖ In FY23, Visa achieved a remarkable revenue increase of 11.4%, reaching $32.7 billion, up from $29.3 billion in FY22.
➖ The EBITDA for FY23 also saw a significant rise, totalling $22.9 billion compared to $20.6 billion in FY22.
● Quarter-over-Quarter
➖ In the latest June quarter, Visa's revenue rose to $8.9 billion, slightly surpassing the $8.8 billion reported in March 2024. This reflects a year-over-year growth of nearly 9.5% from $8.1 billion in the same quarter last year.
➖ The EBITDA for the most recent June quarter reached $6.2 billion, indicating an almost 9% increase from $5.7 billion in the same quarter last year.
➖ In June, the diluted EPS saw a modest rise, climbing to $9.35 (LTM) from $8.94 (LTM) in March 2024, which represents a notable year-over-year increase of 18.6% from $30.3 (LTM).
2. Mastercard
● Year-over-Year
➖ Mastercard's revenue for FY23 experienced a robust growth of 12.9%, reaching $25.1 billion, up from $22.2 billion in FY22.
➖ The EBITDA for FY23 also increased, reporting $22.9 billion, up from $20.6 billion in FY22.
● Quarter-over-Quarter
➖ In the recent June quarter, Mastercard's revenue climbed to $7.0 billion, compared to $6.3 billion in March 2024. Year-over-year, this marks an increase of nearly 11% from $6.3 billion in the same quarter last year.
➖ The EBITDA for the latest June quarter was $4.4 billion, reflecting an almost 9% rise from $3.9 billion in March 2024.
➖ In June, the diluted EPS saw a slight increase, rising to $13.08 (LTM) from $12.59 (LTM) in March 2024, which is a significant year-over-year increase of 23% from $10.67 (LTM).
3. American Express
● Year-over-Year
➖ For the fiscal year 2023, the company experienced a remarkable revenue growth of 9.7%, reaching an impressive $55.6 billion, compared to $50.7 billion in fiscal year 2022.
➖ Additionally, operating income showed a positive trajectory, with fiscal year 2023 reporting $10.8 billion, an increase from $10 billion in the previous fiscal year.
● Quarter-over-Quarter
➖ In the latest June quarter, revenue continued its upward trend, totalling $15.1 billion, up from $14.5 billion in March 2024. This represents a significant year-over-year growth of nearly 8.7% from $13.9 billion in the June quarter of the previous year.
➖ Furthermore, operating income for the June quarter reached $3.2 billion, marking a substantial increase of almost 19% from $2.7 billion in the same quarter last year.
➖ The diluted earnings per share (EPS) also saw a remarkable rise in June, climbing to $13.39 (LTM) from $12.14 (LTM) in March 2024, which is a significant jump of 36% compared to $9.83 (LTM) in the same quarter last year.
◉ Valuation
● P/E Ratio
➖ Visa stands at a P/E ratio of 29.1x.
➖ Mastercard is at a P/E ratio of 38.7x.
➖ American Express shows a P/E ratio of 20.6x.
➖ When we analyze these figures, it becomes clear that American Express appears significantly undervalued compared to its peers.
● P/B Ratio
➖ Visa has a P/B ratio of 14.3x.
➖ Mastercard's P/B ratio is a staggering 64x.
➖ American Express, however, has a P/B ratio of just 6.8x.
This further reinforces the notion that American Express is currently undervalued in the market.
● PEG Ratio
➖ Visa's PEG ratio is 1.56.
➖ Mastercard's PEG stands at 1.71.
➖ American Express shines with a PEG ratio of just 0.56.
➖ This metric also highlights American Express's superior value proposition compared to its peers.
◉ Cash Flow Analysis
➖ Visa's operating cash flow for the fiscal year 2023 has risen to $20.8 billion, marking a notable increase from $18.8 billion in fiscal year 2022.
➖ Similarly, Mastercard has experienced growth in its operating cash flow, which has reached $12 billion in fiscal year 2023, up from $11.2 billion in the previous year.
➖ In contrast, American Express has reported a significant decline in its operating cash flow, decreasing from $21.1 billion in fiscal year 2022 to $18.6 billion in fiscal year 2023.
◉ Debt Analysis
1. Visa
● Debt to Equity Ratio: Approximately 0.52 as of June 2024, indicating a stable financial structure with moderate leverage.
● Total Debt: About $20.6 billion.
● Total Shareholder Equity: $39.7 billion.
● Analysis: Visa's ratio reflects a cautious debt approach, balancing equity and debt financing, with net debt well-supported by operating cash flow, enhancing financial stability.
2. Mastercard
● Debt to Equity Ratio: Approximately 2.10, indicating a higher reliance on debt compared to Visa 5.
● Total Debt: $15.6 billion.
● Total Shareholder Equity: $7.5 billion.
● Analysis: Mastercard’s higher ratio suggests it is more aggressive in leveraging debt for growth initiatives compared to Visa. This strategy may lead to greater volatility in earnings due to interest obligations.
3. American Express
● Debt to Equity Ratio: Approximately 1.80, indicating a significant level of debt relative to equity 5.
● Total Debt: $53.2 billion.
● Total Shareholder Equity: $29.54 billion.
● Analysis: American Express’s ratio shows a strong reliance on debt financing, which can enhance growth but also introduces risks related to interest payments and market conditions.
◉ Top Shareholders
1. Visa
● The Vanguard Group has notably boosted its investment in Visa, now commanding a remarkable 7.52% share, reflecting a 0.62% increase since the close of the March quarter.
● In contrast, Blackrock maintains a stake of approximately 6.7% in the firm.
2. Mastercard
● When it comes to Mastercard, Vanguard has also made strides, raising its ownership to an impressive 8.27%, which is a 1.02% uptick since the end of March.
● Blackrock, on the other hand, has a substantial 7.56% stake, showing a 1.17% growth from the same period.
3. American Express
● As for American Express, Warren Buffet’s Berkshire Hathaway boasts a significant 21.3% stake in the company.
● Meanwhile, Vanguard holds a 6.36% interest, while Blackrock has a 5.89% share.
◉ Conclusion
After a thorough analysis of both technical and financial indicators, we find that American Express offers a compelling valuation opportunity that is likely to attract investors. Nonetheless, it is important to recognize the significant debt load the company carries, a concern that also extends to Mastercard.
● From a technical standpoint, the chart for American Express seems to be stretched thin. Investors might want to hold off for a corrective dip to secure a more advantageous entry point.
● Mastercard's financial results reflect solid performance, though it carries a high level of debt. The technical chart indicates a slight overvaluation. Savvy investors might look to build their positions during times of price stabilization.
● Visa presents a well-rounded synergy between its technical and fundamental metrics. Its chart reveals a remarkable rebound, approaching previous all-time highs after a notable decline. The company's valuation and growth potential make it a compelling investment choice.

AXP American Express Company Options Ahead of EarningsIf you haven`t bought the dip on AXP:
Now analyzing the options chain and the chart patterns of AXP American Express Company prior to the earnings report this week,
I would consider purchasing the 267.5usd strike price Puts with
an expiration date of 2024-10-18,
for a premium of approximately $2.91.
If these options prove to be profitable prior to the earnings release, I would sell at least half of them.

Buy American ExpressShort Term Trading Advice by Naranj Capital
Buy American Express
● Buy Range- 232 - 236
● Target- 247 - 250
● StopLoss- 227
● Potential Return- 5-6%
● Duration- 14-15 Trading Days

American Express Surges 4.33% on Earnings BeatAmerican Express, a leading financial services corporation, has released its first-quarter results for the year 2021. The company has outperformed the analyst estimates with higher-than-expected revenue, net income, and diluted earnings per share (EPS). The company's net interest income has also been higher than anticipated, thereby avoiding the fate of several other financial firms.
American Express has reaffirmed its full-year guidance for fiscal 2024, projecting significant growth in year-over-year revenue and EPS. The company has projected revenue growth of 9% to 11% and EPS of $12.65 to $13.15 for 2024.
The company's revenue of $15.8 billion in Q1 2021 has exceeded the consensus analyst estimates compiled by Visible Alpha, which was $15.76 billion. The net income of $2.44 billion and diluted EPS of $3.33 have also surpassed the estimates of $2.17 billion and $2.96 per share, respectively.
American Express has reported $3.77 billion of profit in the net interest income metric, which is higher than the market expectation of $3.66 billion. The company's CEO, Stephen Squeri, has attributed the success to the company's ability to attract high-spending, high-credit-quality customers to the franchise. The company has seen strong demand from millennial and Gen Z consumers, who accounted for over 60% of new consumer account acquisitions globally.
The company's shares initially fell 2% in pre-market trading following the earnings report's release before reversing course. The stock has gained about 20% so far this year and is currently up more than 3% at $224.48 as of 10:17 a.m. ET.
Last month, American Express ( NYSE:AXP ) announced an increase in its quarterly dividend to 70 cents per share, up from the previous mark of 60 cents.
In conclusion, American Express ( NYSE:AXP ) has exceeded the market's expectations with its Q1 2021 results and reaffirmed its full-year growth guidance for 2024. The company's ability to attract high-spending, high-credit-quality customers and strong demand from millennial and Gen Z consumers suggests a promising future for the corporation.

AXP American Express Company Options Ahead of EarningsIf you haven`t bought the dip on AXP:
Then analyzing the options chain and the chart patterns of AXP American Express prior to the earnings report this week,
I would consider purchasing the 185usd strike price Puts with
an expiration date of 2024-9-20,
for a premium of approximately $3.45.
If these options prove to be profitable prior to the earnings release, I would sell at least half of them.

Financial Titans Stocks: Macro Fib SchematicsThese are the largest financial institutions in the world. BlackRock, BlackStone, State Street Corporation, American Express Company. CME Group, NY Bank of Mellon Corporation, and Vangaurd. This is not a Bank Sector Idea. This is a Financial Conglomerate type of idea rather than individual banks. Because these companies realistically OWN the banks.
BlackRock, State Street, and Vanguard are the main three who own most of the stocks and therefore many percentages of tons companies.
-The "Dot Com" means they were formed from the Dot Com Bubble.
-The Collapse of the Bretton Woods System was in 1973. This is where we switched from a gold standard to the dollar standard.
-Black Monday of 1987 was a global market crash which was blamed on Computer Algorithms... HINT HINT: What you are looking at. "algorithms don't describe it well enough.

Honda Bull After earnings or before ? Strong Performance: Honda Motor shares have shown solid relative strength over the last month, tacking on nearly 6% and outperforming the S&P 5001.
Positive Earnings Estimate Revisions: The shares are looking to break out of a multi-year consolidation period, with positive earnings estimate revisions helping drive the move1.
Strong Sales in North America: Honda posted stronger-than-expected earnings for its fiscal second quarter ended September, boosted by strong auto sales in North America2.
Analyst Upgrades: There have been several analyst upgrades for Honda Motor stock. For instance, Morgan Stanley upgraded the stock from Equal Weight to Overweight3. Similarly, Macquarie upgraded the stock from Neutral to Outperform3.
Price Target: While the consensus price target is not available, the stock is currently trading at $32.44
TP 35

American Express Q4 Earnings Report: Navigating Challenges
American Express (NYSE: NYSE:AXP ) recently released its fourth-quarter earnings report, showcasing a mix of positive and challenging developments. While the financial giant reported solid earnings growth and increased quarterly dividends, concerns have surfaced regarding a notable uptick in net write-offs. This article delves into the key aspects of American Express' Q4 performance, providing a comprehensive analysis of the company's financial health, dividend strategy, and market response.
Earnings Performance:
In the fourth quarter of 2023, American Express ( NYSE:AXP ) reported net income of $1.9 billion, a substantial increase from the year-ago figure of $1.6 billion. The per-share earnings also demonstrated growth, rising from $2.07 to $2.62. Despite these positive strides, the reported earnings fell slightly short of Street estimates, with the consensus expecting $2.64 per share.
Provisions for Credit Losses:
A notable concern in the report was the 40% annualized increase in provisions for credit losses, totaling $1.4 billion. This suggests a continued rise in net write-offs, indicating potential challenges in managing credit risk. The increase in credit loss provisions has raised eyebrows among investors and analysts alike, prompting a closer examination of the company's risk management strategies.
Dividend Increase:
American Express ( NYSE:AXP ) sought to balance concerns about credit losses by announcing a 17% increase in its quarterly dividend, now set at 70 cents per share. This move is aimed at rewarding shareholders and instilling confidence in the company's financial stability. The stock market responded positively to this news, with NYSE:AXP experiencing an uptick of close to 40% from its low in late October.
Revenue and Expenses:
The Q4 report revealed consolidated total revenues net of interest expense at $15.8 billion, reflecting an 11% increase from the previous year. The growth was primarily driven by higher net interest income and increased Card Member spending. However, expenses also rose by 5%, reaching $11.9 billion, attributed to higher customer engagement costs and other factors.
Segment-wise Analysis:
Breaking down the performance by business segments, U.S. Consumer Services reported a pretax income increase, but provisions for credit losses also surged. Commercial Services and International Card Services showed mixed results, with varying impacts on credit losses and expenses. Global Merchant and Network Services reported positive growth in pretax income and revenues, while Corporate and Other faced a pretax loss.
Future Outlook:
Despite the challenges reflected in the Q4 report, American Express ( NYSE:AXP ) remains optimistic about its future. The company forecasts up to 11% annualized growth in revenue and anticipates per-share earnings in the range of $12.65 to $13.15 for Q4. This outlook exceeds analyst expectations, with consensus estimates at $12.38 per share.
Conclusion:
American Express' ( NYSE:AXP ) Q4 earnings report paints a nuanced picture of the company's performance. While grappling with increased credit losses, the strategic move to boost dividends showcases management's commitment to shareholder value. Investors are likely to closely monitor how American Express ( NYSE:AXP ) addresses the challenges highlighted in the report and executes its growth plans in the coming quarters.

🏧 Focus on American Express Co. stocks. 23/10/2023American Express Co. recorded net profit above analysts' expectations. In Q3 2023, the company's net profit reached 2.45 billion USD compared to 1.88 billion USD in Q3 2022. Market expectations were only at 2.19 billion USD. American Express is optimistic about the future and notes that current performance is much better than pre-pandemic levels.
Therefore, today, we focus on the American Express Co. (NYSE: AXP) stock chart.
On the D1 timeframe, resistance has formed at 154.79 without clear support.
On the H1 timeframe, if quotes return beyond 144.29, the short-term target for the price increase will be around 154.55; while in the medium term, it could reach 179.12.
—
Ideas and other content presented on this page should not be considered as guidance for trading or an investment advice. RoboMarkets bears no responsibility for trading results based on trading opinions described in these analytical reviews.
The material presented and the information contained herein is for information purposes only and in no way should be considered as the provision of investment advice for the purposes of Investment Firms Law L. 87(I)/2017 of the Republic of Cyprus or any other form of personal advice or recommendation, which relates to certain types of transactions with certain types of financial instruments.
Risk Warning: CFDs are complex instruments and come with a high risk of losing money rapidly due to leverage. 67.85% of retail investor accounts lose money when trading CFDs with this provider. You should consider whether you understand how CFDs work and whether you can afford to take the high risk of losing your money.

AXP American Express Company Options Ahead of EarningsAnalyzing the options chain and the chart patterns of AXP American Express Company prior to the earnings report this week,
I would consider purchasing the 155usd strike price Calls with
an expiration date of 2024-1-19,
for a premium of approximately $7.05.
If these options prove to be profitable prior to the earnings release, I would sell at least half of them.
Looking forward to read your opinion about it.

American Express ($APX): Elliott Waves Analysis and Sell SetupThe American Express ($AXP) Main Trend is absolutely bullish, therefore we currently consider all descents as simple corrective structures of the trend in play. But why am I saying that? Because when you decide to take a position not following the trend, the risk is high, so logic tells us to use a smaller size, at least initially (...there's always time to increase it!). Having said that, the strategy I want to share with you is very simple: "Try to take a short position on breakout" , with stop loss above the previous swing (don't look at the levels on the chart, they are only indicative at the moment). Of course, a second option (yellow arrow) is also possible, but to do this you would need to be a little more expert. The potential target areas are the first around 119.50 and the second around 106.50 (my favorite).
Looking at the chart above (daily time frame) we can see how the potential short trade also has a good Risk/Reward ratio, and this makes this trade interesting.
I also take the opportunity to thank every Trader who supported me in the last setups on Stocks Market:
$AMAZON BULLISH SETUP
(Click and Play on Chart below)
$TESLA BEARISH SETUP
(Click and Play on Chart below)
Trade with care! 👍 ...and if you think that my analysis is useful, please..."Like, Share and Comment" ...thank you! 💖
Cheers!
N.B.: Support my idea for next updates below 🚀

Long American ExpressWhy buy American express?
1 - because I said so
2 - It's an American Bank who respects Julius Caesar more then Canadian banks
3 - It's on a clear uptrend
4 - ask Chat GPT to dumb down for you the theory of reflexivity by George no Soros
5 - I said so
6 - the price is holding above the 23.6% Fibonacci (God's math) retracement level
7 - because I said so
8 - it's undervalued from a Fundamentals point of vue and they invest in blockchain companies (most banks don't bother)
9 - They paid for my baller 1st class Lufthansa ticket to Paris with stop in Munich, Hostel Costes with supermodels Sep 2-5 and Hotel du Palais in Biarritz that my grandson once built for his love Princess Eugene

AXP WEEKLY (AMERICAN EXPRESS COMPANY)RULES:
-If price break Point 2, 4, 6, or 8 cancel the setup
-Price needs to break Point 1, 3, 5, or 7 to confirm the setup
When price reach the 100FE(BLUE BOX) it normally does a pullback/retest or reversal
The market can Truncate(fall short)

American Express rises amid negative pressuresAmerican Express's stock (AXP) rose in the intraday levels, touching the resistance of the 50-day SMA, amid the dominance of the main downward trend in the short term, while the RSI reached overbought levels.
Therefore we expect the stock to return lower, targeting the first support at 142.72, provided the resistance of 153.84 holds on.
