Andhra Sugars Ltd - Weekly Chart📊 Andhra Sugars Ltd – Trendline Breakout on Weekly Chart 🚀
📅 Chart Date: October 12, 2025 | Timeframe: Weekly
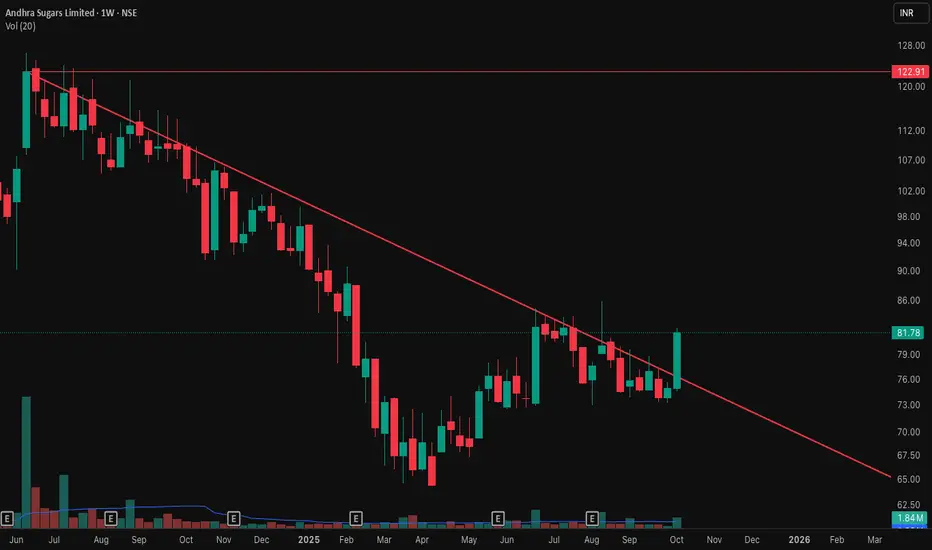
📈 CMP: ₹81.78 (+9.01%)
📍 Symbol: NSE:ANDHRSUGAR
🔍 Technical Analysis
📉 Downtrend Line Broken After Months of Consolidation
The stock had been trading under a strong falling trendline since mid-2024.
This week’s bullish candle successfully closed above the trendline, indicating a potential reversal from the long-term downtrend.
💥 Volume Confirmation
Noticeable rise in weekly volume (1.84M) compared to the recent average of 1.06M, showing buying interest emerging from the support zones.
🟡 Key Resistance Level: ₹122.91 (previous swing high from June 2024).\
A breakout and weekly close above ₹123 could confirm a major trend reversal and open up higher targets.
📌 Key Levels
Immediate Support (Breakout Retest Zone): ₹75–₹77
Resistance Zone: ₹122.91
Next Targets: ₹95 / ₹110 / ₹123
Stoploss (Weekly Close Basis): ₹70
⚠️ Disclaimer
This analysis is for educational and charting purposes only. Not financial advice. Please do your own research before making any investment decisions.
Andhrasugar
ANDHARA SUGARLong above 151 levels Now TSI and VI shows positive moment even trading above Hull moving avg, so it is clear signal for long. So can wait for signal candle high cross then enter for upside move

ANDHARA SUGARStocks seems will come to momentum in a week so for positional basis we can hold this stock for atleat 10-20% momentum balance in this counter.

Longterm buy opportunity in AndhrasugarCup and Handle Position formed. The view is to keep accumulating till 145 levels. Target levels are given on the chart
