#APE/USDT chart (1-hour timeframe)#APE
The price is moving within a descending channel on the hourly timeframe. It has reached the lower boundary and is heading towards a breakout, with a retest of the upper boundary expected.
The Relative Strength Index (RSI) is showing a downward trend, approaching the lower boundary, and an upward bounce is anticipated.
There is a key support zone in green at 0.1831, and the price has bounced from this level several times and is expected to bounce again.
The indicator is showing a trend towards consolidation above the 100-period moving average, which we are approaching, supporting the upward move.
Entry Price: 0.1846
First Target: 0.1867
Second Target: 0.1900
Third Target: 0.1943
Stop Loss: Below the green support zone.
Remember this simple thing: Money management.
For any questions, please leave a comment.
Thank you.
APEBTC

#APE/USDT chart (1-hour timeframe)#APE
The price is moving in a descending channel on the 1-hour timeframe. It has reached the lower boundary and is heading towards breaking above it, with a retest of the upper boundary expected.
We have a downtrend on the RSI indicator, which has reached near the lower boundary, and an upward rebound is expected.
There is a key support zone in green at 0.2412. The price has bounced from this zone multiple times and is expected to bounce again.
We have a trend towards consolidation above the 100-period moving average, as we are moving close to it, which supports the upward movement.
Entry price: 0.2453
First target: 0.2500
Second target: 0.2565
Third target: 0.2652
Don't forget a simple principle: money management.
Place your stop-loss order below the green support zone.
For any questions, please leave a comment.
Thank you.

FireHoseReel | APE at a Critical Breakout Point🔥 Welcome To FireHoseReel !
Let’s dive into APE analysis.
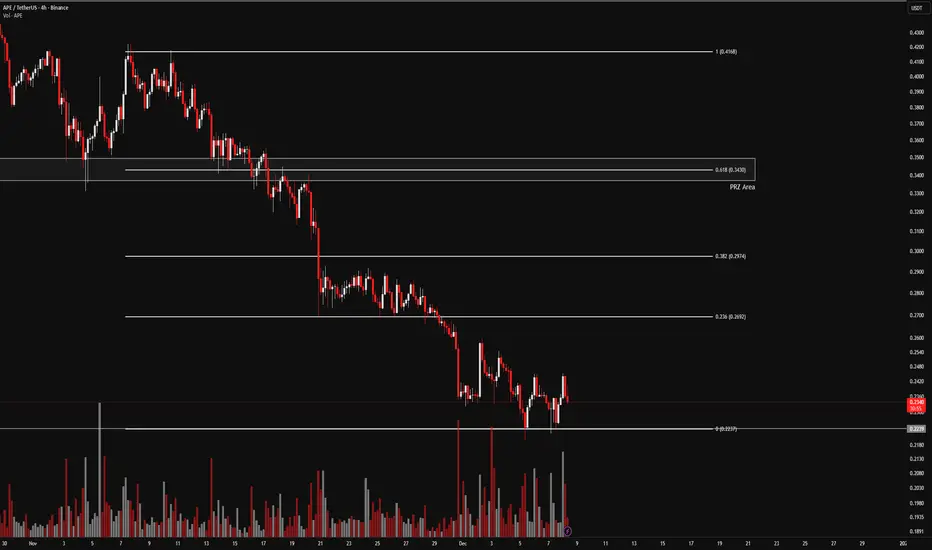
👀 APE 4H Overview
APE remains bearish across most higher timeframes. We’ve applied a Fibonacci retracement on the last 4H bearish leg, which has highlighted several key levels. A break below the current low signals continuation of the downtrend, while a breakout above the PRZ zone would act as the best bullish trigger.
📊 Volume Analysis
APE volume has increased as price reached this zone. This rise in volume suggests that whales may be defending lower prices. If the floor breaks, heavy liquidations and spot selling could follow.
✍️ APE Trading Scenarios
🟢 Long Scenario:
A breakout above the PRZ at $0.343, supported by strong buy volume, could activate a long trigger. Prefer entries on the second or third test of the breakout.
🔴 Short Scenario:
A breakdown of the current base with strong selling pressure and whale capitulation could push price lower. The main short trigger lies below $0.2237.
🧠 Protect your capital first. No setup is worth blowing your account. If risk isn’t controlled, profit means nothing. Trade with rules, not emotions.
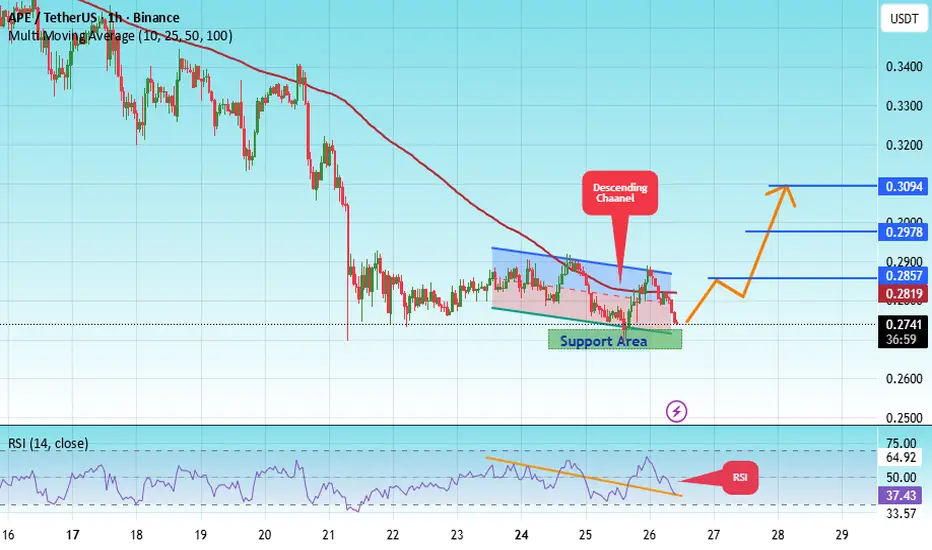
#APE/USDT chart (1-hour timeframe)#APE
The price is moving within an ascending channel on the 1-hour timeframe and is adhering to it well. It is poised to break out strongly and retest the channel.
We have a downtrend line on the RSI indicator that is about to break and retest, which supports the upward move.
There is a key support zone in green at 0.2650, representing a strong support point.
We have a trend of consolidation above the 100-period moving average.
Entry price: 0.2700
First target: 0.2857
Second target: 0.2978
Third target: 0.3094
Don't forget a simple money management rule:
Place your stop-loss order below the support zone in green.
Once you reach the first target, save some money and then change your stop-loss order to an entry order.
For any questions, please leave a comment.
Thank you.
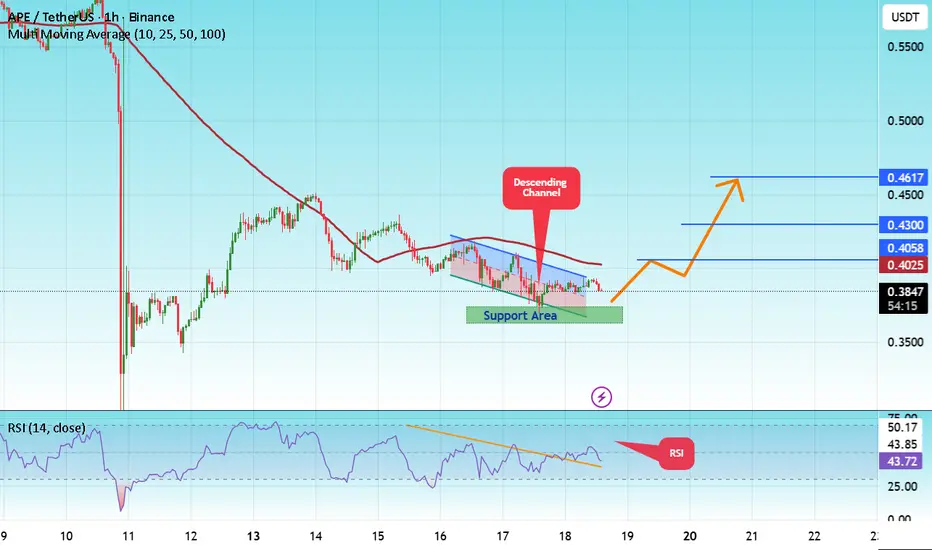
#APE/USDT chart (1-hour timeframe)#APE
The price is moving in an ascending channel on the 1-hour frame, adhering well to it, and heading for a strong breakout and retest.
We have a bearish trend on the RSI indicator that is about to be broken and retested, which supports the upward breakout.
There is a major support area in green at 0.4330, which represents a strong support point.
We are heading for consolidation above the 100 moving average.
Entry price: 0.4336
First target: 0.4500
Second target: 0.4600
Third target: 0.4736
Don't forget a simple matter: capital management.
When you reach the first target, save some money and then change your stop-loss order to an entry order.
For inquiries, please leave a comment.
Thank you.

#APE/USDT chart (1-hour timeframe)...#APE
The price is moving in a descending channel on the 1-hour frame and is expected to break and continue upward.
We have a trend to stabilize above the 100 moving average once again.
We have a downtrend on the RSI indicator that supports the upward move with a breakout.
We have a major support area in green that pushed the price higher at 0.680.
Entry price: 0.3857.
First target: 0.4058.
Second target: 0.4300.
Third target: 0.4617.
To manage risk, don't forget stop loss and capital management.
When you reach the first target, save some profits and then change the stop order to an entry order.
For inquiries, please comment.
Thank you.
#APE/USDT#APE
The price is moving within a descending channel on the 1-hour frame, adhering well to it, and is heading for a strong breakout and retest.
We are seeing a bounce from the lower boundary of the descending channel, which is support at 0.5060.
We have a downtrend on the RSI indicator that is about to be broken and retested, supporting the upward trend.
We are looking for stability above the 100 moving average.
Entry price: 0.5386
First target: 0.5528
Second target: 0.5720
Third target: 0.5887

#APE/USDT#APE
The price is moving within a descending channel on the 1-hour frame, adhering well to it, and is heading for a strong breakout and retest.
We are seeing a bounce from the lower boundary of the descending channel, which is support at 0.4548.
We have a downtrend on the RSI indicator that is about to be broken and retested, supporting the upward trend.
We are looking for stability above the 100 moving average.
Entry price: 0.4875
First target: 0.4718
Second target: 0.4794
Third target: 0.4875

#APE/USDT#APE
The price is moving within a descending channel on the 1-hour frame, adhering well to it, and is heading for a strong breakout and retest.
We are seeing a bounce from the lower boundary of the descending channel, which is support at 0.4040.
We have a downtrend on the RSI indicator that is about to be broken and retested, supporting the upward trend.
We are looking for stability above the 100 moving average.
Entry price: 0.4122
First target: 0.4223
Second target: 0.4330
Third target: 0.4464

APE Analysis | Lost in the Jungle or Making a Comeback? (1D)The larger-degree APE pattern appears to be a large symmetrical triangle, and we are currently in the G wave of this pattern. The G wave is bearish, and within the G wave, we can also observe a smaller-degree symmetrical triangle.
It seems we are nearing the final leg of this pattern, and we expect one more drop from the red box. If the price reaches the green zone, we may have a low-risk opportunity to enter a buy position.
Potential targets are marked on the chart.
A daily candle closing below the invalidation level would invalidate this outlook.
For risk management, please don't forget stop loss and capital management
When we reach the first target, save some profit and then change the stop to entry
Comment if you have any questions
Thank You

#APE/USDT Ready to go higher#APE
The price is moving in a descending channel on the 1-hour frame and sticking to it well
We have a bounce from the lower limit of the descending channel, this support is at 0.950
We have a downtrend on the RSI indicator that is about to be broken, which supports the rise
We have a trend to stabilize above the 100 moving average
Entry price 1.10
First target 1.28
Second target 1.52
Third target 1.73

APEUSDT - Huge Potential LongI love this setup here for a long entry. Massive volume is coming into APE, which with the launch of Apechain has a huge amount of potential. If you haven't checked out their site www.apechain.com you will see what I'm talking about.

APE will be bullish againThe APE correction seems to have been a diamond diametric as we are now at the end of the G wave.
This correction was wave B. Expect a C wave for APE.
Wave C will be bullish.
Closing a daily candle below the invalidation level will violate this analysis.
For risk management, please don't forget stop loss and capital management
Comment if you have any questions
Thank You

#APE (SPOT- Investing ) entry (0.60 - 0.830). SL (0.475)entry range ( 0.60 - 0.830)
SL .Daily close below (0.475)
**NOTES***
1* this coin is very heavy, it may take long time to achieve the targets and the targets is for the BULL RUN
2* collect the coin slowly in the entry range ( do not all in one time in one price )
***********************************************************
BINANCE:APEUSDT
#APE
#APEUSDT
#APEUSD
#swingtrade
#shortterminvestment
#ALTCOIN
#Cryptotading
#cryptoinvesting
#investment
##trading
#cryptocurrencytrading
#bitcoininvestments
#Investing_Coins
#Investingcoins
#Crypto_investing
#Cryptoinvesting
**** #Manta ,#OMNI, #DYM, #AI, #IO, #XAI , #ACE #NFP #RAD #WLD #ORDI #BLUR #SUI #Voxel #AEVO #VITE #APE ****
#bitcoin
#BTC
#BTCUSDT

#APE/USDT#APE
The price is moving in a downward channel on the 12-hour frame upwards and is expected to continue
We have a trend to stabilize above the moving average 100 again
We have a downward trend on the RSI indicator that supports the rise by breaking it upwards
We have a support area at the lower limit of the channel at a price of 1.00
Entry price 1.095
First target 1.34
Second target 1.52
Third target 1.70

APE: stop buy📊Analysis by AhmadArz:
🔍Entry: 1.315
🛑Stop Loss: 1.257
🎯Take Profit: 1.345 -1.419 -1.536
🔗"Uncover new opportunities in the world of cryptocurrencies with AhmadArz.
💡Join us on TradingView and expand your investment knowledge with our five years of experience in financial markets."
🚀Please boost and💬 comment to share your thoughts with us!

#APE/USDT#APE
The price is moving in a bearish channel on a 4-hour frame and is adhering to it well. The price has rebounded from the green zone and is expected to retest it at the price of $1.0
We have a tendency to stabilize above the Moving Average 100
We have an uptrend on the RSI indicator to support the rise
Entry price is 1.00
The first goal is 1.32
The second goal is 1.50
The third goal is 1.75

APE ANALYSIS (1D)APE appears to be forming a large triangle.
Now it seems that the big wave C is over and we are in the waves of wave D.
From the green range, I expect a trend change for APE.
The targets are clear on the chart.
Closing a daily candle below the invalidation level will violate the analysis
For risk management, please don't forget stop loss and capital management
When we reach the first target, save some profit and then change the stop to entry
Comment if you have any questions
Thank You

#APE/USDT#APE
The price has been moving in a down channel since July 2022
The price adhered to the boundaries of that channel perfectly
Now we have an upward trend on two levels
Current price 1.70
First goal 3.44
Second goal 5.14

APE LOOKS BULLISHThe structure is such that it is Boolean. We have an ascending iCH and iBOS on the chart and the candles have broken the trigger line.
In the upper part of the chart, we have a liquidity pool that the price seems to be trying to sweep.
It can be pumped while maintaining the green range.
Closing a daily candle below the invalidation level will violate the analysis
For risk management, please don't forget stop loss and capital management
Comment if you have any questions
Thank You

APE UPDATE (4H)This analysis is an update of the analysis that you can see at the bottom of this page, in the related analysis section
APE has some weakness in momentum. With recent data, its wave scenario has become more clear.
It seems to be inside a diametric that is now in the F wave of this diametric.
Wave F is expected to end in the green range and then APE will enter a bullish wave G.
TP is marked on the picture.
Closing a daily candle below the green range will violate the analysis
For risk management, please don't forget stop loss and capital management
Comment if you have any questions
Thank You

APE Has broken above 1.850APE Has broken above 1.850, the pullback might be very short due to the strong Bullish engulfing candle.
🔵Entry Zone 1.769 - 1.835
🔴SL 1.6361
🟢TP1 1.9198
🟢TP2 2.1440
🟢TP3 2.3661
Risk Warning
Trading Forex, CFDs, Crypto, Futures, and Stocks involve a risk of loss. Please consider carefully if such trading is appropriate for you. Past performance is not indicative of future results.
If you liked our ideas, please support us with your likes 👍 and comments.

APEBTC.4HBased on the given market data, it appears that the APE/BTC pair is currently trading in a moderately bearish zone. The current price of 0.000032 is slightly above the 4-hour support level of 0.000031 and below the 4-hour resistance level of 0.000035. This indicates that the market is somewhat volatile and there is a possibility of a price swing in either direction.
The 4-hour RSI (Relative Strength Index) is at 40.51, which suggests that the market is neither overbought nor oversold. This neutral RSI value indicates that there is no clear buying or selling pressure at the moment.
The 4-hour MACD (Moving Average Convergence Divergence) is at 41.0, which is above the signal line and indicates bullish momentum. However, the 1-day MACD is at 49.0, which is relatively high and might indicate overbought conditions, suggesting a potential price correction.
The 7-day RSI is quite low at 29.28, indicating that the market is oversold over a longer timeframe. This could suggest a potential upward price movement in the near future.
In conclusion, the market situation for APE/BTC appears to be mixed. While some indicators suggest a bullish momentum, others indicate a potential price correction. Therefore, investors should proceed with caution and consider their risk tolerance and investment objectives before making a decision. As always, market conditions can change rapidly, and it's essential to stay updated with the latest market trends and news.
