#APE/USDT chart (1-hour timeframe)#APE
The price is moving in a descending channel on the 1-hour timeframe. It has reached the lower boundary and is heading towards breaking above it, with a retest of the upper boundary expected.
We have a downtrend on the RSI indicator, which has reached near the lower boundary, and an upward rebound is expected.
There is a key support zone in green at 0.2412. The price has bounced from this zone multiple times and is expected to bounce again.
We have a trend towards consolidation above the 100-period moving average, as we are moving close to it, which supports the upward movement.
Entry price: 0.2453
First target: 0.2500
Second target: 0.2565
Third target: 0.2652
Don't forget a simple principle: money management.
Place your stop-loss order below the green support zone.
For any questions, please leave a comment.
Thank you.
APEUSD

FireHoseReel | APE at a Critical Breakout Point🔥 Welcome To FireHoseReel !
Let’s dive into APE analysis.
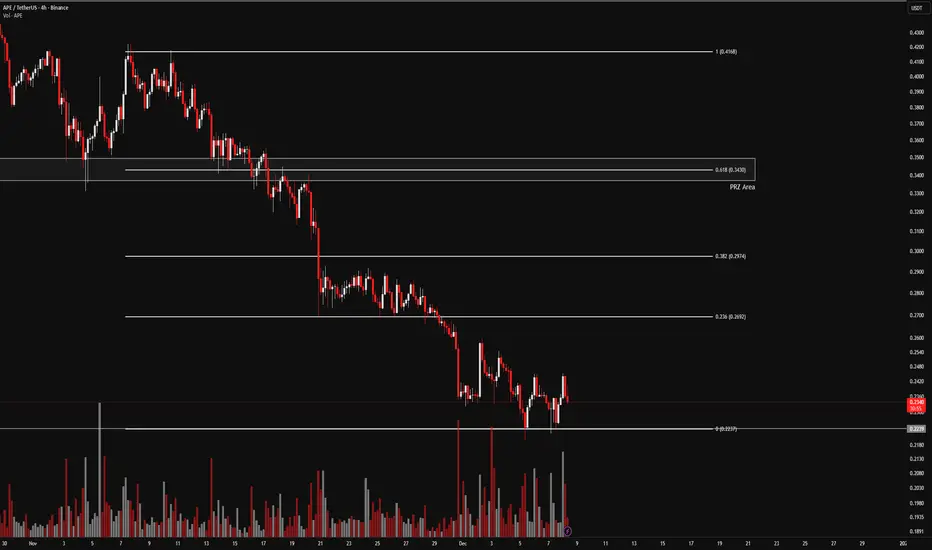
👀 APE 4H Overview
APE remains bearish across most higher timeframes. We’ve applied a Fibonacci retracement on the last 4H bearish leg, which has highlighted several key levels. A break below the current low signals continuation of the downtrend, while a breakout above the PRZ zone would act as the best bullish trigger.
📊 Volume Analysis
APE volume has increased as price reached this zone. This rise in volume suggests that whales may be defending lower prices. If the floor breaks, heavy liquidations and spot selling could follow.
✍️ APE Trading Scenarios
🟢 Long Scenario:
A breakout above the PRZ at $0.343, supported by strong buy volume, could activate a long trigger. Prefer entries on the second or third test of the breakout.
🔴 Short Scenario:
A breakdown of the current base with strong selling pressure and whale capitulation could push price lower. The main short trigger lies below $0.2237.
🧠 Protect your capital first. No setup is worth blowing your account. If risk isn’t controlled, profit means nothing. Trade with rules, not emotions.
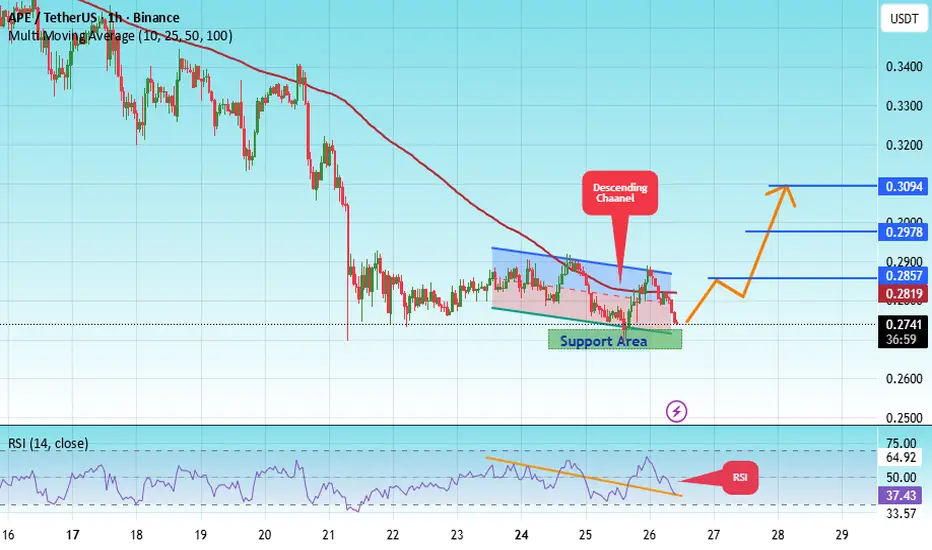
#APE/USDT chart (1-hour timeframe)#APE
The price is moving within an ascending channel on the 1-hour timeframe and is adhering to it well. It is poised to break out strongly and retest the channel.
We have a downtrend line on the RSI indicator that is about to break and retest, which supports the upward move.
There is a key support zone in green at 0.2650, representing a strong support point.
We have a trend of consolidation above the 100-period moving average.
Entry price: 0.2700
First target: 0.2857
Second target: 0.2978
Third target: 0.3094
Don't forget a simple money management rule:
Place your stop-loss order below the support zone in green.
Once you reach the first target, save some money and then change your stop-loss order to an entry order.
For any questions, please leave a comment.
Thank you.
APE near Trendline Support APE Tried to break Trendline Support but bounced from Strong Static Support
Wait for Breakdown and Retest!

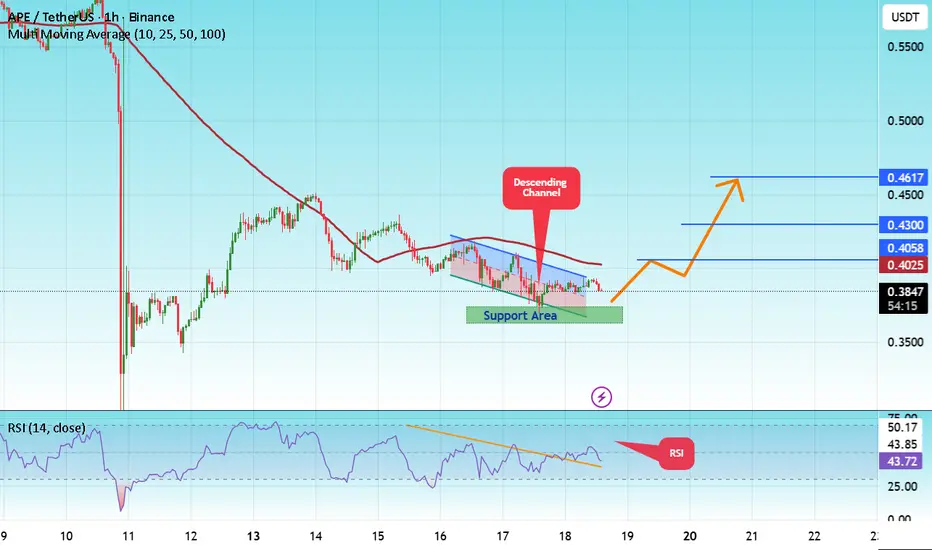
#APE/USDT chart (1-hour timeframe)#APE
The price is moving in an ascending channel on the 1-hour frame, adhering well to it, and heading for a strong breakout and retest.
We have a bearish trend on the RSI indicator that is about to be broken and retested, which supports the upward breakout.
There is a major support area in green at 0.4330, which represents a strong support point.
We are heading for consolidation above the 100 moving average.
Entry price: 0.4336
First target: 0.4500
Second target: 0.4600
Third target: 0.4736
Don't forget a simple matter: capital management.
When you reach the first target, save some money and then change your stop-loss order to an entry order.
For inquiries, please leave a comment.
Thank you.

APE Analysis (2H)This is one of the coins that hasn’t shown any significant upward movement after the market’s heavy dump. In such cases, it’s better to look for the origin of potential moves. From a wave perspective, it seems to be forming a triangle, which could start from the green zone of wave E. Therefore, we’ll be looking for buy/long positions around the green zone.
Targets are marked on the chart.
A 4-hour candle closing below the invalidation level will invalidate this analysis.
For risk management, please don't forget stop loss and capital management
When we reach the first target, save some profit and then change the stop to entry
Comment if you have any questions
Thank You

#APE/USDT chart (1-hour timeframe)...#APE
The price is moving in a descending channel on the 1-hour frame and is expected to break and continue upward.
We have a trend to stabilize above the 100 moving average once again.
We have a downtrend on the RSI indicator that supports the upward move with a breakout.
We have a major support area in green that pushed the price higher at 0.680.
Entry price: 0.3857.
First target: 0.4058.
Second target: 0.4300.
Third target: 0.4617.
To manage risk, don't forget stop loss and capital management.
When you reach the first target, save some profits and then change the stop order to an entry order.
For inquiries, please comment.
Thank you.
APE Main trend. Channel. Wedge. Reversal zones 05 05 2025Logarithm. Time frame 1 week.
1️⃣ Decline from the maximum by -98% , which is acceptable for assets of such liquidity and capitalization, after that either a trend reversal (main), or a complete scam.
2️⃣X (twitter) of this crypto project has 473 thousand subscribers . This army will be sent to pump this cryptocurrency at the right time in the so-called 3rd alt season of this cycle.
🟣And now work with a breakout of the descending wedge, and the price movement to the resistance of the descending channel. The percentage locally - medium-term showed for clarity from two zones - scenarios.
3️⃣The third plus is that this cryptocurrency is traded on 4 liquid exchanges: binance, bybit, okx, and most importantly Coinbase.
Line chart (trend direction and liquidity).

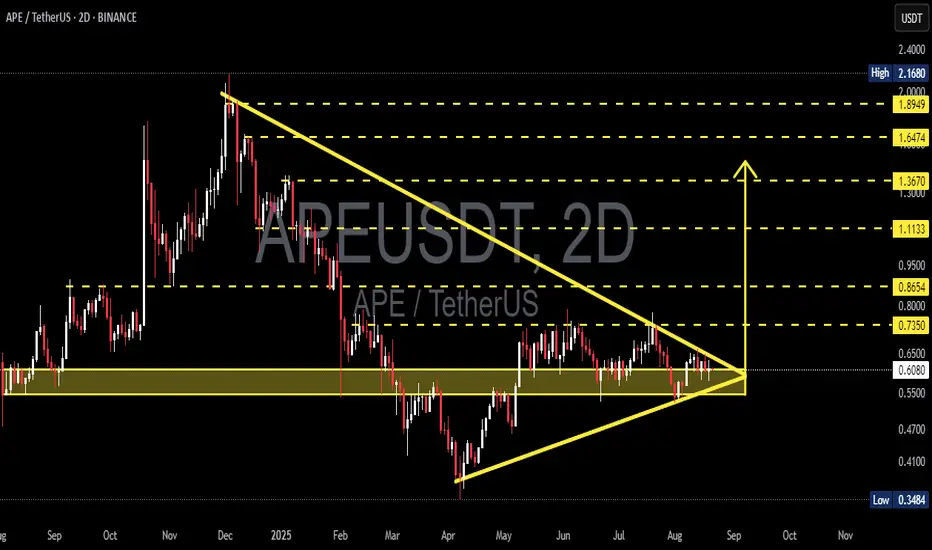
APE/USDT: Symmetrical Triangle – The Next Big Move is Loading!📊 Market Context:
APE/USDT is currently consolidating after a sharp move from the $2.168 high down to the $0.3484 low. The price action has now formed a symmetrical triangle, signaling compressed volatility and accumulation phase.
The $0.52 – $0.62 demand zone remains the critical support, while the long-term descending resistance line (from Dec 2024) is the key barrier that must be broken to unlock further upside potential.
---
🔶 Pattern & Technical Structure:
Main Pattern: Symmetrical Triangle (neutral, often continuation).
Key Support Zone: $0.52 – $0.62.
Immediate Resistance: $0.735 as the first breakout confirmation.
Next Resistances: $0.8654 – $1.1133 – $1.3670 – $1.6474 – $1.8949.
Major Levels: $0.3484 (low) and $2.1680 (high).
---
🚀 Bullish Scenario
If APE breaks above with a 2D candle close > $0.735 and strong volume:
Step Targets:
$0.8654 (minor resistance)
$1.1133 (major resistance)
$1.3670 (mid-range target)
Measured-Move Target (triangle projection): $2.43 – $2.55.
Extra Confirmation: a retest of the descending trendline turning into support would strengthen the bullish case.
---
🔻 Bearish Scenario
If APE breaks down below the $0.52 demand zone:
First Target: $0.3484 (previous low).
Extended Target: $0.25 psychological support.
Risk Factor: A confirmed break below $0.3484 may extend the bearish cycle much deeper.
---
⚖️ Conclusion & Key Notes
APE is currently at a critical crossroad, with the symmetrical triangle nearing its apex. The next breakout or breakdown will dictate the medium-term trend.
For traders, this is a “wait & see with confirmation” phase, as the reward–risk ratio can be very attractive in both directions. The best approach is to wait for a 2D candle close + volume breakout + potential retest to avoid false signals.
#APE #APEUSDT #CryptoAnalysis #SymmetricalTriangle #Altcoin #PriceAction #BreakoutSetup #CryptoTrading
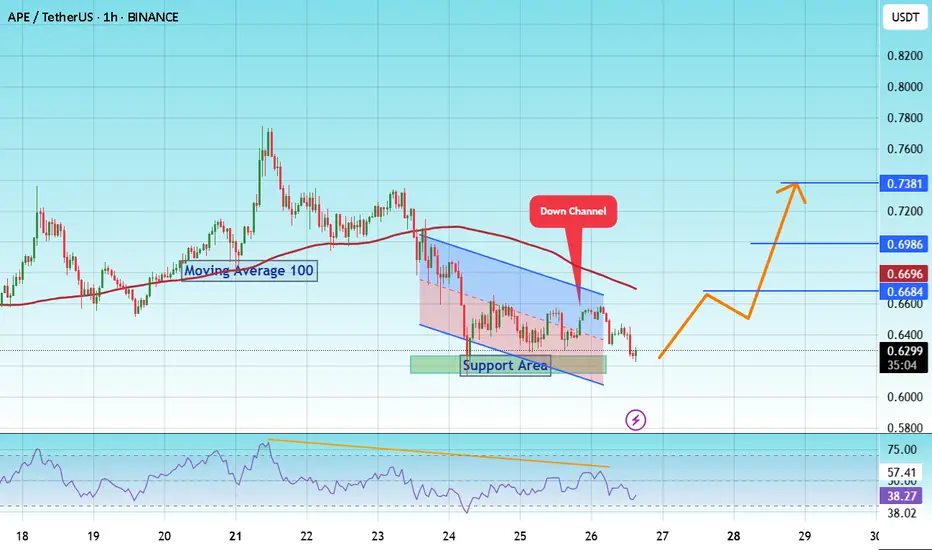
#APE/USDT Low Risk vs High Rewards#APE
The price is moving within a descending channel on the 1-hour frame and is expected to break and continue upward.
We have a trend to stabilize above the 100 moving average once again.
We have a downtrend on the RSI indicator that supports the upward break.
We have a support area at the lower limit of the channel at 0.6080, acting as strong support from which the price can rebound.
We have a major support area in green that pushed the price upward at 0.6180.
Entry price: 0.6300
First target: 0.6633
Second target: 0.6986
Third target: 0.7380
To manage risk, don't forget stop loss and capital management.
When you reach the first target, save some profits and then change your stop order to an entry order.
For inquiries, please comment.
Thank you.
ApeCoin Quick Update —Moving Next#APE
The price is moving within a descending channel on the 1-hour frame, adhering well to it, and is heading for a strong breakout and retest.
We have a bounce from the lower boundary of the descending channel, this support at 0.5827.
We have a bearish trend on the RSI indicator that is about to be broken and retested, supporting the upside.
There is a major support area in green at 0.5600, which represents a strong basis for the upside.
Don't forget a simple thing: ease and capital.
When you reach the first target, save some money and then change your stop-loss order to an entry order.
For inquiries, please leave a comment.
We have a trend to hold above the 100 Moving Average.
Entry price: 0.6000.
First target: 0.6194.
Second target: 0.6378.
Third target: 0.6612.
Don't forget a simple thing: ease and capital.
When you reach the first target, save some money and then change your stop-loss order to an entry order.
For inquiries, please leave a comment.
Thank you.

APE coin cup & Handle. This chart shows good potential as the #Alts start to take back center stage form #BTC
neckline around 79c
could be a triple if Alts can sustain an uptrend.
it's been a while
but the time is now
if it is to be the case.

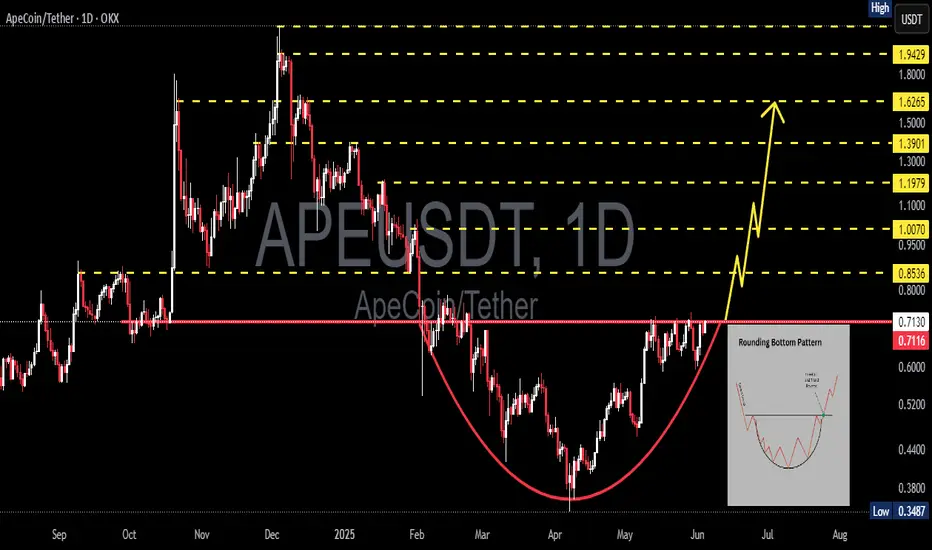
APEUSDT Poised for a Breakout! Cup & Handle Pattern Forming"Classic Pattern in a Bearish Market – A Big Move is Brewing!"
🧠 Technical Analysis Summary:
On the APE/USDT daily chart, we can clearly identify a Cup and Handle pattern, a classic bullish reversal structure that often signals the beginning of a significant rally. While many traders may be discouraged by the recent sideways movement, this formation indicates that smart money accumulation is happening quietly behind the scenes.
📌 Pattern Structure Breakdown:
🔴 The Cup:
Formed after a steep drop in late 2024, followed by a smooth rounded bottom that developed through May 2025.
The "U-shape" indicates a healthy recovery and accumulation phase, often seen before major trend reversals.
🟡 The Handle:
Currently forming a descending channel or bullish flag, representing a consolidation phase or "shakeout" before the next upward impulse.
This is typically the final dip before breakout in classic Cup & Handle formations.
📈 Key Resistance:
The yellow downward trendline is the neckline of the pattern.
A breakout above the $0.63–$0.65 zone will confirm the pattern and potentially spark a major move upward.
✅ Bullish Scenario (Upside Potential):
If a breakout is confirmed with strong volume and a daily candle closes above $0.65:
First target: $0.7452 (initial resistance)
Mid- to long-term bullish targets (measured from cup height):
🔹 $0.8658
🔹 $0.9934
🔹 $1.1931
🔹 $1.3804
🔹 $1.6171
🔹 $1.9585
🔹 $2.1669 → Main Cup & Handle Target
⏫ These targets are realistic if market sentiment turns bullish again and momentum builds.
⚠️ Bearish Scenario (Downside Risk):
If the breakout fails and price breaks down below the handle’s support zone:
Immediate support: $0.57 – $0.52
If $0.52 fails to hold:
🔻 $0.43
🔻 $0.3487 (Previous major low)
The pattern becomes invalid if the price breaks below the cup’s base at ~$0.43, suggesting bearish continuation.
📊 Additional Notes:
Volume is key. A valid breakout must be accompanied by a noticeable surge in trading volume.
Look for confirmation via RSI breakout or bullish divergence, and watch how price interacts with major moving averages.
Beware of false breakouts – a daily candle close above resistance with volume is the ideal confirmation.
💡 Final Thoughts:
APEUSDT is at a critical juncture. The nearly completed Cup and Handle pattern could be the launchpad for a major bullish rally. However, caution is advised—risk management and confirmation are essential for success in volatile crypto markets.
#APEUSDT #ApeCoin #CryptoBreakout #CupAndHandle #AltcoinAnalysis #TechnicalAnalysis #PriceAction #BullishCrypto #CryptoSetup #TradingSignal

APEUSDT 1D AnalysisAPE ~ 1D Analysis
#APE This trade is very risky
Buy after successfully breaking this resistance line with strong volume. With a short-term target of at least 15%+.
#APE/USDT#APE
The price is moving within a descending channel on the 1-hour frame, adhering well to it, and is heading for a strong breakout and retest.
We are seeing a bounce from the lower boundary of the descending channel, which is support at 0.5060.
We have a downtrend on the RSI indicator that is about to be broken and retested, supporting the upward trend.
We are looking for stability above the 100 moving average.
Entry price: 0.5386
First target: 0.5528
Second target: 0.5720
Third target: 0.5887

APEUSDT 1D AnalysisAPE ~ 1D Analysis
#APE successfully broke through this resistance line, expecting a 10%+ increase from here.

#APE/USDT#APE
The price is moving within a descending channel on the 1-hour frame, adhering well to it, and is heading for a strong breakout and retest.
We are seeing a bounce from the lower boundary of the descending channel, which is support at 0.4040.
We have a downtrend on the RSI indicator that is about to be broken and retested, supporting the upward trend.
We are looking for stability above the 100 moving average.
Entry price: 0.4122
First target: 0.4223
Second target: 0.4330
Third target: 0.4464

APE Analysis | Lost in the Jungle or Making a Comeback? (1D)The larger-degree APE pattern appears to be a large symmetrical triangle, and we are currently in the G wave of this pattern. The G wave is bearish, and within the G wave, we can also observe a smaller-degree symmetrical triangle.
It seems we are nearing the final leg of this pattern, and we expect one more drop from the red box. If the price reaches the green zone, we may have a low-risk opportunity to enter a buy position.
Potential targets are marked on the chart.
A daily candle closing below the invalidation level would invalidate this outlook.
For risk management, please don't forget stop loss and capital management
When we reach the first target, save some profit and then change the stop to entry
Comment if you have any questions
Thank You

#APE/USDT#APE
The price is moving in a descending channel on the 1-hour frame and is adhering to it well and is heading to break it strongly upwards and retest it
We have a bounce from the lower limit of the descending channel, this support is at a price of 0.4960
We have a downtrend on the RSI indicator that is about to be broken and retested, which supports the rise
We have a trend to stabilize above the moving average 100
Entry price 0.5770
First target 0.6096
Second target 0.6421
Third target 0.6856

APEUSDT 6DAPE ~ 6D Analysis
#APE Buy gradually from here if you still have a Conviction on this Coin. Short -term target of at least 20%+.

#APE/USDT#APE
The price is moving in a descending channel on the 1-hour frame and is adhering to it well and is heading to break it strongly upwards
We have a bounce from the lower limit of the descending channel, this support is at a price of 0.661
We have a downtrend on the RSI indicator that is about to be broken, which supports the rise
We have a trend to stabilize above the moving average 100
Entry price 0.661
First target 0.763
Second target 0.860
Third target 0.966

#APE/USDT Ready to go higher#APE
The price is moving in a descending channel on the 1-hour frame and sticking to it well
We have a bounce from the lower limit of the descending channel, this support is at 0.950
We have a downtrend on the RSI indicator that is about to be broken, which supports the rise
We have a trend to stabilize above the 100 moving average
Entry price 1.10
First target 1.28
Second target 1.52
Third target 1.73

#APE/USDT - Ready to go up#APE
The price is moving in a descending channel on the 30-minute frame and sticking to it well
We have a bounce from the lower limit of the descending channel, this support is at 1.06
We have a downtrend, the RSI indicator is about to break, which supports the rise
We have a trend to stabilize above the moving average 100
Entry price 1.10
First target 1.16
Second target 1.23
Third target 1.30
