API3 ANALYSISAPI3 has broken the trigger line and has a bullish CH. It has two liquidity pools at the bottom, if it sweeps these pools and then hits the support we are looking for, it could move well up.
If it returns to the green range, we will look for a buy/long position. The target range is red. This icon should be on your watch list.
Api3

🌟🔍 API3's Bullish Signs 📈🔐🌟🔍 TradingView Analysis: API3's Bullish Signs 📈🔐
🔺 API3 in a Weekly Correction Triangle: API3 is currently in a corrective triangle in the weekly timeframe. Notably, there has been significant buying volume in recent weeks. The decreased volume during the last three weeks of red candles is a positive sign for potential upward movement.
🌐 Daily Timeframe Movement: The coin is showing a curved movement in the daily timeframe, but it's not parabolic. It responds well to this curved line, but opening positions based on this reaction isn't part of my strategy.
📈 Entry Strategy: For short-term entries, I plan to enter a long position or buy spot after breaking the daily resistance at $1.591.
🔑 Key Resistance and Monthly Box Entry: Once it breaks the trend line and the $1.591 resistance, API3 will enter a monthly box, with a crucial resistance at $2.443.
🛒 Long-Term Buying Strategy: For a long-term portfolio or hold, it's advisable to buy after surpassing $2.443 to ensure a confirmed bullish trend.
🔍 Important Daily Resistance: Keep an eye on the daily resistance at $1.921.
📊 RSI Oscillator Support: The RSI is finding important support at 40, which could sustain the price.
🚦 Caution in the Triangle: As long as the price remains above $1.272, it's better not to buy within the triangle until it exits the consolidation phase.
🔑 Related Categories:
Triangle Patterns
Volume Analysis
Oscillator Analysis
📣 What’s your perspective on API3's market movement? Let's discuss strategies! 💬🌐 #API3Analysis #CryptoTrends #TradeCityPro
📚 Remember: Cryptocurrency investments are subject to market risks. Always conduct thorough research and consider your risk tolerance! 🧠💼

#api3 will explode someday?- Very well accumulated.
- Trend support for 4 times
- Falling wedge and rested RSI
These are good signs. Breaking down the wedge is the invalidation and road to Magma.
NOT FINANCIAL ADVICE.

API3USDT analyzing the Potential Upsurge🚀🚀Analyzing the Potential Upsurge of API3USDT:
API3USDT, currently priced at $1.068, exhibits several indicators that suggest the possibility of an upward trajectory in its value.
1. Steady Price Growth**: Over the past few weeks, API3USDT has demonstrated a consistent pattern of price growth. This steady increase in value can be indicative of growing demand and positive sentiment among investors.
2. Support at Key Levels**: Technical analysis reveals that API3USDT has found support at key price levels, which has prevented it from significant declines. This support suggests that there is strong buying interest at these levels, reinforcing the bullish outlook.
3. Trading Volume**: An increase in trading volume often precedes significant price movements. If API3USDT experiences a surge in trading volume alongside its price increase, it may signal a more substantial rally.
4. Positive News and Developments**: Positive news surrounding the project, such as partnerships, technological advancements, or adoption in the blockchain space, can be a catalyst for price appreciation. Staying informed about recent developments in the API3 ecosystem is crucial.
5. Market Sentiment**: Monitoring social media channels and cryptocurrency forums for sentiment analysis can provide insights into how the community perceives API3USDT. Positive sentiment can fuel buying interest and drive prices higher.
6. Resilience to Market Volatility**: API3USDT's ability to maintain its value during periods of market volatility can be a positive sign. It suggests that the coin has strong fundamentals and a dedicated investor base.

API3 retest below 0.9?Hello friends, I don't know what the condition of BTC will be and whether we will really test lower levels and GAP around 22-20k, however if so I expect something similar with API3.
It's clean, SL above breakout and profit in two parts + be patient.
Of course, I'll explain the situation you described in English.
An ascending triangle is a technical analysis pattern used in trading various assets, including cryptocurrencies. It consists of two trendlines: one is a diagonal trendline connecting the highs of price points, and the other is a horizontal level representing a certain resistance or support.
The drop in the price of the API3 cryptocurrency from the ascending triangle and the subsequent testing of the ascending trendline can have a few implications:
Breakout of the Ascending Triangle: A drop in price outside the triangle pattern can signal weakening demand or a change in trend. If the price of the API3 cryptocurrency fell below the lower diagonal line of the triangle, some traders might believe that the ascending trend has been disrupted and a price decline might follow.
Testing the Ascending Trendline: After breaking out of the ascending triangle, the price might attempt to test the previously diagonal trendline as a new resistance level. This is a common scenario; if the price doesn't stay above this line, it could confirm that the earlier upward trend has been broken.
Expectation of Price Decline: From your explanation, it seems you expect the value of the API3 cryptocurrency to decrease. This expectation could be based on technical analysis, where you observed the breakout from the ascending triangle and the subsequent testing of the ascending trendline. This might suggest that the market lacks the strength to sustain the price at a higher level and a decline could follow.

API3/USDT Potential Upward Movement to Take a Bearish OB ??Hello Paradisers, One to Watch Potential coin!
💎After encountering resistance at a pivotal support zone, API3 seems poised for a rebound toward the Bearish Order Block.
💎Historical data shows that API3 has previously experienced significant gains after touching this key support, followed by a sharp decline upon hitting a strong supply zone. The presence of substantial accumulation at this support level suggests that history could repeat itself.
💎However, if API3 fails to hold its ground at this crucial support, the scenario could be invalidated, potentially leading to a new lower low.

API3 might follow LPTHello Traders,
As you can see, API3 is so similar to LPT and might follow LPT in the next few days.
Funding rate is still negative and we can see short squeeze like LPT.
Please hit the boost button and follow me for more ideas.
Thanks.

Api3/usdt One More Bullish move loading Api3usdt
I think the price of Api3/USDT will break out of the triangle shape it's in and go up by around 20-30%. This is because, if you're someone who trades actively, you've probably noticed that on Sundays, the value of a certain coin goes up a lot. This weekend, I believe this will happen to both Api3 and Lpt. Lpt has already gone up by over 30%, so now I think it's Api3's turn. Just remember, this trading idea is only for the weekend.
Important: I'm not giving financial advice. Before you make any decisions, please do your own research. Good luck! If you like what we're saying, please support us.

API3/USDT - API3: Trend_Reversal◳◱ An intriguing development has unfolded on the CRYPTOCAP:API3 / CRYPTOCAP:USDT chart as we've identified a compelling Trend Reversal. This shift in price dynamics indicates a noteworthy potential trend change. It's crucial for us to pay attention to the next resistance levels located at 1.17 | 1.263 | 1.446 and the significant support levels found at 0.987 | 0.897 | 0.714. Taking these factors into consideration, it may be prudent to contemplate entering a buy position at the current price of 1.109, allowing us to take advantage of the projected trend continuation.
Let's keep a watchful eye on this exciting opportunity and stay proactive in our trading strategies.
◰◲ General info :
▣ Name: API3
▣ Rank: 246
▣ Exchanges: Binance, Kucoin, Bybit, Huobipro, Gateio, Poloniex
▣ Category/Sector: Services - Data Management
▣ Overview: API3 is a collaborative project to deliver traditional API services to smart contract platforms in a decentralized and trust-minimized way. It is governed by a decentralized autonomous organization (DAO), namely the API3 DAO. Therefore, API3's code is open source and its operations are transparent.
◰◲ Technical Metrics :
▣ Mrkt Price: 1.109 ₮
▣ 24HVol: 2,760,362.841 ₮
▣ 24H Chng: 4.131%
▣ 7-Days Chng: -3.13%
▣ 1-Month Chng: 12.31%
▣ 3-Months Chng: -23.45%
◲◰ Pivot Points - Levels :
◥ Resistance: 1.17 | 1.263 | 1.446
◢ Support: 0.987 | 0.897 | 0.714
◱◳ Indicators recommendation :
▣ Oscillators: NEUTRAL
▣ Moving Averages: BUY
◰◲ Technical Indicators Summary : BUY
◲◰ Sharpe Ratios :
▣ Last 30D: 1.89
▣ Last 90D: -1.65
▣ Last 1-Y: -0.30
▣ Last 3-Y: 0.68
◲◰ Volatility :
▣ Last 30D: 0.74
▣ Last 90D: 0.73
▣ Last 1-Y: 0.89
▣ Last 3-Y: 1.54
◳◰ Market Sentiment Index :
▣ News sentiment score is N/A
▣ Twitter sentiment score is N/A
▣ Reddit sentiment score is 0.73 - Bullish
▣ In-depth API3USDT technical analysis on Tradingview TA page
▣ What do you think of this analysis? Share your insights and let's discuss in the comments below. Your like, follow and support would be greatly appreciated!
◲ Disclaimer
Please note that the information and publications provided are for informational purposes only and should not be construed as financial, investment, trading, or any other type of advice or recommendation. We encourage you to conduct your own research and consult with a qualified professional before making any financial decisions. The use of the information provided is solely at your own risk.
▣ Welcome to the home of charting big: TradingView
Benefit from a ton of financial analysis features, instruments and data. Have a look around, and if you do choose to go with an upgraded plan, you'll get up to $30.
Discover it here - affiliate link -

API3 forming a weekly ADAM and EVEAPI3 merits some attention with massive spikes. These should not be ignored, coupled with weekly bullish pattern and Bullish RSI divergence. I expect BIG BIG moves for this coin long term, but we can start by targeting 5-10x returns.

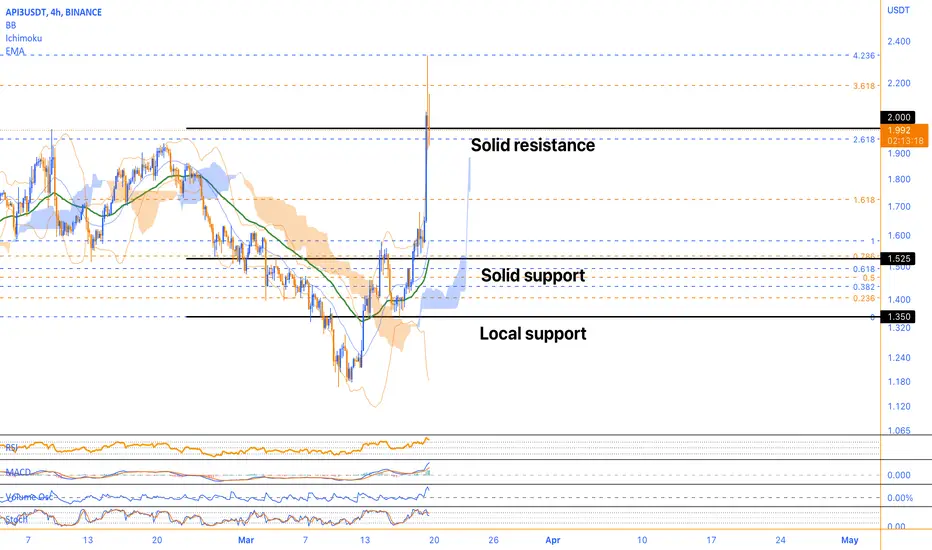
Pinpointing Support and Resistance Zones for TradersLet's take a look at API3
It is currently trading at $1.992, and the 4-hour timeframe is what we'll be analyzing here. There are a number of indicators to consider, so let's dive in and see what they're telling us.
First up, we have the Relative Strength Index (RSI) which is currently sitting at 83. This suggests that API3 is overbought at the moment, which could mean that there's a potential for a price correction in the near future. However, that's not the only thing to consider here.
We also have the Fibonacci retracement levels to think about. The 0 Fibonacci level on the 4-hour timeframe is at 1.350, the 0.5 Fibonacci level is at 1.466, and the 1 Fibonacci level is at 1.580. Currently, API3 is trading above all these levels, which indicates a bullish sentiment. However, it also means that there may be resistance ahead if the price continues to rise toward these levels.
Next up, we have the Bollinger Bands. These bands consist of three lines: the upper, middle, and lower bands. At the moment, the upper band is at 2, the lower band is at 1.160, and the middle band is at 1.590. API3 is currently trading above the middle band, which is a good sign for bullish sentiment. However, if the price continues to rise and hits the upper band, it may indicate an overbought situation and could lead to a price correction.
Let's move on to the volume oscillator, which is currently at 43%. This indicates that there's moderate trading activity in API3 right now. So, while there may not be a ton of movement, there's still some activity to be aware of.
The Moving Average Convergence Divergence (MACD) is also worth looking at here. It's currently sitting at 0.138, which suggests that the bullish momentum is still present in API3.
The Stochastic Oscillators are currently at 73, indicating that API3 is overbought at the moment. This is something to keep in mind as it could mean that there's a potential for a price correction in the near future.
Finally, we have the 4-hour EMA 50, which is currently at 1.525. This is a good sign for bullish sentiment, as the current price of API3 is trading above the EMA. It suggests that the asset is currently in an uptrend.
So, what can we take away from all of this? Overall, it seems that API3 is experiencing some bullish momentum at the moment. However, the RSI, Fibonacci retracement levels, Stochastic Oscillators, and Bollinger Bands all indicate that the asset is overbought and may experience a price correction in the near future. Traders and investors should pay close attention to these indicators and monitor the price action around them to identify potential support and resistance levels.
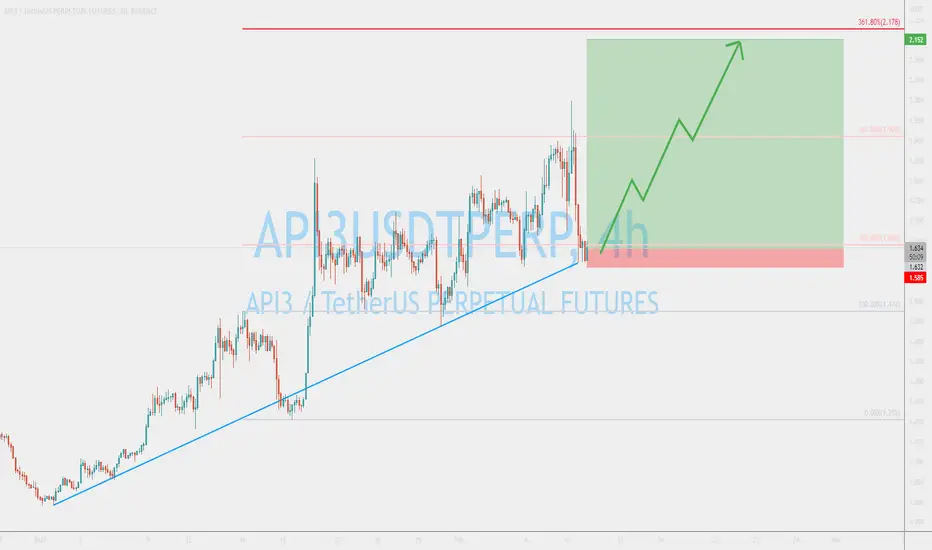
API3USDT perfect Risk/Reward opportunityWe can see a clear bounce off the trendline. As long as the price remains above the trendline, the uptrend will continue, providing an excellent RR trade setup.
Bearish: Short Term.Hello Traders and Investors,
API3 has reached major resistance. I believe there is a short-term move to the downside with 8%+ gains. This is a setup that have a high percent chance of succeeding.
Let me know what you think.


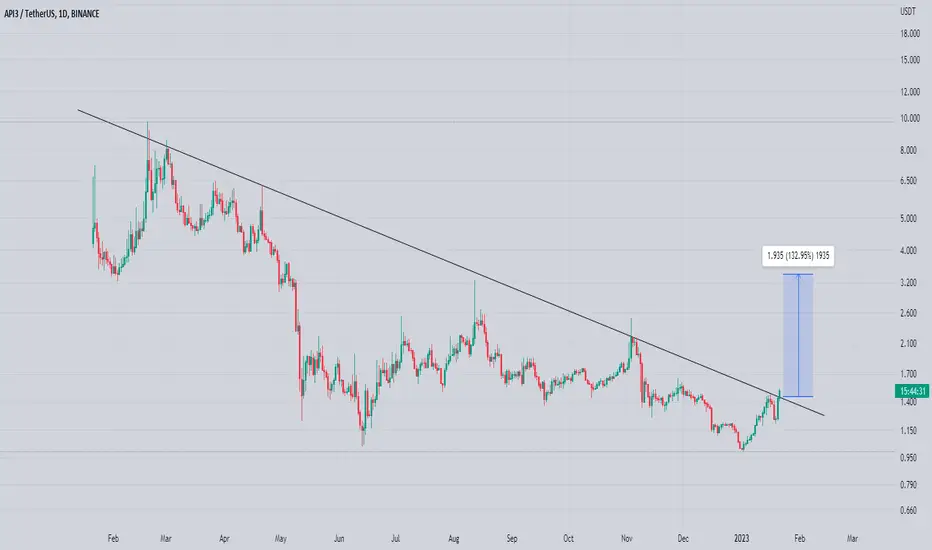
Api3 breaking Major trend Line Breaking trendline In daily timeframe
once got cleared then We Can Expect 100 to 120% Bulish Wave
API3 token formed bullish Gartley for upto 165% pumpHi dear friends, hope you are well and welcome to the new trade setup of API3 token with BTC pair.
In the previous trade we had almost 41% pump, and the priceline was very close to hit the sell zone, but drpped down just before reaching the target as below:
Now on a 4-hr time frame, API3 is about to complete the final leg of a bullish Cypher pattern.
Note: Above idea is for educational purpose only. It is advised to diversify and strictly follow the stop loss, and don't get stuck with trade

API3 token forming bullish Cypher for upto 12% pumpHi dear friends, hope you are well and welcome to the new trade setup of API3 token with BTC pair.
In the previous trade we had almost 41% pump, and the priceline was very close to hit the sell zone, but drpped down just before reaching the target as below:
Now on a 4-hr time frame, API3 is about to complete the final leg of a bullish Cypher pattern.
Note: Above idea is for educational purpose only. It is advised to diversify and strictly follow the stop loss, and don't get stuck with trade

API3 TO £260- Circulating Supply - 56,547,601
- Market Cap - £80,520,432 (17/10/22)
- Current price - £1.42
- ROI Potential - 185 X
- Market cap goes from £80,520,432 to: £14,896,279,920

API3 BUY THE BREAKOUT 20221002Buy when breaking through the resistance
API3, API3USD , API3USDT , API3USDTPERP , API3BUSDPERP, CRYPTO, CRYPTOCURRENCY
DISCLAIMER
This is only a personal opinion and does NOT serve as investing NOR trading advice.
Please make your own decisions and be responsible for your own investing and trading Activities.

API3 CAN GIVE A SCALP SHORTI think we have a low risk range for the short position. But manage the investment and put a stop

API3USDT Falling Wedge!API3USDT Technical analysis update
Buy zone : $1.610 - $1.64
Stop loss : $1.49
TP 1 : $1.737
TP 2 : $1.855
TP 3 : $2.05
Always keep stop loss
Thanks
Hexa


WILL API3USDT HIT 2.653 SOON !?This is from my perspective, API3USDT will go hit 2.653 Price soon. This is only if API3 Price can stay above the ichimoku cloud.
Entry : 2.134 - 2.045
Target : 2.653
Stoploss : 1.956
Disclaimer : Do Your Own Research First, I'm not a financial Adviser. This is High risk signal, don't entry if you want to blame me when this signal fail.
