APPLE First correction signals in 7 months start to emerge.Almost 1.5 month ago (September 19, see chart below), we gave a buy signal on Apple Inc. (AAPL), which recently hit our $273 Target:
This time we go back to our long-term perspective and view Apple on the 1W time-frame, as the Bullish Leg (green) since the April 07 bottom, is approaching the top (Higher Highs trend-line) of the 4-year Channel Up.
The previous Bullish Leg peaked just below the 1.236 Fibonacci extension, so we can't rule out one final push to round $285 but on the long-term, a technical pull-back is favored.
The 2023 Bullish Leg eventually corrected on the 1W MA50 (blue trend-line), hitting its 0.382 Fibonacci retracement level at the same time. Even the smaller April - July 2024 Leg pulled-back to he 0.5 Fib.
All of those Channel Up tops have been also met with a 1W RSI break above the 70.00 oversold level, which is something that hasn't taken place yet. Similarly the 1W MACD hasn't started to reverse on the levels of most of previous tops.
In any case, we expect to see Apple hitting $236 at least on the long-term, which is its 0.382 Fib and marginally below the 1W MA50.
-------------------------------------------------------------------------------
** Please LIKE 👍, FOLLOW ✅, SHARE 🙌 and COMMENT ✍ if you enjoy this idea! Also share your ideas and charts in the comments section below! This is best way to keep it relevant, support us, keep the content here free and allow the idea to reach as many people as possible. **
-------------------------------------------------------------------------------
💸💸💸💸💸💸
👇 👇 👇 👇 👇 👇
Apple

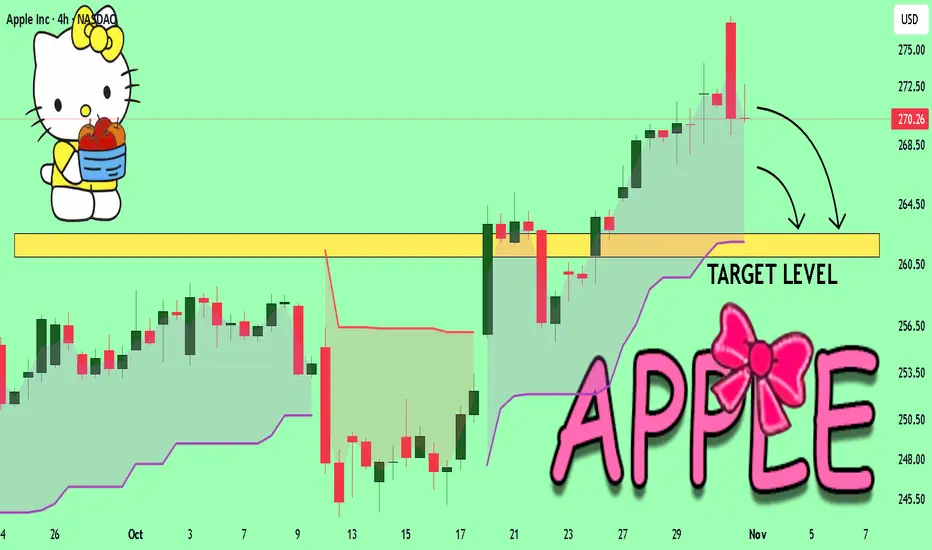
APPLE Set To Fall! SELL!
My dear subscribers,
APPLE looks like it will make a good move, and here are the details:
The market is trading on 270.26 pivot level.
Bias - Bearish
Technical Indicators: Both Super Trend & Pivot HL indicate a highly probable Bearish continuation.
Target - 262.56
About Used Indicators:
The average true range (ATR) plays an important role in 'Supertrend' as the indicator uses ATR to calculate its value. The ATR indicator signals the degree of price volatility.
Disclosure: I am part of Trade Nation's Influencer program and receive a monthly fee for using their TradingView charts in my analysis.
———————————
WISH YOU ALL LUCK
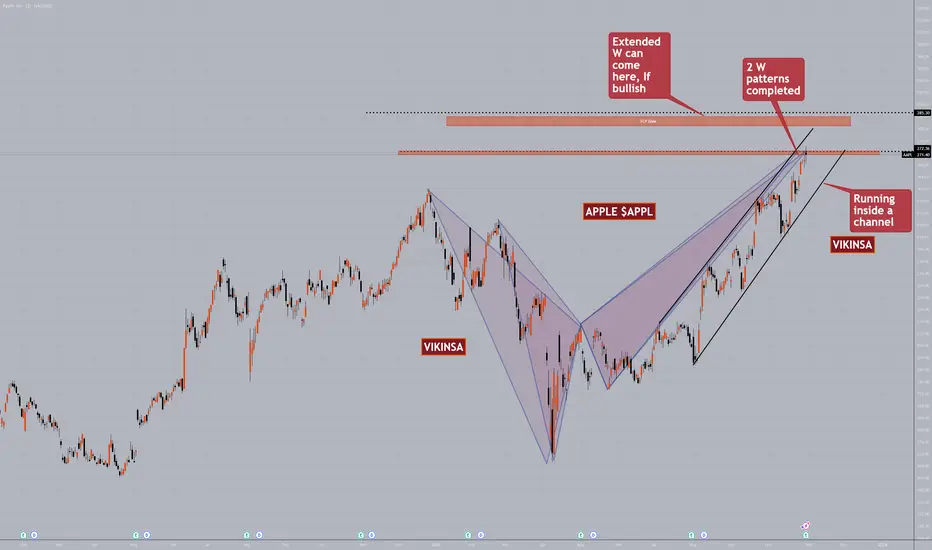
Is APPLE $APPL ready and primed for a correction?Apple BSE:APPL had a great run so far in the past few weeks. It has also been running inside a channel which has pushing the price upwards. However, now it has just completed an extended W pattern. In fact 2 of them got completed exactly at the same level.
The current price level is something that needs to eb watched very closely. When W patterns complete, markets tend to have a correction. Market is still bullish and is still inside the channel so even if the correction comes, we will have to be careful with the shorts.
If the market stay bullish from this point above at least on daily/weekly basis then we have an upper FCP zone where it can reach possibly take a correction from there.
In all cases, we must remember to wait for confirmations and obviously manage the risk.
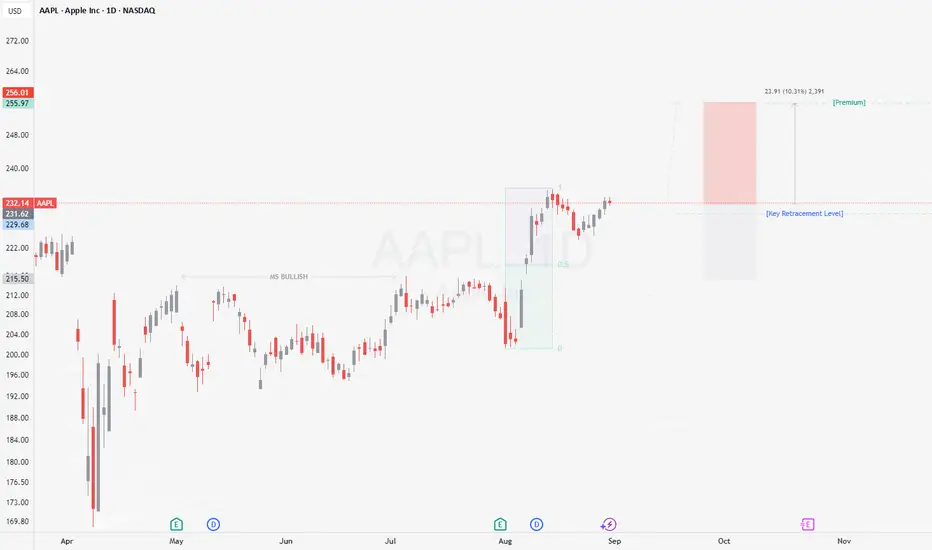
AAPL Apple Options Ahead of EarningsIf you haven`t bought the dip on AAPL:
Now analyzing the options chain and the chart patterns of AAPL Apple prior to the earnings report this week,
I would consider purchasing the 255usd strike price Calls with
an expiration date of 2025-11-21,
for a premium of approximately $18.65.
If these options prove to be profitable prior to the earnings release, I would sell at least half of them.

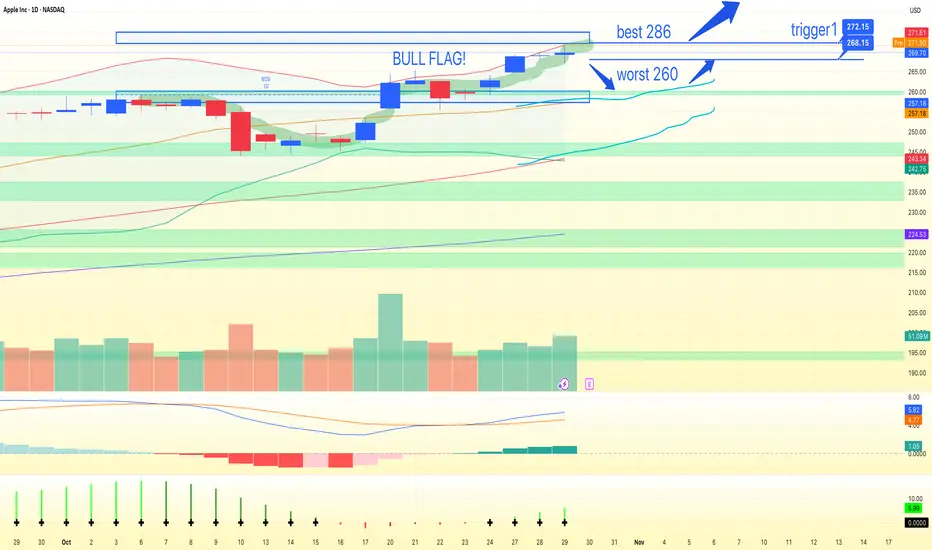
AAPL Bullish Breakout: Retest Buy Toward 282–286Apple (AAPL) is trending firmly higher on the 1D chart, with multiple break-of-structure pushes and price riding the upper Bollinger Band. The recent surge cleared resistance and printed a new high at 271.60, while the 20/60/120 MAs remain positively stacked and rising. Short-term momentum favors continuation, but a brief pause wouldn’t surprise given the extension.
My primary path is a buy-the-retest setup: a dip into the former ceiling turned demand at 260.00–264.00 holds, followed by a constructive bounce. If that plays out, I’m looking for a grind toward 278–280 first, then an extension into 282–286 as higher highs resume. Alternatively, strength through resistance is a momentum trigger— a daily close above 271.60 (aggressive >272.00) would validate a break-and-hold and open the same targets.
Invalidation is clean: a decisive daily close below 260.00 breaks the structure and risks a deeper pullback. Until then, the bias stays bullish; consider partial sizing on initial entries and add on confirmation to respect expanding volatility. Stops can sit just below 260.00 (around 258.00) for retest entries, or tucked under the breakout level if trading the close-above trigger.
This is a study, not financial advice. Manage risk and invalidations
APPLE: Price Action & Swing Analysis
The recent price action on the APPLE pair was keeping me on the fence, however, my bias is slowly but surely changing into the bearish one and I think we will see the price go down.
Disclosure: I am part of Trade Nation's Influencer program and receive a monthly fee for using their TradingView charts in my analysis.
❤️ Please, support our work with like & comment! ❤️

NASDAQ 100 (NDX)-The Grand Super Cycle Journey🧠 The Grand Super Cycle Journey of NASDAQ 100 (NDX)
Here's a comprehensive, narrative-style description of NASDAQ 100 (NDX) INDEX based on Elliott Wave Theory , Smart Money Concepts (SMC) , Fibonacci Retracements/Extensions , Price Action , and Fundamentals across Super Cycle , Macro , and Micro Waves 🔍📈:
🌱 Super Cycle Wave 1: The Birth of Tech (1986–2000)
The journey begins with Wave 1 , ignited by the early tech boom — Microsoft, Intel, and the rise of Silicon Valley 🚀. This impulsive leg spans over a decade, culminating in the dot-com bubble peak in 2000.
🔹 Smart Money Insight: Early accumulation started in the '80s, followed by massive markup into the 1990s. Retail entered late, leading to the euphoric climax in 2000.
🔹 Price Action: Parabolic rallies, breakouts through historical resistance, ending in a massive overextension.
🔹 Fundamentals: Era of growth, innovation, low inflation, and initial internet adoption.
🌪️ Super Cycle Wave 2: The Great Correction (2000–2009)
The bursting of the dot-com bubble triggered a complex correction labeled as W-X-Y. This 9-year structure ends in the 2008–09 financial crisis low. The market retraced to the 0.382 Fibonacci level , a classic deep correction in a strong long-term bull market.
🔸 Smart Money: Distribution at the top → manipulation through global uncertainty (9/11, housing bubble) → reaccumulation near the 2009 lows 🧠📉.
🔸 Fundamentals: Enron scandal, 9/11, housing collapse, Lehman bankruptcy — a decade of fear and instability 🏚️.
🚀 Super Cycle Wave 3: The Exponential Phase (2009–2029)*
The most powerful leg — Wave 3 — is unfolding, targeting an eventual 2.618 Fibonacci extension (~85,000) . This wave is subdivided into 5 Macro Waves , each composed of 5 Micro Waves . Here's how the structure progresses:
⚙️ Macro Wave 1 (2009–2012)
Started at the GFC low, this wave marked the beginning of recovery, finishing with 5 orange micro waves .
🟠 Micro Waves: A clean 5-wave impulse showing the early stages of structural strength.
📊 Price Action: Break of structure (BoS) confirms bullish reversal.
🏦 Fundamentals: QE1/QE2, low interest rates, tech stabilization, birth of FAANG era 💻.
📈 Smart Money: Institutions started accumulating in late 2009–2010, reflected in tight consolidations and sharp rallies.
🔁 Macro Wave 2 (2012)
A brief and shallow correction within the bullish context — a classic bullish flag in terms of price action. Quickly ended with higher lows.
🧠 SMC: Short manipulation phase to shake weak hands.
📉 Price Action: Pullback respected prior structure — no trend break.
💥 Macro Wave 3 (2012–2021)
This was the largest and most explosive wave , extending over 9 years and forming 5 purple micro waves.
🟣 Micro Waves: Clean impulsive structure, confirming a classic Elliott wave fractal.
💡 Fundamentals:
Rise of cloud computing
Mobile-first economy
AI, semiconductors, and social media explosion
COVID-19 crash and rebound — the fastest recovery in history
🔹 Fibonacci: No deep retracements — sign of a healthy, powerful wave 3.
🧠 Smart Money: Deep accumulation during COVID crash → massive expansion post-March 2020 📈.
🧱 Macro Wave 4 (2021–2022)
A healthy correction that reset the structure — completed around the 2022 low. This wave maintained market structure integrity.
🔻 SMC: Liquidity sweep of previous lows + mitigation of demand zones.
📊 Price Action: Range-bound, bearish to neutral.
🌍 Macro Headwinds:
Interest rate hikes
Inflation fears
Global instability (Russia-Ukraine, energy crisis)
🧬 Macro Wave 5 (2022–2029) – Now Unfolding*
This is the final thrust of the Super Cycle Wave 3 , subdivided into 5 micro waves (current count in progress):
🔸 Micro Wave 1 ✅
Initial rally from 2022 lows, showing strong impulsive behavior.
🧠 Smart Money: Confirmed shift from reaccumulation to expansion.
🔸 Micro Wave 2 ✅
Pullback formed higher low — acted as final reaccumulation.
🔴 Micro Wave 3 – In Process (2025–2026)
This is expected to be the strongest wave within Macro Wave 5, projected to peak near 36,000 (2.618 extension of micro 1–2).
📈 Price Action: Aggressive higher highs and shallow pullbacks.
🧠 SMC: Expansion with little liquidity left below — institutions pushing price up.
💡 Fundamentals:
AI hypergrowth
US tech dominance
AI chips, quantum computing, tokenization
Renewed bullish risk appetite 🌐
🟠 Micro Wave 4 (Expected 2026–2027)
A corrective wave likely to retest the macro structure — forming a flag or triangle.
📉 Price Action: Sideways to downward chop, retracing 0.382–0.5 of wave 3.
🧠 SMC: Inducement setup before final rally.
🌍 Macro: Possible geopolitical or monetary tightening phase.
🔵 Micro Wave 5 (Expected Top in 2029)
The final leg of Macro Wave 5 and Super Cycle Wave 3. Expected to top near 85,000 , a 2.618% Fibonacci extension of Super Cycle Waves 1–2.
🎯 Final Parabolic Blow-Off
📊 Price Action: Euphoria, exponential rally, low-volume melt-up
📈 Smart Money: Final distribution phase — retail FOMO peaks
🧨 Fundamentals: Mania phase — “everything AI/metaverse/tokenized” narrative, record valuations, IPO booms.
🔮 Looking Beyond: Super Cycle Wave 4 (Post-2029)
Once the 85K target is met, a multi-year correction is expected — possibly deep and drawn out. Historically, Wave 4s retrace 0.236% to 0.382% and take years to unfold.
🧠 Expect:
Systemic debt pressure
Currency shifts
Economic reset themes
Potential Fed policy overcorrection
Liquidity crunch
🌧️ Super Cycle Wave 4 may retest previous demand zones around 30–36K.
📚 Final Thoughts
Our analysis represents an extraordinary blend of Elliott Wave fractals , institutional behavior (SMC) , and macro-fundamental alignment . We are in the late phase of a historical Super Cycle rally — but Wave 3 still has room to run 📈.
✅ Wave Count Aligned
✅ Fibonacci Extensions Respected
✅ SMC Structure Intact
✅ Macro-Fundamentals in Sync
📌 2025–2029 could be the final push before a generational correction. Smart investors must watch for distribution signs post-36K 📊.
"Trust the waves, not the noise." – FIBCOS 🌊
📘 Disclaimer: This is a structural, educational market outlook. Not financial advice. Please do your own due diligence and risk management.
#FIBCOS #ElliottWave #SmartMoneyConcept #MarketAnalysis #NASDAQ #XAUUSD #SuperCycle #MacroTrend #SmartMoney #Fibonacci #PriceAction #Commodities #Stocks #TechnicalAnalysis #LongTermOutlook

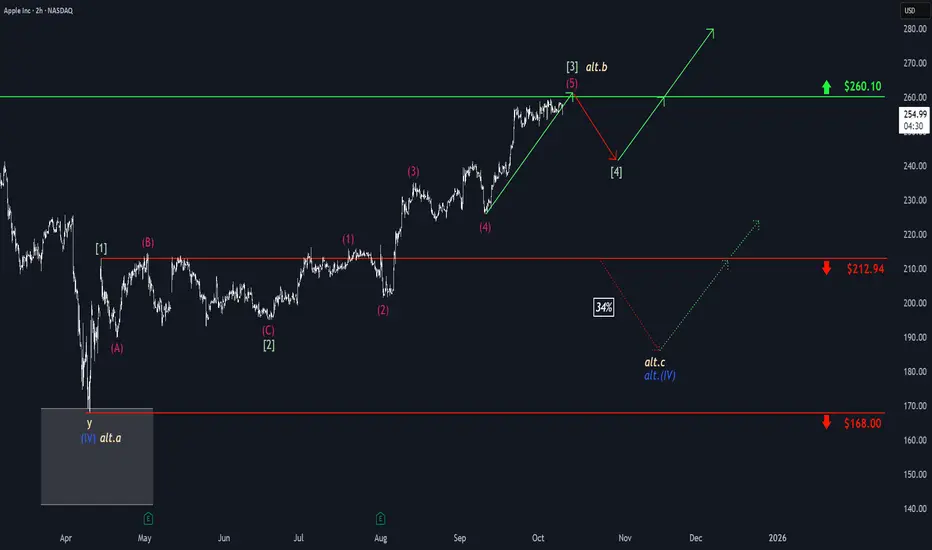
Apple: New All-Time High as Low Is Adjusted Apple has recently seen a period of heightened volatility, marked by sharp gains and notable pullbacks. In response to the latest price action, we’ve made a slight adjustment to our wave count and revised the low for magenta wave (4). We’re now allowing for magenta wave (5) to break above the $260.10 resistance level, which would complete green wave . Our alternative scenario, which carries a 34% probability, still calls for a new corrective low in blue wave alt.(IV). In this case, Apple would have just finished beige wave alt.b slightly above $260.10 and would next decline in wave alt.c, falling below support at $212.94. Even so, the alternative corrective low would remain above the $168 level.

Apple: New All-Time High!Apple has recently seen a period of heightened volatility, marked by sharp gains and notable pullbacks. We’re allowing for magenta wave (5) to break above the $260.10 resistance level, which would complete green wave . However, our alternative scenario, which carries a 34% probability, calls for a new corrective low in blue wave alt.(IV) . In this case, Apple would have just finished beige wave alt.b slightly above $260.10 and would next decline in wave alt.c , falling below support at $212.94. Even so, the alternative corrective low would remain above the $168 level.

APPLE/AAPL Stock: Movement Scenarios and Key Reaction PointsThese are all the key stock levels for Apple that are fully and precisely displayed in the image – including supports, resistances, and potential reaction points for traders NASDAQ:AAPL

APPLE What Next? BUY!
My dear followers,
I analysed this chart on APPLE and concluded the following:
The market is trading on 245.33 pivot level.
Bias - Bullish
Technical Indicators: Both Super Trend & Pivot HL indicate a highly probable Bullish continuation.
Target - 251.49
About Used Indicators:
A super-trend indicator is plotted on either above or below the closing price to signal a buy or sell. The indicator changes color, based on whether or not you should be buying. If the super-trend indicator moves below the closing price, the indicator turns green, and it signals an entry point or points to buy.
Disclosure: I am part of Trade Nation's Influencer program and receive a monthly fee for using their TradingView charts in my analysis.
———————————
WISH YOU ALL LUCK

TESLA EARNINGS OCT 16 2025Price action for Tesla is here. I have clearly explained my plan on how to trade tesla considering every factor in market.
STAY AWAY FROM TRADING TESLA
NOTE: OPTION WILL BURN YOUR CAPITAL

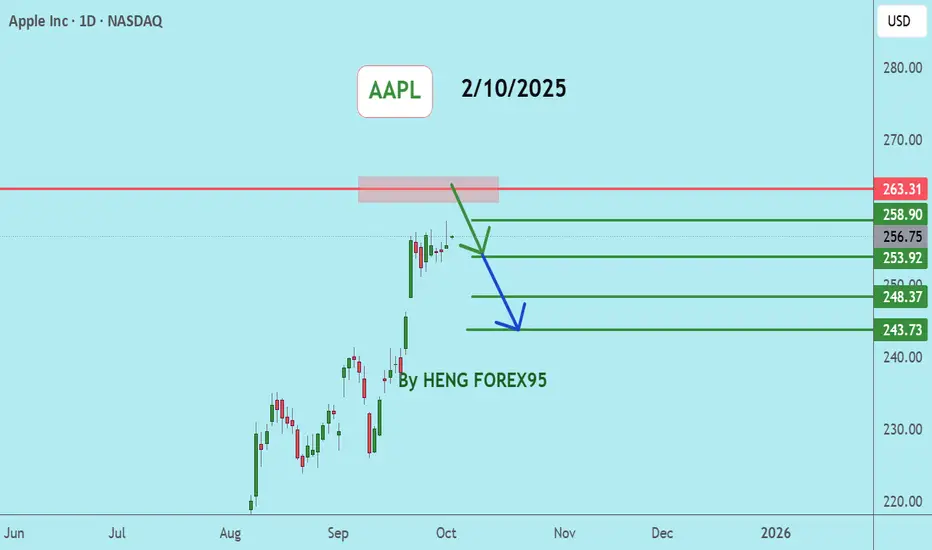
AAPL (Apple Inc.) on a 4-hour timeframe.AAPL (Apple Inc.) on a 4-hour timeframe.
Here’s what the chart shows:
The current price is around $247.80.
There is an uptrend line supporting the price.
Two target levels are marked on the chart with arrows pointing upward.
The Ichimoku cloud shows bullish momentum (price above the cloud).
📈 Marked Target Levels on Chart:
1. First Target: Around $256
2. Second Target: Around $268
📝 Analysis Context (from the chart)
The trend is bullish, supported by higher highs and higher lows.
Price is riding the trendline, and the cloud provides support.
First target seems to be a short-term breakout level, second is more medium-term.
⚠ Important Note:
These are technical analysis targets, not guaranteed future prices. Real market movement can differ due to macroeconomic news, earnings, or broader market sentiment.

A New iPhone Is Coming. Should You Upgrade or Just Fix Your Old This year, your best iPhone upgrade might be a fresh battery, a clean screen and some new software tricks. Plus, the extra cash you get to keep in your pocket.
$AAPLNot a financial advice. But something to watch on. The Relative strength Index did not make a return to or make a higher high despite the price making another high. Another thing is if we go parabolic then we can disregard the divergence.

Is Apple still a buy?If we take a closer look, we can see that we could still enter around the $240–245 range and take profits at around $260. From a fundamental perspective, the numbers also look solid for the coming quarters. Although the fair value is estimated to be around $230 per share, we have to keep in mind that we’re talking about Apple — a company with high liquidity and strong cash flow.
Therefore, a difference of around +$15 (at $245) is not a major concern. The recent drop was mainly caused by the announcement of new tariffs, which pushed the price down artificially. We expect the stock to reach around $260 within the next two weeks. There is also strong support in the lower box area.

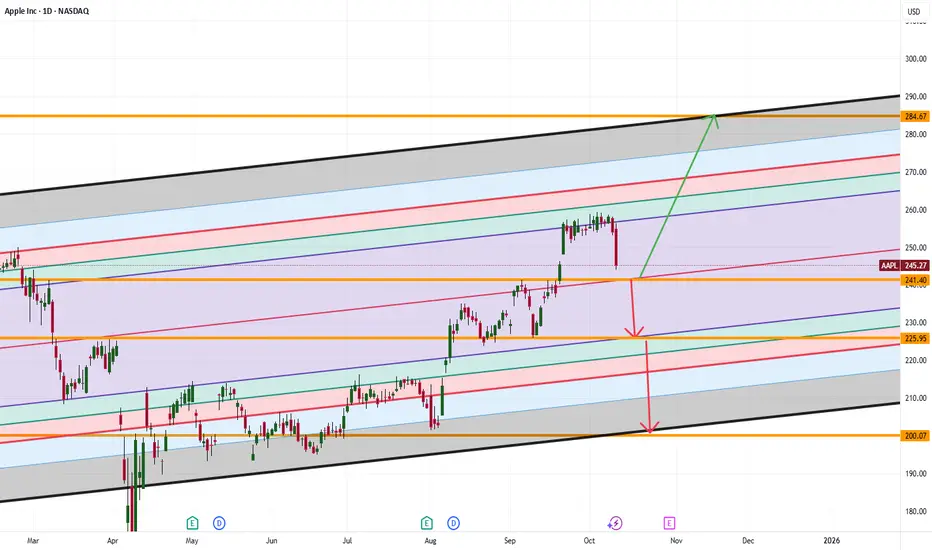
Apple’s $241 Bounce or Breakdown: Is This the Next Big Move?Apple’s stock price is moving down toward $241. This is an important zone. If Apple can stay above $241, it could jump up to $284. But if it falls below $241, the price might drop even more; maybe to $225 or even $200.
What do you think will happen next? Would you buy Apple if it drops to $241, or would you wait for a bigger move?
If you’re not sure what to do or have questions, ask me! Sometimes asking the right question gives you the answer you need to trade smarter. What’s your question about Apple right now?
Mindbloome Exchange
Trade Smarter Live Better
Apple: Rally Has a Bit More Room to RunApple’s upward momentum has clearly slowed at the $260.10 resistance level, though the stock has already come very close to this mark. As a result, we’re allowing for a bit more room for green wave to run in the near term, with the possibility that AAPL could slightly surpass the $260.10 level. However, a sustained breakout above this resistance is likely only after a pullback in wave . At the same time, there remains a 34% probability that the next peak will mark the end (or has already marked the end) of the corrective upward move in the beige wave alt.b . In this case, we would expect significant sell-offs, with a new corrective low for blue wave alt.(IV) forming between the two support levels at $212.94 and $168.
CROX BULLISH OCT 7 2025Crox is looking good here as price has a support from higher time frames. Price is also trying to narrow its range. I am long here . Do not blindly trade any thing
Always manage your risk & then trade

TESLA PRICE ACTION 5th OCTOBER 2025Price action for Tesla is here. I have clearly explained my plan on how to trade tesla considering every factor in market.
NOTE: OPTION WILL BURN YOUR CAPITAL

Long AplleJust Buy / This is new wave .
According to the chart we are in a new Rally.
so clear to goal.

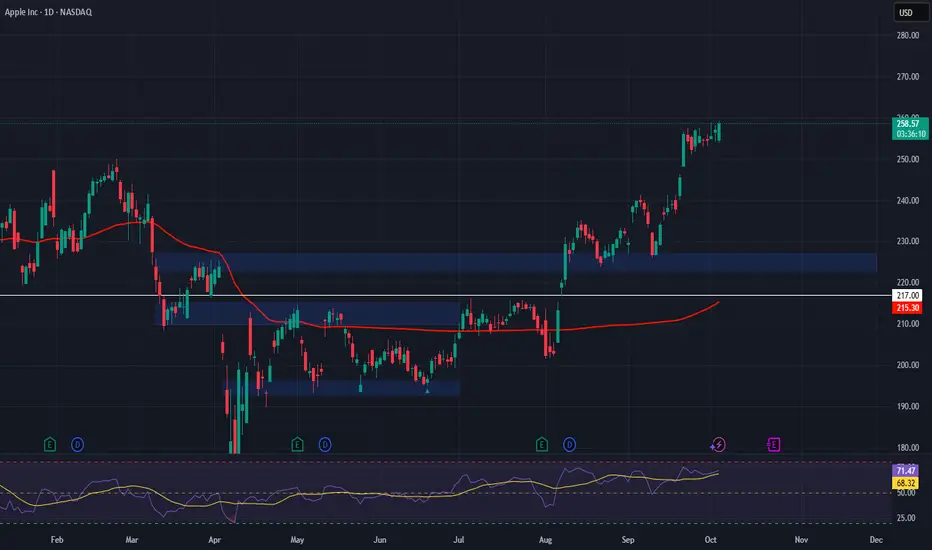
AAPL – Ready to Break Out Despite Macro NoiseMarkets are holding strong near all-time highs even amid the backdrop of a potential U.S. government shutdown. One standout name is Apple Inc. NASDAQ:AAPL , which has surged 32% since our last analysis. This rally confirms renewed momentum and continued investor confidence in large-cap tech.
Apple is in a strong uptrend, currently consolidating just below resistance. The structure is bullish, and a breakout seems likely. Any pullback toward support could offer a high-probability entry for trend followers.
🟩 Trade Setup
Entry Zone: $223 – $227 (support area)
Target Range: $237 – $259
Stop Loss: Close below $217
Watch price action near these levels and manage risk accordingly.
AAPLApple (AAPL) price is in a strong uptrend, there is a chance that the price will test the $261-$265 level. In this zone, if the price cannot break above $265, the short-term price is likely to go down, consider selling the red zone.
🔥Trading futures, forex, CFDs and stocks carries a risk of loss.
Please consider carefully whether such trading is suitable for you.
>>GooD Luck 😊
❤️ Like and subscribe to never miss a new idea!