Small traget (APT)📊Analysis by AhmadArz:
Short TP
🔍Entry: 8.915
🛑Stop Loss: 8.83
🎯Take Profit: 9.006
🔗"Uncover new opportunities in the world of cryptocurrencies with AhmadArz.
💡Join us on TradingView and expand your investment knowledge with our five years of experience in financial markets."
🚀Please boost and💬 comment to share your thoughts with us!
APT

APT: Pullback in UptrendTrade setup : Price is in an Uptrend. Now we wait for price to either 1) break above $10 to signal continuation of uptrend, with upside potential to $12.50, or 2) pull back near $8 support for a swing trade entry in Uptrend with upside potential back to $10. Stop Loss (SL) level at $7.40 (just below prior swing low and nearest support).
Trend : Uptrend across all time horizons (Short- Medium- and Long-Term).
Momentum is Bearish (MACD Line is below MACD Signal Line, and RSI is below 45).
Support and Resistance : Nearest Support Zone is $8.00 (previous resistance), then $5.40. The nearest Resistance Zone is $10.00, which it broke, then $12.50.

APT: Pullback in UptrendTrade setup : Price is in an Uptrend. Following a failed break above $10.00 resistance, price has pulled back to $8.00 support, which could be an attractive swing trade entry in Uptrend with upside back to $10.00 near-term and $12.50 medium-term. Stop Loss (SL) level at $7.75 (just below prior swing low and nearest support).
Trend : Uptrend across all time horizons (Short- Medium- and Long-Term).
Momentum is Mixed as MACD Line is below MACD Signal Line (Bearish) but RSI ~ 50 (Neutral).
Support and Resistance : Nearest Support Zone is $8.00 (previous resistance), then $5.40. The nearest Resistance Zone is $10.00, then $12.50.

APT/BTC - Aptos: BBand Breakout Super-Trend◳◱ On the $APT/ CRYPTOCAP:BTC chart, the Bband Breakout Super-Trend pattern suggests a pause in volatility, potentially gearing up for a breakout. Traders might observe resistance around 0.00024987 | 0.00027758 | 0.00032384 and support near 0.00020361 | 0.00018506 | 0.0001388. Entering trades at 0.0002417 could be strategic, aiming for the next resistance level.
◰◲ General info :
▣ Name: Aptos
▣ Rank: 32
▣ Exchanges: Binance, Gateio, Hitbtc
▣ Category/Sector: Infrastructure - Smart Contract Platforms
▣ Overview: None
◰◲ Technical Metrics :
▣ Mrkt Price: 0.0002417 ₿
▣ 24HVol: 78.934 ₿
▣ 24H Chng: 11.004%
▣ 7-Days Chng: 7.86%
▣ 1-Month Chng: 34.88%
▣ 3-Months Chng: 94.75%
◲◰ Pivot Points - Levels :
◥ Resistance: 0.00024987 | 0.00027758 | 0.00032384
◢ Support: 0.00020361 | 0.00018506 | 0.0001388
◱◳ Indicators recommendation :
▣ Oscillators: NEUTRAL
▣ Moving Averages: STRONG_BUY
◰◲ Technical Indicators Summary : BUY
◲◰ Sharpe Ratios :
▣ Last 30D: 2.68
▣ Last 90D: 2.78
▣ Last 1-Y: 1.25
▣ Last 3-Y: 0.45
◲◰ Volatility :
▣ Last 30D: 1.12
▣ Last 90D: 0.88
▣ Last 1-Y: 1.12
▣ Last 3-Y: 1.20
◳◰ Market Sentiment Index :
▣ News sentiment score is N/A
▣ Twitter sentiment score is N/A
▣ Reddit sentiment score is 0.68 - Bullish
▣ In-depth APTBTC technical analysis on Tradingview TA page
▣ What do you think of this analysis? Share your insights and let's discuss in the comments below. Your like, follow and support would be greatly appreciated!
◲ Disclaimer
Please note that the information and publications provided are for informational purposes only and should not be construed as financial, investment, trading, or any other type of advice or recommendation. We encourage you to conduct your own research and consult with a qualified professional before making any financial decisions. The use of the information provided is solely at your own risk.
▣ Welcome to the home of charting big: TradingView
Benefit from a ton of financial analysis features, instruments and data. Have a look around, and if you do choose to go with an upgraded plan, you'll get up to $30.
Discover it here - affiliate link -

APTUSD - Recovery Pattern (INVERTED H&S)A slightly slanted inverted H&S but still valid due to the head being low than both shoulders
I expect a strong right shoulder move up to the solid green line, quite a big move.
I have labelled the points of the head and shoulder structure.
The whole market looks VERY bullish to me right now.

APTUSD - Bullish IdeaAn idea for APTUSD comparing a previous bullrun to the one that is emerging now
A lower low can be seen in both situations leading to the bull run, this is shown in the white box and the green dotted line.
I do not have a price target but it should surpass the previous ATH.

APT: Resistance BreakoutTrade setup : Price broke above $10.00 resistance to signal continuation of uptrend, with upside potential to $12.50. Stop Loss (SL) level at $8.90.
Trend : Uptrend across all time horizons (Short- Medium- and Long-Term).
Momentum is Bullish (MACD Line is above MACD Signal Line and RSI is above 55).
Support and Resistance : Nearest Support Zone is $8.00 (previous resistance), then $5.40. The nearest Resistance Zone is $10.00, which it broke, then $12.50.

Wait for my confirmations(APT)❤️❤️Thanks for boosting 🚀 and supporting us!
📈My endorsements for selling resistance:
Hoping to reach the roof of the channel
Completing the second movement width from the floor
Last bullish push to sell
📌A small buy position is only to reach resistance.
📊 (sell) : 9.699
🔴 Stop Loss : 10.602
🎯 Take Profit : 8.511-7.373-6.431-5.037
🔗 For more communication with us, In the footnote and send a message in TradingView.
👨🎓 Experience and Education: Our trading team has five years of experience in financial markets, especially cryptocurrencies.

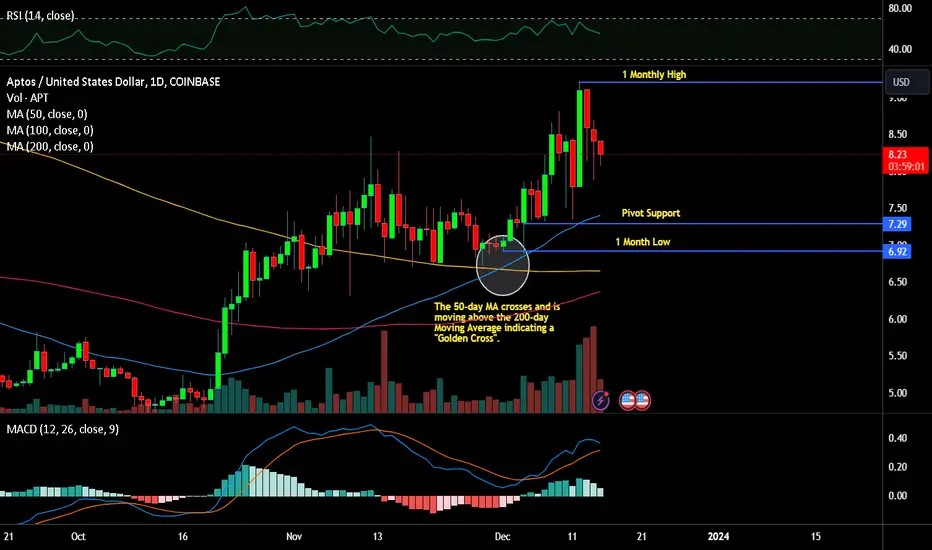
$APT Chart AnalysisAptos AMEX:APT could make a high move if break the resistance at 7.85 and will making a golden cross by the end of November or early December this year.
This is not a financial advice, still do your own research.
Peace

APT: Resistance BreakoutTrade setup : Price broke above $8.00 resistance to signal continuation of uptrend, with upside potential to $10.00.
Trend : Uptrend across all time horizons (Short- Medium- and Long-Term).
Momentum is Mixed as MACD Line is below MACD Signal Line (Bearish) but RSI > 55 (Bullish). MACD Histogram bars are rising, which suggests that momentum could be nearing another upswing.
Support and Resistance : Nearest Support Zone is $5.40 (previous resistance), then $4.70. The nearest Resistance Zone is $8.00, which it broke, then $10.00.

APT ANALYSIS (4H)It seeFrom where I entered START, an ascending pattern has started . ms that we are inside a large diametrical
For wave E, the green range is the range on which you can take risks and enter the buy/long position.
We enter the position only if it reaches the green range Stabilization of a daily candle below the range is our stop
For risk management, please don't forget stop loss and capital management
When we reach the first target, save some profit and then change the stop to entry
Comment if you have any questions
Thank You

APT: Approaching ResistanceTrade setup : Price broke above $8.00 resistance but failed to hold above it. However, it is still in an Uptrend. Now we wait for price to either 1) break back above $8.00 to signal continuation of uptrend, with upside potential to $10.00, or 2) pull back near $6.60 minor support (200-day MA) for a swing entry in Uptrend with upside potential back to $8.00.
Trend : Uptrend on Short- and Medium-Term basis and Neutral on Long-Term basis.
Momentum is Mixed as MACD Line is below MACD Signal Line (Bearish) but RSI ~ 50 (Neutral).
Support and Resistance : Nearest Support Zone is $5.40 (previous resistance), then $4.70. The nearest Resistance Zone is $8.00, then $10.00.

APT: DECEMBER 16. 2023A pivotal level has been reclaimed and price has officially exited accumulation phase. IMO, this coin is primed to go parabolic at some point. I have bought a bag. I expect full thrust above 9.5.

Aptos ($APT) Continues Growth
APT continues to exhibit positive growth. It increased by 32% in December 2023, reaching a local high of $9.2. Currently, the coin is trading in a sideways range, with support at $8.00 and resistance at $8.75-$9.20.
If BTC maintains above $40,000, APT's growth is likely to persist. The next major target for buyers would be the psychologically significant $10 mark. Beyond this point, APT's growth could accelerate, considering its prolonged absence from these price levels, potentially rendering current resistance levels obsolete.
In a downturn scenario, APT might fall to the $7.30-$7.62 range or even test the $7 level. It's important to note that private APT investors recently unlocked a significant number of coins bought at $2-$3. Consequently, any correction in the Aptos market could exert downward pressure on its price due to the increased supply.
APT: Bullish Pennant BreakoutTrade setup : Bullish breakout from Pennant pattern signals resumption of uptrend with upside potential to $10.00. Stop loss at $7.30. Previously, price broke above 200-day moving average, which confirmed a bullish trend reversal to an Uptrend.
Pattern : Bullish Pennant - forms typically following a sharp advance, followed by a brief triangular shaped consolidation in price (a small change in direction), before the previous uptrend (bullish) typically resumes. The period of consolidation should have lower volume and the breakouts should occur on higher volume.
Trend : Uptrend across all time horizons (Short- Medium- and Long-Term).
Momentum is Bullish (MACD Line is above MACD Signal Line and RSI is above 55).
Support and Resistance : Nearest Support Zone is $5.40 (previous resistance), then $4.70. The nearest Resistance Zone is $8.00, which it broke, then $10.00.

#APT/USDT#APT
The price has been trading in a downtrend since February 2023
This downtrend has been broken and it is expected that the price will rise linked to Bitcoin's upward movement
And with Haddock there was a disengagement in the movement.
Entry areas specified on the drawing
About price 5 $
With a goal of 14 $
Nearly 300% expected rate of increase
On more than one expected upward wave

APT: Bullish Pennant BreakoutTrade setup : Bullish breakout from Pennant pattern signals resumption of uptrend with upside potential to $8.00 or even $10.00. Stop loss at $6.60. Previously, price broke above 200-day moving average, which confirmed a bullish trend reversal to an Uptrend.
Pattern : Bullish Pennant - forms typically following a sharp advance, followed by a brief triangular shaped consolidation in price (a small change in direction), before the previous uptrend (bullish) typically resumes. The period of consolidation should have lower volume and the breakouts should occur on higher volume.
Trend : Uptrend across all time horizons (Short- Medium- and Long-Term).
Momentum is Bullish (MACD Line is above MACD Signal Line and RSI is above 55).
Support and Resistance : Nearest Support Zone is $5.40 (previous resistance), then $4.70. The nearest Resistance Zone is $8.00, then $10.00.

APT |Aptos| Purchase zone from $ 7.2 and belowI buy a token from 7.2 and below
There will be a very strong level.

APT: Bullish Pennant BreakoutTrade setup : Bullish breakout from Pennant pattern signals resumption of uptrend with upside potential to $8.00 or even $10.00. Stop loss at $6.60. Previously, price broke above 200-day moving average, which confirmed a bullish trend reversal to an Uptrend.
Pattern : Bullish Pennant - forms typically following a sharp advance, followed by a brief triangular shaped consolidation in price (a small change in direction), before the previous uptrend (bullish) typically resumes. The period of consolidation should have lower volume and the breakouts should occur on higher volume.
Trend : Uptrend across all time horizons (Short- Medium- and Long-Term).
Momentum is Mixed as MACD Line is below MACD Signal Line (Bearish) but RSI > 55 (Bullish). MACD Histogram bars are rising, which suggests that momentum could be nearing another upswing.
Support and Resistance : Nearest Support Zone is $5.40 (previous resistance), then $4.70. The nearest Resistance Zone is $8.00, then $10.00.

APTOS/USDT 1D. Cup forming. Phases. Target zones. Time zones.Here's hype Aptos blockchain chart.
When listed, dumped huge by about 71%. Similar as SUI for example now. After that - rocket pump for about 565%, showing "strength" of an instrument.
After that pump, huge cup started to form, which is shown in this idea.
1st phase of this pattern - is descending in the downtrend trend channel. You may also call it ABC correction.
After that, being in this channel - falling wedge started to form, which gave the beginning of the second phase of this big cup potentially(!). From the height price has corrected for about 85% of the impulse to the previously resistance of the local accumulation zone, which was also the first stop during the pump.
We're now being in the second phase of this cup, which is - accumulation. Right now potential horizontal channel is forming. It's worth noting, that this can last for a very long time, so you should notice that.
But, the plus is, that this asset is only the first cycle on market, so due to it, it might move very quickly(volatility), which can be used.
As for now, the price of the Aptos is breaking above the falling wedge and forming potential bull-flag(consolidation in the form of a triangle after an impulse). Hence - if the price breaks above this local triangle - the target zone will be the amount of the previous impulse which is about 82%. I have marked the potential targets zone on chart.
As a bonus, i have also pointed the approximate time zone of each next phase of a cup potentially:
1) 3d phase is rise towards the resistance of the cup, which is firstly 12$ zone, then - 20,4$ zone. This could happen somewhere in the spring 2024(april-june).
2) After that - next phase, which is the 4th one - breakout of cup and rise, which falls approximately on Fall 2024 in the date somewhere of october-november 2024(as altcoins local season right now).
As for now, the price is between 2 zones - support zone, which previously acted as the resistance, and the resistance local zone, which previously acted as support, this two zones form the channel, which the price is currently in right now.
Until we're walking in this channel - we might still see the move somewhere to the middle of the channel or even it's bottom part, to retest the broken falling wedge. Might even be the false breakout downwards if the market sees capitulation at the moment. Yet, it's likely to be bought out quite quickly. As to that matter, you might even use this period(somewhere about january-february potentially), if it will occurs, or just skip it and stay calm(don't react).
If price breaks the resistance - it might move to the next resistance zone, after which it's very likely to see the pullback(mention timezone above), after which rising to the resistance of the cup. In that case - very beautiful cup will be formed, which is very good for the manipulator(people will see that cup). After that, the price might see the movement to somewhere about 60-100$ zone approximately. Better make the update later with the clear targets. But those are the approximate milestones of this cup.
The volume is now seeing the compression, which can be observed on the volume indicator.

APT: Bullish PennantTrade setup : Price broke above 200-day moving average, which confirmed a bullish trend reversal to an Uptrend. However, price got overbought (RSI ~ 75) just as it reached $8.00 resistance and pulled back on profit taking by traders. Now it’s consolidating in a Bullish Pennant pattern. If it breaks above $7.15, it could signal resumption of uptrend with upside potential to $8.00 or even $10.00. If it breaks below 200-day MA, it could revisit $5.40 support.
Pattern : Bullish Pennant - forms typically following a sharp advance, followed by a brief triangular shaped consolidation in price (a small change in direction), before the previous uptrend (bullish) typically resumes. The period of consolidation should have lower volume and the breakouts should occur on higher volume.
Trend : Neutral on Short-Term basis and Uptrend on Medium- and Long-Term basis.
Momentum is Mixed as MACD Line is below MACD Signal Line (Bearish) but RSI ~ 50 (Neutral).
Support and Resistance : Nearest Support Zone is $5.40 (previous resistance), then $4.70. The nearest Resistance Zone is $8.00, then $10.00.

APTAPT - Buy now and thank me later
ALL targets you see on the chart
You can buy on SPOT or long it
SL you can see also on the chart

aptIt is located between a support and resistance level. The failure of each side should be re-examined
