#APT/USDT
#APT
The price is moving in a descending channel on the 1-hour timeframe. It has reached the lower boundary and is heading towards a breakout, with a retest of the upper boundary expected.
We are seeing a bearish trend in the Relative Strength Index (RSI), which has reached near the lower boundary, and an upward bounce is expected.
There is a key support zone in green at 0.250, and the price has bounced from this level several times. Another bounce is expected.
We are seeing a trend towards stabilizing above the 100-period moving average, which we are approaching, supporting the upward trend.
Entry Price: 0.264
First Target: 0.270
Second Target: 0.280
Third Target: 0.291
Remember a simple principle: Money Management.
Place your stop-loss order below the green support zone.
For any questions, please leave a comment.
Thank you.
APTBTC

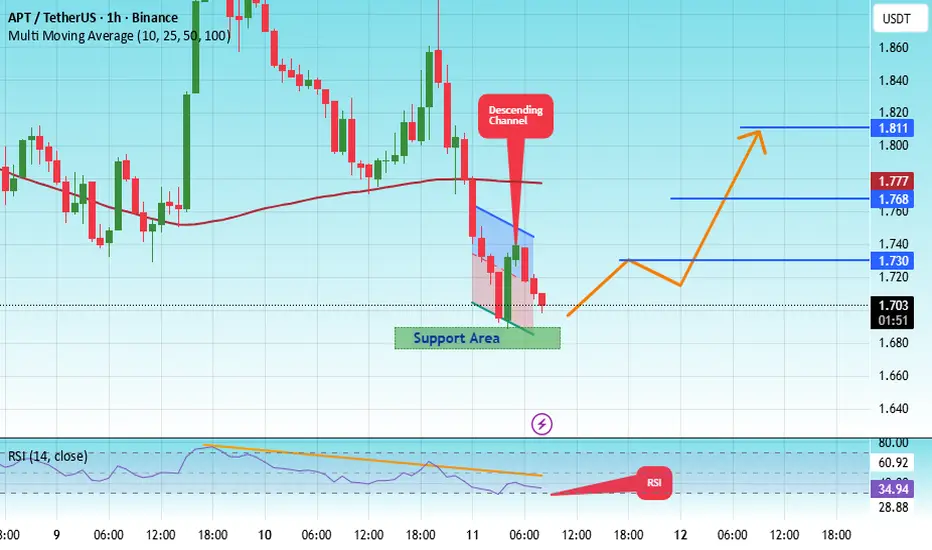
##APT/USDT 1H – Stablecoin-heavy, swing long from local base#APT
The price is moving in a descending channel on the 1-hour timeframe. It has reached the lower boundary and is heading towards a breakout, with a retest of the upper boundary expected.
We are seeing a bearish trend in the Relative Strength Index (RSI), which has reached near the lower boundary, and an upward bounce is expected.
There is a key support zone in green at 1.62, and the price has bounced from this level several times. Another bounce is expected.
We are seeing a trend towards stabilizing above the 100-period moving average, which we are approaching, supporting the upward trend.
Entry Price: 1.71
First Target: 1.75
Second Target: 1.80
Third Target: 1.87
Remember a simple principle: Money Management.
Place your stop-loss order below the green support zone.
For any questions, please leave a comment.
Thank you.

#APT/USDT #APT The price is moving in a descending channel on #APT
The price is moving in a descending channel on the 1-hour timeframe. It has reached the lower boundary and is heading towards breaking above it, with a retest of the upper boundary expected.
We have a downtrend on the RSI indicator, which has reached near the lower boundary, and an upward rebound is expected.
There is a key support zone in green at 1.68. The price has bounced from this zone multiple times and is expected to bounce again.
We have a trend towards consolidation above the 100-period moving average, as we are moving close to it, which supports the upward movement.
Entry price: 1.70
First target: 1.73
Second target: 1.76
Third target: 1.81
Don't forget a simple principle: money management.
Place your stop-loss below the support zone in green.
For any questions, please leave a comment.
Thank you.
APT Buy/Long (4H)A solid structure shift has occurred on the chart, and a liquidity pool is visible above. If price reaches our entry zones before touching the supply area, we will enter the position.
We have two entry points, and we will enter using a DCA approach.
The targets are marked on the chart.
A daily candle close below the invalidation level will invalidate this analysis.
For risk management, please don't forget stop loss and capital management
When we reach the first target, save some profit and then change the stop to entry
Comment if you have any questions
Thank You

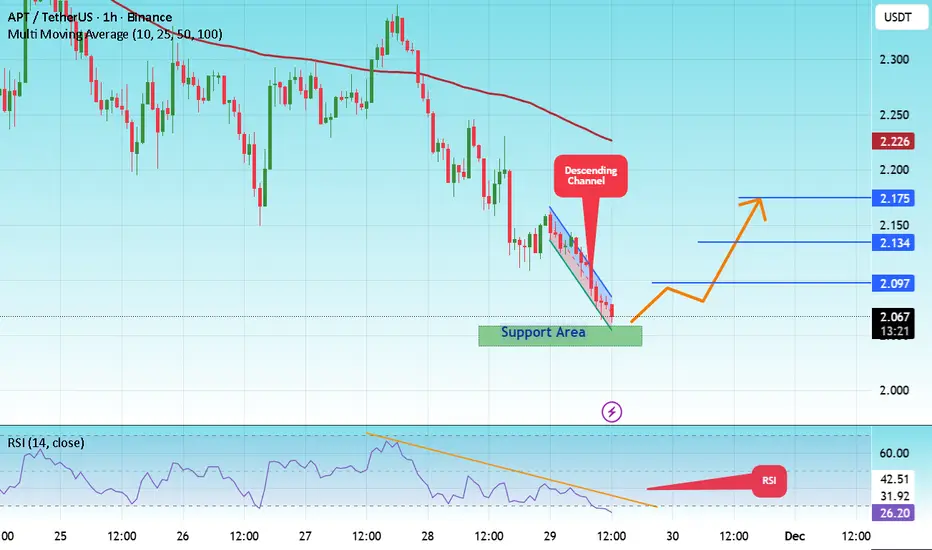
#APT/USDT 1H – Stablecoin-heavy, swing long from local base#APT
The price is moving in a descending channel on the 1-hour timeframe. It has reached the lower boundary and is heading towards a breakout, with a retest of the upper boundary expected.
We are seeing a bearish bias in the Relative Strength Index (RSI), which has reached near the lower boundary, and an upward bounce is expected.
There is a key support zone in green at 1.80. The price has bounced from this level several times and is expected to bounce again.
We are seeing a trend towards stabilizing above the 100-period moving average, which we are approaching, supporting the upward trend.
Entry Price: 1.82
First Target: 1.86
Second Target: 1.90
Third Target: 1.95
Remember a simple principle: Money Management.
Place your stop-loss order below the green support zone.
For any questions, please leave a comment.
Thank you.
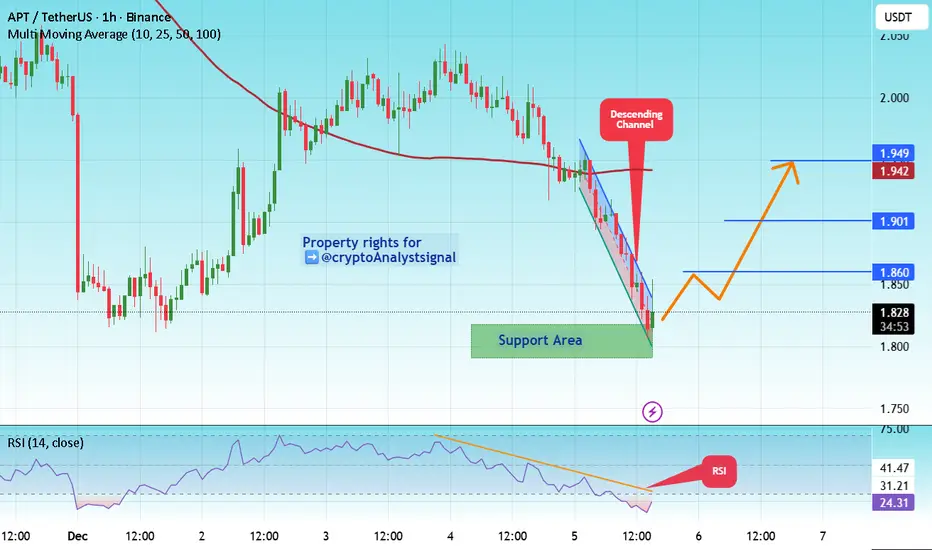
#APT/USDT 1H – Stablecoin-heavy, swing long from local base#APT
The price is moving in a descending channel on the 1-hour timeframe. It has reached the lower boundary and is heading towards a breakout, with a retest of the upper boundary expected.
We are seeing a bearish bias in the Relative Strength Index (RSI), which has reached near the lower boundary, and an upward bounce is expected.
There is a key support zone in green at 2.05. The price has bounced from this level several times and is expected to bounce again.
We are seeing a trend towards stabilizing above the 100-period moving average, which we are approaching, supporting the upward trend.
Entry Price: 2.06
First Target: 2.097
Second Target: 2.134
Third Target: 2.175
Remember a simple principle: Money Management.
Place your stop-loss order below the green support zone.
For any questions, please leave a comment.
Thank you.
#APT/USDT 1H – Stablecoin-heavy, swing long from local base#APT
The price is moving in a descending channel on the 1-hour timeframe. It has reached the lower boundary and is heading towards breaking above it, with a retest of the upper boundary expected.
We have a downtrend on the RSI indicator, which has reached near the lower boundary, and an upward rebound is expected.
There is a key support zone in green at 1.81. The price has bounced from this zone multiple times and is expected to bounce again.
We have a trend towards consolidation above the 100-period moving average, as we are moving close to it, which supports the upward movement.
Entry price: 1.84
First target: 1.87
Second target: 1.90
Third target: 1.95
Don't forget a simple principle: money management.
Place your stop-loss below the support zone in green.
For any questions, please leave a comment.
Thank you.

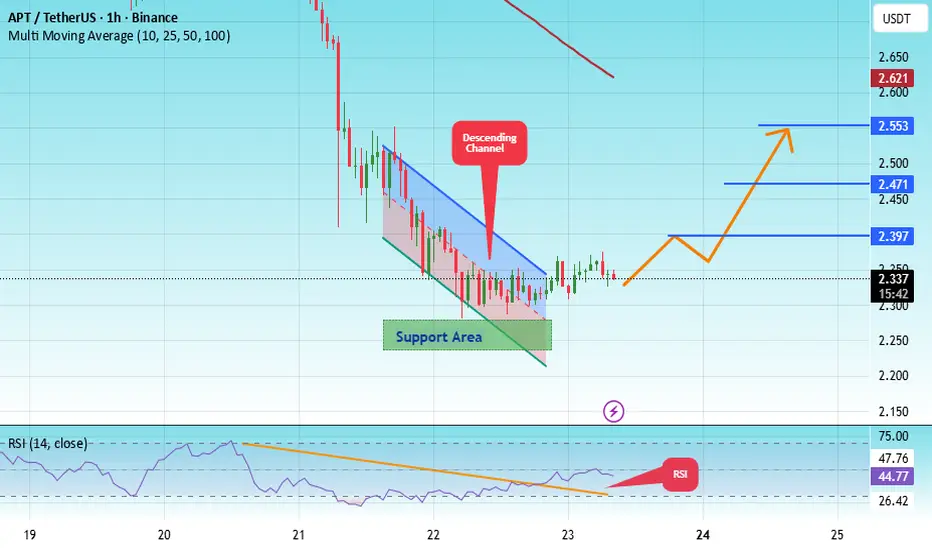
#APT/USDT 1H – Stablecoin-heavy, swing long from local base#APT
The price is moving within an ascending channel on the 1-hour timeframe and is adhering to it well. It is poised to break out strongly and retest the channel.
We have a downtrend line on the RSI indicator that is about to break and retest, which supports the upward move.
There is a key support zone in green at the price of 2.25, representing a strong support point.
We have a trend of consolidation above the 100-period moving average.
Entry price: 2.33
First target: 2.40
Second target: 2.47
Third target: 2.553
Don't forget a simple money management rule:
Place your stop-loss order below the support zone in green.
Once the first target is reached, save some money and then change your stop-loss order to an entry order.
For any questions, please leave a comment.
Thank you.
#APT/USDT#APT
The price is moving within an ascending channel on the 1-hour timeframe and is adhering to it well. It is poised to break out strongly and retest the channel.
We have a downtrend line on the RSI indicator that is about to break and retest, which supports the upward move.
There is a key support zone in green at the price of 2.59, representing a strong support point.
We have a trend of consolidation above the 100-period moving average.
Entry price: 2.62
First target: 2.65
Second target: 2.71
Third target: 2.81
Don't forget a simple money management rule:
Place your stop-loss order below the support zone in green.
Once the first target is reached, save some money and then change your stop-loss order to an entry order.
For any questions, please leave a comment.
Thank you.

#APT/USDT bearish structural bias#APT
The price is moving in an ascending channel on the 1-hour frame, adhering well to it, and heading for a strong breakout and retest.
We have a bearish trend on the RSI indicator that is about to be broken and retested, which supports the upward breakout.
There is a major support area in green at 3.36, representing a strong support point.
We are heading for consolidation above the 100 moving average.
Entry price: 3.48
First target: 3.53
Second target: 3.63
Third target: 3.77
Don't forget a simple matter: capital management.
When you reach the first target, save some money and then change your stop-loss order to an entry order.
For inquiries, please leave a comment.
Thank you.

#APT/USDT bearish structural bias#APT
The price is moving within a descending channel on the 1-hour frame, adhering well to it, and is heading for a strong breakout and retest.
We have a bearish trend on the RSI indicator that is about to be broken and retested, which supports the upward move.
There is a major support area in green at 3.75, representing a strong support point.
We are heading for consolidation above the 100 moving average.
Entry price: 3.83
First target: 4.00
Second target: 4.22
Third target: 4.546
Don't forget a simple matter: capital management.
When you reach the first target, save some money and then change your stop-loss order to an entry order.
For inquiries, please leave a comment.
Thank you.

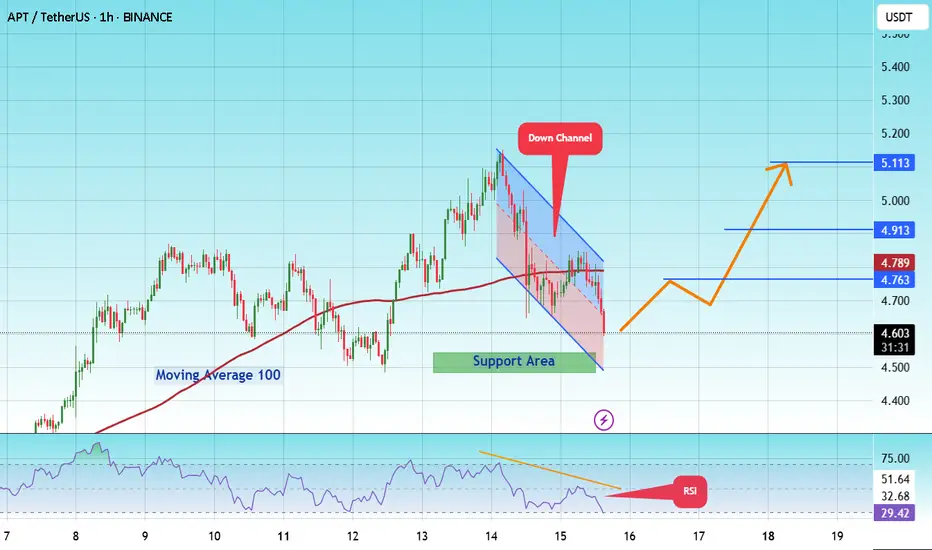
#APT/USDT Establish Support Zone !#APT
The price is moving within a descending channel on the 1-hour frame and is expected to break and continue upward.
We have a trend to stabilize above the 100 moving average once again.
We have a downtrend on the RSI indicator that supports the upward break.
We have a support area at the lower boundary of the channel at 4.54, acting as strong support from which the price can rebound.
We have a major support area in green that pushed the price higher at 4.49.
Entry price: 4.62.
First target: 4.76.
Second target: 4.91.
Third target: 5.11.
To manage risk, don't forget stop loss and capital management.
When you reach the first target, save some profits and then change your stop order to an entry order.
For inquiries, please comment.
Thank you.
APTUSDT Forming Falling WedgeAPTUSDT is currently forming a falling wedge pattern, which is widely recognized as a bullish reversal structure in technical analysis. This setup often emerges after a corrective phase and signals a potential shift in momentum once the price breaks out to the upside. With the wedge narrowing and volume showing healthy levels, the probability of a breakout rally is increasing. Based on the chart outlook, the expected gain for this move could range between 30% to 40%+, making it an attractive opportunity for traders and investors.
The falling wedge pattern highlights a gradual decline in selling pressure while accumulation quietly builds at lower levels. As the price action continues to compress, it sets the stage for a strong bullish breakout once resistance levels are cleared. This kind of setup is often followed by impulsive upward moves, especially if accompanied by an increase in trading activity and investor participation.
Investor sentiment around APTUSDT is showing improvement, with growing interest in this project suggesting that market confidence is returning. As accumulation strengthens and the wedge pattern completes, the pair could enter a new bullish phase. Traders should monitor closely for breakout confirmation, as it may unlock higher price targets in the coming weeks.
✅ Show your support by hitting the like button and
✅ Leaving a comment below! (What is You opinion about this Coin)
Your feedback and engagement keep me inspired to share more insightful market analysis with you!

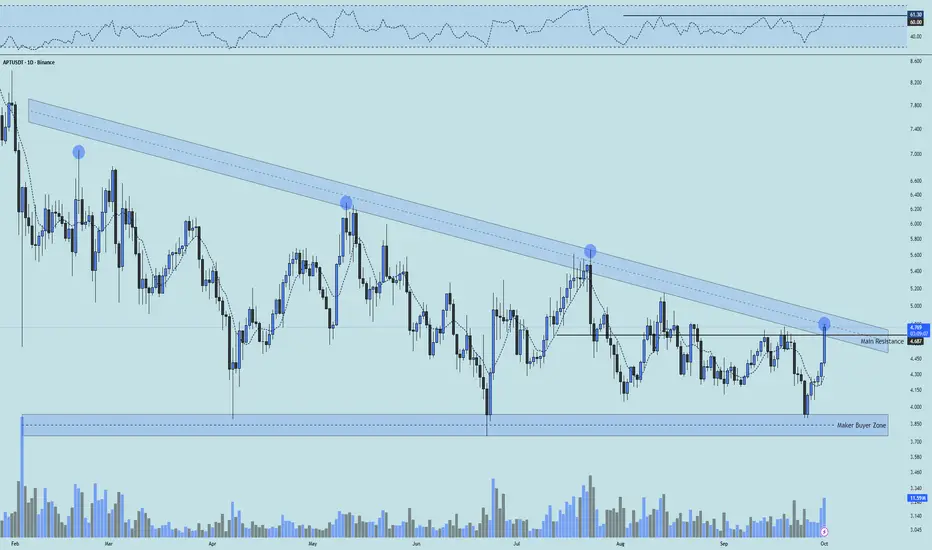
APT 1D Analysis - Key Triggers Ahead☃️ Welcome to the cryptos winter , I hope you’ve started your day well.
⏰ We’re analyzing APT on the 1-Day timeframe .
👀 On the daily timeframe for Aptos, we can see it's ranked 36 on CoinMarketCap, and its 24h trading volume is around 16% of its total market cap. This indicates heavy activity and high liquidity. APT is moving inside a triangular range, currently consolidating at the end of this triangle, with signs of a potential breakout. If it breaks and confirms above this structure, the coin could begin a price recovery after 240 days of ranging and selling pressure, pushing toward its higher resistances. The key resistance right now is at $4.7, and a confirmed breakout above this level can send it toward its next resistance zones.
🧮 Looking at the RSI oscillator, it was ranging inside a box between the 30–60 zone. On the 4th touch, the top of the box was broken and RSI crossed above 60. Our main RSI confirmation comes with a daily candle close above the $4.7 resistance, along with RSI stabilizing above 60, which would trigger increased volume, volatility, and even push RSI toward the overbought zone.
🕯 The size, volume, and number of recent green candles after the last touch of the maker-buyer zone have noticeably increased, with 6 bullish candles pushing the price toward the key resistance. Market participants in crypto are waiting to see the reaction here. From a time perspective, the coin spent 240 days in a descending range and completed a proper correction. Now that it's in the final squeeze phase, buying volume has increased well, and if the momentum continues, the coin could see a strong price rally.
💸 On the BINANCE:APTBTC pair, we can see it's at the end of the triangle and has almost pushed above its resistance with a whale candle, though volume is still relatively low. If the price stabilizes above the marked resistance on this pair and we also see rising volume on the USDT pair, a significant outperformance against Bitcoin is likely. This could attract whale attention and encourage rotation from BTC into APT.
🧠 For positioning on Aptos, entering with a reasonable risk makes sense, especially since after 240 days it's showing signs of forming a higher low and potentially a higher high. With a breakout above $4.7, the coin can continue toward its upper resistance levels.
↗️ Long Scenario: Breakout and confirmation above $4.7, with RSI stabilizing above the 60 zone as seen in the analysis, along with a confirmed breakout and support hold on the BTC pair. With increasing long volume and a completed pullback, entering on a secure higher low in multi-timeframe structure would be valid.
📉 Short Scenario (Risky): It's almost unlikely that the coin drops significantly from current levels, but if it does, losing the maker-buyer zone on both USDT and BTC pairs could trigger a deep correction with maximum selling pressure. Keep in mind, short positions in this phase of market compression breakouts are generally illogical since price reversals are very likely in these trends.
❤️ Disclaimer : This analysis is purely based on my personal opinion and I only trade if the stated triggers are activated .
APTUSDT Forming Falling WedgeAPTUSDT is currently forming a falling wedge pattern, which is widely recognized as a bullish reversal structure in technical analysis. This setup often emerges after a corrective phase and signals a potential shift in momentum once the price breaks out to the upside. With the wedge narrowing and volume showing healthy levels, the probability of a breakout rally is increasing. Based on the chart outlook, the expected gain for this move could range between 30% to 40%+, making it an attractive opportunity for traders and investors.
The falling wedge pattern highlights a gradual decline in selling pressure while accumulation quietly builds at lower levels. As the price action continues to compress, it sets the stage for a strong bullish breakout once resistance levels are cleared. This kind of setup is often followed by impulsive upward moves, especially if accompanied by an increase in trading activity and investor participation.
Investor sentiment around APTUSDT is showing improvement, with growing interest in this project suggesting that market confidence is returning. As accumulation strengthens and the wedge pattern completes, the pair could enter a new bullish phase. Traders should monitor closely for breakout confirmation, as it may unlock higher price targets in the coming weeks.
✅ Show your support by hitting the like button and
✅ Leaving a comment below! (What is You opinion about this Coin)
Your feedback and engagement keep me inspired to share more insightful market analysis with you!

APTUSDT UPDATE#APT
UPDATE
APT Technical Setup
Pattern: Bullish falling wedge breakout
Current Price: $4.64
Target Price: $7.55
Target % Gain: 65.55%
APT is breaking out of a falling wedge pattern on the 1D timeframe. The breakout signals bullish momentum with upside potential toward $7.55. Market structure supports continuation if buyers maintain strength. Always use proper risk management.

#APT/USDT is currently strongly bullish
#APT
The price is moving within a descending channel on the 1-hour frame, adhering well to it, and is heading for a strong breakout and retest.
We have a bearish trend on the RSI indicator that is about to be broken and retested, which supports the upward breakout.
There is a major support area in green at 4.20, representing a strong support point.
We are heading for consolidation above the 100 moving average.
Entry price: 4.30
First target: 4.37
Second target: 4.43
Third target: 4.50
Don't forget a simple matter: capital management.
When you reach the first target, save some money and then change your stop-loss order to an entry order.
For inquiries, please leave a comment.
Thank you.

APTUSDT UPDATE#APT
UPDATE
APT Technical Setup
Pattern: Bullish Falling Wedge Pattern
Current Price: $4.67
Target Price: $6.36
Target % Gain: 35.22%
AMEX:APT is breaking out of a falling wedge pattern on the 1D timeframe. Current price is $4.67 with a target near $6.36, showing about 35% potential upside. The breakout confirms bullish momentum with structure favoring continuation. Always use proper risk management.
Time Frame: 1D
Risk Management Tip: Always use proper risk management.

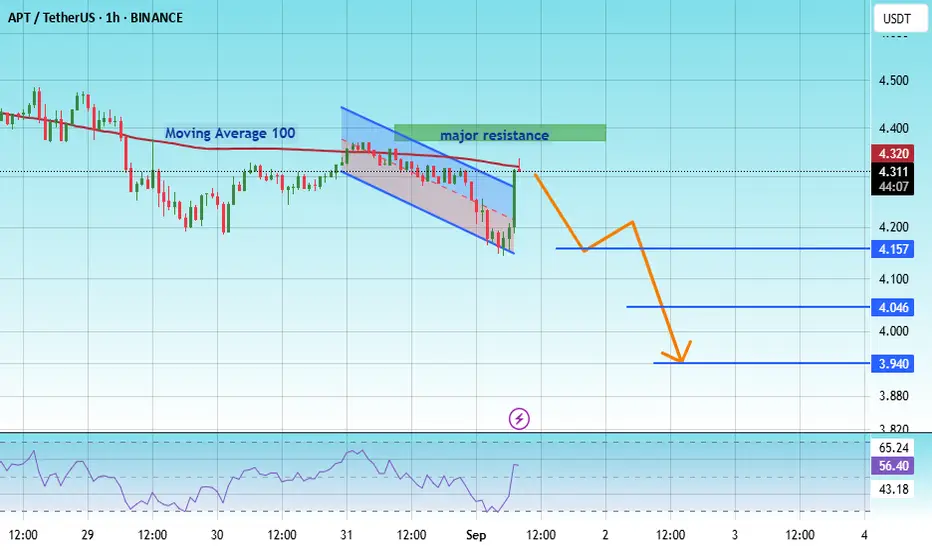
#APT/USDT - A lower timeframe view - Breakout Entry#APT
The price is moving within a descending channel on the 1-hour frame, adhering well to it, and is heading for a strong breakout and retest.
We have a bearish trend on the RSI indicator that is about to be broken and retested, which supports the decline.
There is a major resistance area (marked in green) at 4.32, which represents strong resistance.
For inquiries, please leave a comment.
We are in a consolidation trend below the 100 moving average.
Entry price: 4.324
First target: 4.15
Second target: 4.046
Third target: 3.94
Don't forget a simple matter: capital management.
When you reach the first target, save some money and then change your stop-loss order to an entry order.
For inquiries, please leave a comment.
Thank you.
APT Analysis (3D)First of all, pay attention to the timeframe | it’s a higher timeframe and takes longer.
It seems that the price is in wave C of a bearish pattern. The price is trading below the supply zone, and in order to break this area, buy orders need to be accumulated.
It is expected that the price will move toward the green zone, where wave C may complete, and then we could see some recoveries from the price within the green zone.
For risk management, please don't forget stop loss and capital management
Comment if you have any questions
Thank You

#APT/USDT Buyers Need To Establish Support Zone#APT
The price is moving within an ascending channel on the 1-hour frame, adhering well to it, and is on track to break it strongly upwards and retest it.
We have support from the lower boundary of the ascending channel, at 4.68.
We have a downtrend on the RSI indicator that is about to break and retest, supporting the upside.
There is a major support area in green at 4.63, which represents a strong basis for the upside.
Don't forget a simple thing: ease and capital.
When you reach the first target, save some money and then change your stop-loss order to an entry order.
For inquiries, please leave a comment.
We have a trend to hold above the 100 Moving Average.
Entry price: 4.70.
First target: 4.75.
Second target: 4.87.
Third target: 5.00.
Don't forget a simple thing: ease and capital.
When you reach the first target, save some money and then change your stop-loss order to an entry order.
For inquiries, please leave a comment.
Thank you.

Crypto Market - 1 month (30 days) left until #ALTSZN endsSometimes, the market forces you to take a pause. The last few weeks have been exactly that for me. Health issues knocked me off my game, and my first thought, of course, was that it was due to the nerves and immense responsibility of this public #AltsznLive experiment. But after some self-reflection, I realized - it's not the trading stress. I've been in this game for 11 years and learned how to handle the pressure long ago.
This experience only reminded me of the most important rule in our profession: the ability to take a step back. To step away from the charts, to rethink your strategy, to do something completely different. Over the years, I've taken such breaks many times, and each time I returned stronger, with a clearer vision. And this latest pause has led me to some profound thoughts that I simply must share with you.
Everyone is searching for a Holy Grail in indicators, signals, and other people's opinions. But the only true grail is found within yourself. Success in trading is a direct consequence of deep and brutally honest self-analysis.
In February of this year, I decided to tackle a big task: completely updating my educational Academy. This has always been a point of growth for me - structuring knowledge, learning new things. I created a detailed course plan, wrote down all the current relevant topics, and when I got to the section on "AI Agents," I stopped. And I disappeared. I went down that rabbit hole for four months, completely absorbed.
I realized that the old format of education no longer works. It doesn't even inspire me anymore. So, I postponed the Academy update indefinitely. Instead, I focused on AI Agents. I saw in them not just a topic for a lesson, but the future - an army of personal assistants that can radically improve efficiency. I started creating them for myself, for my tasks, for my analysis.
And I don't plan on stopping. In the coming bear market, I will dedicate even more time to this. Perhaps, a completely new, previously unimaginable format for the Academy will be born from this. I won't be publishing detailed content about the development process, but I will certainly share the most interesting developments with my community.
Why I Still Believe in September
This final push, which I've called "Altszn Live," fits perfectly into the market vision I formed long before it began. My core thesis remains unchanged: I believe the current growth cycle will end in September 2025. As in, next month.
Right now, amidst the rally, I'm getting a flood of messages telling me I'm wrong, that the real altseason will be pushed to Q4, that everything is just getting started. And you know what? Maybe they're right. I fully admit that I could be wrong. I'm not trying to win a prediction contest. I won't get a medal for being right, and I won't be devastated if I'm mistaken - in 11 years, I've been wrong thousands of times, and there's nothing terrible about it.
But I trust my system and my analysis more than the market noise. I will exit my positions in September and I will not re-enter the market until the end of the year, even if it goes to the moon. This site is called TradingView. A place where people share their vision. And this is my vision. The market is a living, pulsating organism. And I am here to study it, not to prove that I am right.
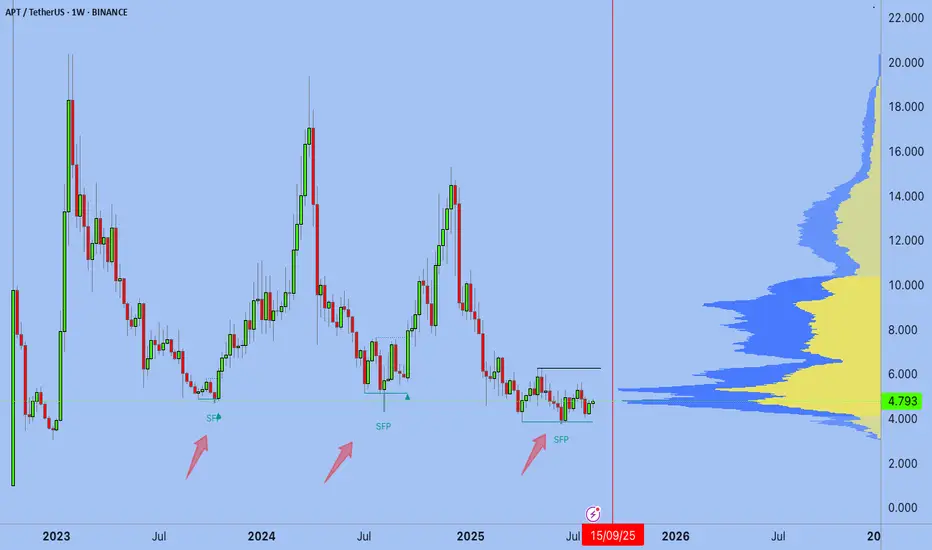
A Deep Dive into Aptos ( AMEX:APT )
So why am I betting on it again, on the supposed "loser"? Let's break it down.
- The Counter-Argument and My Rebuttal: Yes, in the L1 narrative war, Aptos lost to SUI. Yes, it has complex tokenomics with constant unlocks that put pressure on the price. I see all of this. I am not betting on the obvious favorite. I am betting on market inefficiency.
– The Entry Point: In trading, what matters is not just being right, but the price at which you enter. And right now, the entry point for Aptos looks far more attractive and safer to me than many other "overheated" projects that are already on everyone's lips.
– The Behavioral Pattern: Aptos is slow. It's always late to the party. It doesn't lead the charge. BUT. When it starts to move, its growth becomes abnormally strong. Every single correction, no matter how small, is bought up instantly and aggressively. It just goes up, and up, and up. That's how it was last time. I am betting that the psychology of major players and the behavior of this asset have not changed.
– The RWA Conviction: I will be blunt. I am deeply disappointed in 99% of altcoins. The more I research, the more I understand that most of these tokens are useless and provide no real value. My long-term conviction lies in the tokenization of real-world assets (RWA). And Aptos is one of the TOP 3 blockchains leading this narrative.
Technically
- Unverified SFP
- APTBTC potential reversal
- APTETH I don't see any signs of a reversal
- APTUSD in my area of interest
- after the 6.25 break a rally should start
Fundamental:
Aptos is a project with extremely high potential but with corresponding risks. It can be described as a "blue-chip venture bet." The technology, team, and investors are top-tier (10/10). However, the weak and initially non-transparent tokenomics (4/10) is a major deterrent.
The project is fairly valued by the market as a high-risk, high-reward asset. It is not a "hidden gem" due to its fame, nor is it a "scam," given its strong fundamentals. It is recommended for consideration as part of a diversified portfolio for investors with a high risk tolerance who are betting on the team and the long-term adoption of the Move technology.
I plan to hold all my spot and futures positions until September 13th.
Let's see together how it plays out.
What's Next?
Many of the coins I've mentioned before - LINK, ETH, and others-have already taken off. I am intentionally not publishing a flood of ideas this season. As I said, I'm disappointed with most of the market.
After September, when I close this challenge, I will report back on the results - both the wins and the losses. And I will be sure to share my plans for what I'll be doing with my stablecoins next.
I'm not the kind of author who publishes ten posts a day. I only share my thoughts when I truly have something to say. If you're interested in my journey, my approach, and my ideas - just leave a like on this post. Follow me if you want, don't if you don't. I am here to share my analysis; that's just how it's been since the beginning of my journey on TradingView.
Much love to you all.
With love, your EXCAVO.
#APT/USDT Buyers Need To Establish Support Zone#APT
The price is moving within an ascending channel on the 1-hour frame, adhering well to it, and is on its way to break strongly upwards and retest it.
We have support from the lower boundary of the ascending channel, at 4.10.
We have a downtrend on the RSI indicator that is about to break and retest, supporting the upside.
There is a major support area in green at 4.05, which represents a strong basis for the upside.
Don't forget a simple thing: ease and capital.
When you reach the first target, save some money and then change your stop-loss order to an entry order.
For inquiries, please leave a comment.
We have a trend to hold above the Moving Average 100.
Entry price: 4.25.
First target: 4.35.
Second target: 4.46.
Third target: 4.05.
Don't forget a simple thing: ease and capital.
When you reach the first target, save some money and then change your stop-loss order to an entry order.
For inquiries, please leave a comment.
Thank you.
