APT is about to make a bullish move soon (4H)Since we marked the green arrow on the chart, a clear bullish phase has started on APT. Based on the current price structure, it appears that this phase is forming a bullish symmetrical pattern, and at the moment, we are navigating through wave F of this structure.
From a market dynamics perspective, market makers have pushed the price away from the lows with strong momentum. This move is carefully designed to create FOMO among retail buyers. Once retail participants jump in, the price is allowed to correct downward, shaking out those who entered at higher levels. This is a common tactic where market makers consolidate positions and remove weak hands before driving the price upward in the next bullish leg. Understanding this behavior is crucial for traders looking to avoid being trapped in premature entries.
Looking more closely at wave F, it is currently a bearish corrective wave within the larger bullish context. After the anticipated drop and reaching our predefined entry zones, APTOS may complete wave F and begin transitioning into wave G, which is expected to be a strong bullish wave. Wave G could offer the next opportunity for upward momentum and potential profit if entered carefully.
We have identified two key entry points on the chart. Traders should consider entering gradually using DCA (Dollar-Cost Averaging) to minimize risk and avoid overexposure, especially during periods of high volatility. Proper position sizing is critical here, as the market may continue to test lower levels before confirming the bullish wave.
The targets for this bullish move are clearly marked on the chart. Monitoring price action near these levels will help determine whether the wave structure is unfolding as expected. Additionally, it’s important to note that a daily candle close below the invalidation level would invalidate this analysis, signaling that the current wave count or bullish setup may no longer hold. Risk management and adherence to stop levels are essential to protect capital in case the market moves against the expected direction.
From a technical and psychological standpoint, this pattern illustrates how market makers manipulate momentum, retail behavior, and FOMO to their advantage. Recognizing these patterns allows traders to time their entries more effectively, avoid emotional decisions, and follow a disciplined plan that aligns with the market structure.
In conclusion, the current setup on APTOS presents a well-defined bullish opportunity, but it requires patience, discipline, and careful monitoring of the chart and price action. Entering at the designated DCA points, respecting invalidation levels, and aiming for the marked targets creates a structured trading approach that aligns with the ongoing market dynamics.
If you have a coin or altcoin you want analyzed, first hit the like button and then comment its name so I can review it for you.
This is not a trade setup, as it has no precise stop-loss, stop, or target. I do not publish my trade setups here.
APTUSD

APTUSDT SHORT SCALP IDEA BEARSH
Price is trading inside a higher-timeframe supply zone
Price is currently reacting from a higher-timeframe supply zone, and I’m expecting a pullback to test demand again before any meaningful continuation.
Short-term bearish / corrective
scalp-focused idea
⚠️ Disclaimer
This analysis reflects my personal opinion and is for educational purposes only. It is not financial advice. Trading involves risk—always manage risk and make your own decisions.

#APT/USDT
#APT
The price is moving in a descending channel on the 1-hour timeframe. It has reached the lower boundary and is heading towards a breakout, with a retest of the upper boundary expected.
We are seeing a bearish trend in the Relative Strength Index (RSI), which has reached near the lower boundary, and an upward bounce is expected.
There is a key support zone in green at 0.250, and the price has bounced from this level several times. Another bounce is expected.
We are seeing a trend towards stabilizing above the 100-period moving average, which we are approaching, supporting the upward trend.
Entry Price: 0.264
First Target: 0.270
Second Target: 0.280
Third Target: 0.291
Remember a simple principle: Money Management.
Place your stop-loss order below the green support zone.
For any questions, please leave a comment.
Thank you.

##APT/USDT 1H – Stablecoin-heavy, swing long from local base#APT
The price is moving in a descending channel on the 1-hour timeframe. It has reached the lower boundary and is heading towards a breakout, with a retest of the upper boundary expected.
We are seeing a bearish trend in the Relative Strength Index (RSI), which has reached near the lower boundary, and an upward bounce is expected.
There is a key support zone in green at 1.62, and the price has bounced from this level several times. Another bounce is expected.
We are seeing a trend towards stabilizing above the 100-period moving average, which we are approaching, supporting the upward trend.
Entry Price: 1.71
First Target: 1.75
Second Target: 1.80
Third Target: 1.87
Remember a simple principle: Money Management.
Place your stop-loss order below the green support zone.
For any questions, please leave a comment.
Thank you.

#APT/USDT #APT The price is moving in a descending channel on #APT
The price is moving in a descending channel on the 1-hour timeframe. It has reached the lower boundary and is heading towards breaking above it, with a retest of the upper boundary expected.
We have a downtrend on the RSI indicator, which has reached near the lower boundary, and an upward rebound is expected.
There is a key support zone in green at 1.68. The price has bounced from this zone multiple times and is expected to bounce again.
We have a trend towards consolidation above the 100-period moving average, as we are moving close to it, which supports the upward movement.
Entry price: 1.70
First target: 1.73
Second target: 1.76
Third target: 1.81
Don't forget a simple principle: money management.
Place your stop-loss below the support zone in green.
For any questions, please leave a comment.
Thank you.
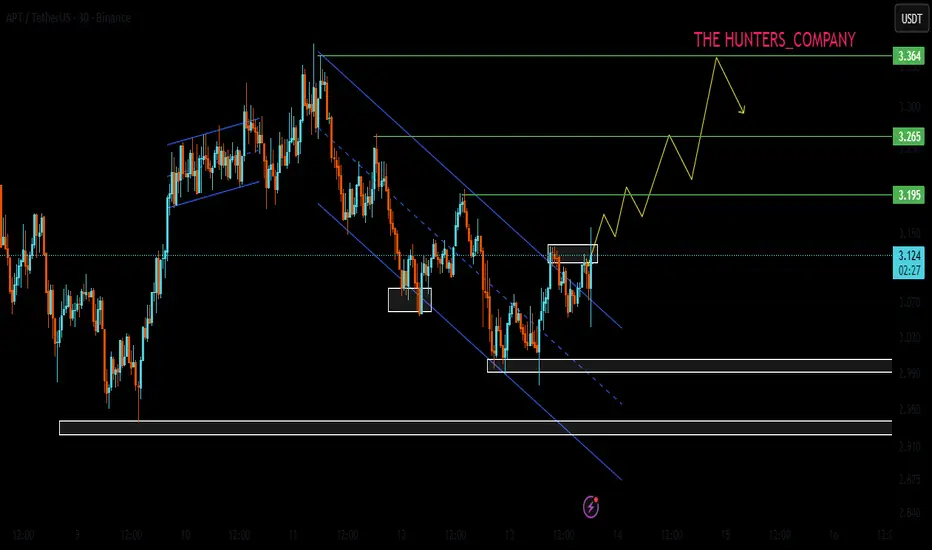
APT Buy/Long (4H)A solid structure shift has occurred on the chart, and a liquidity pool is visible above. If price reaches our entry zones before touching the supply area, we will enter the position.
We have two entry points, and we will enter using a DCA approach.
The targets are marked on the chart.
A daily candle close below the invalidation level will invalidate this analysis.
For risk management, please don't forget stop loss and capital management
When we reach the first target, save some profit and then change the stop to entry
Comment if you have any questions
Thank You

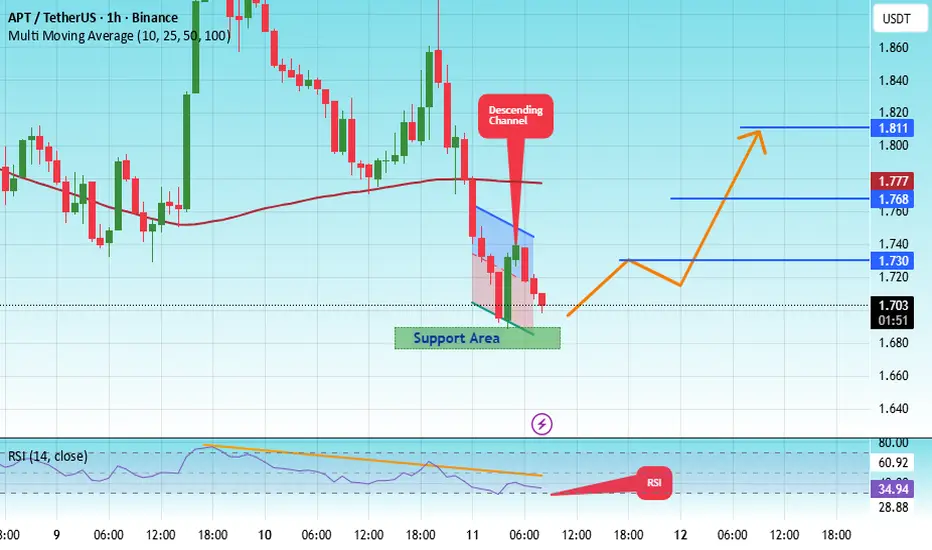
#APT/USDT 1H – Stablecoin-heavy, swing long from local base#APT
The price is moving in a descending channel on the 1-hour timeframe. It has reached the lower boundary and is heading towards a breakout, with a retest of the upper boundary expected.
We are seeing a bearish bias in the Relative Strength Index (RSI), which has reached near the lower boundary, and an upward bounce is expected.
There is a key support zone in green at 1.80. The price has bounced from this level several times and is expected to bounce again.
We are seeing a trend towards stabilizing above the 100-period moving average, which we are approaching, supporting the upward trend.
Entry Price: 1.82
First Target: 1.86
Second Target: 1.90
Third Target: 1.95
Remember a simple principle: Money Management.
Place your stop-loss order below the green support zone.
For any questions, please leave a comment.
Thank you.
Aptos Bullish Divergence: Targeting $4.3–$15 Range Aptos has stabilized above the last weekly support; currently, there is a bullish divergence on the weekly chart, so all signals point to a likely upward push. The current range to play is $4.3–$15, and the risk-reward in this case is really good. Thanks to everyone for your attention.

#APT/USDT 1H – Stablecoin-heavy, swing long from local base#APT
The price is moving in a descending channel on the 1-hour timeframe. It has reached the lower boundary and is heading towards a breakout, with a retest of the upper boundary expected.
We are seeing a bearish bias in the Relative Strength Index (RSI), which has reached near the lower boundary, and an upward bounce is expected.
There is a key support zone in green at 2.05. The price has bounced from this level several times and is expected to bounce again.
We are seeing a trend towards stabilizing above the 100-period moving average, which we are approaching, supporting the upward trend.
Entry Price: 2.06
First Target: 2.097
Second Target: 2.134
Third Target: 2.175
Remember a simple principle: Money Management.
Place your stop-loss order below the green support zone.
For any questions, please leave a comment.
Thank you.
#APT/USDT 1H – Stablecoin-heavy, swing long from local base#APT
The price is moving in a descending channel on the 1-hour timeframe. It has reached the lower boundary and is heading towards breaking above it, with a retest of the upper boundary expected.
We have a downtrend on the RSI indicator, which has reached near the lower boundary, and an upward rebound is expected.
There is a key support zone in green at 1.81. The price has bounced from this zone multiple times and is expected to bounce again.
We have a trend towards consolidation above the 100-period moving average, as we are moving close to it, which supports the upward movement.
Entry price: 1.84
First target: 1.87
Second target: 1.90
Third target: 1.95
Don't forget a simple principle: money management.
Place your stop-loss below the support zone in green.
For any questions, please leave a comment.
Thank you.

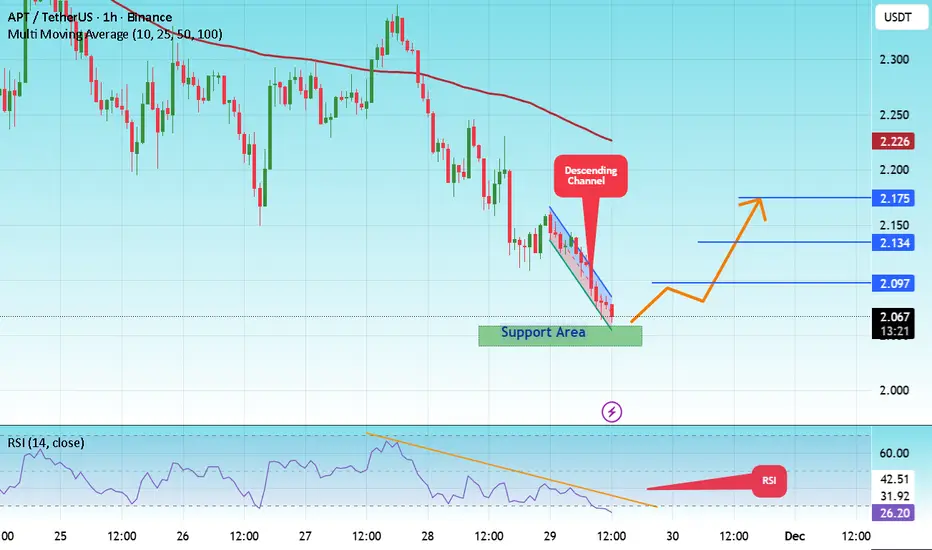
#APT/USDT 1H – Stablecoin-heavy, swing long from local base#APT
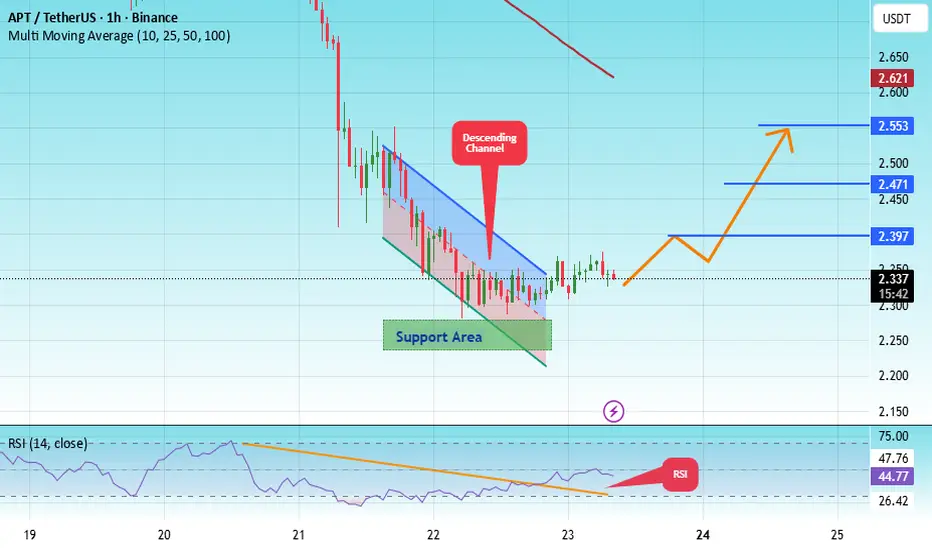
The price is moving within an ascending channel on the 1-hour timeframe and is adhering to it well. It is poised to break out strongly and retest the channel.
We have a downtrend line on the RSI indicator that is about to break and retest, which supports the upward move.
There is a key support zone in green at the price of 2.25, representing a strong support point.
We have a trend of consolidation above the 100-period moving average.
Entry price: 2.33
First target: 2.40
Second target: 2.47
Third target: 2.553
Don't forget a simple money management rule:
Place your stop-loss order below the support zone in green.
Once the first target is reached, save some money and then change your stop-loss order to an entry order.
For any questions, please leave a comment.
Thank you.
APT is Bearish (4H)It has a bearish structure. We have an iCH (liquidity grab / mitigation) on the chart, the overall power is bearish, and price is trading below a resistance line. Recently, a base has also broken to the downside, and all signs indicate a bearish outlook.
We can enter a sell/short position once the stop-loss (invalidation level) is tapped, targeting the levels marked on the chart.
Do not enter the position without capital management and stop setting
Comment if you have any questions
thank you

APT;Is it possible to climb the stairs?Hello friends
Considering the rise we had and the subsequent price compression that occurred, there is now an important resistance in the way of the price, and buyers can take the price to the higher targets that have been identified by breaking this resistance.
In case of further correction, we have also identified two other support areas.
Don't forget risk and capital management.
*Trade safely with us*
#APT/USDT#APT
The price is moving within an ascending channel on the 1-hour timeframe and is adhering to it well. It is poised to break out strongly and retest the channel.
We have a downtrend line on the RSI indicator that is about to break and retest, which supports the upward move.
There is a key support zone in green at the price of 2.59, representing a strong support point.
We have a trend of consolidation above the 100-period moving average.
Entry price: 2.62
First target: 2.65
Second target: 2.71
Third target: 2.81
Don't forget a simple money management rule:
Place your stop-loss order below the support zone in green.
Once the first target is reached, save some money and then change your stop-loss order to an entry order.
For any questions, please leave a comment.
Thank you.

#APT/USDT bearish structural bias#APT
The price is moving in an ascending channel on the 1-hour frame, adhering well to it, and heading for a strong breakout and retest.
We have a bearish trend on the RSI indicator that is about to be broken and retested, which supports the upward breakout.
There is a major support area in green at 3.36, representing a strong support point.
We are heading for consolidation above the 100 moving average.
Entry price: 3.48
First target: 3.53
Second target: 3.63
Third target: 3.77
Don't forget a simple matter: capital management.
When you reach the first target, save some money and then change your stop-loss order to an entry order.
For inquiries, please leave a comment.
Thank you.

#APT/USDT bearish structural bias#APT
The price is moving in a descending channel on the 1-hour frame and is expected to break and continue upward.
We have a trend to stabilize above the 100 moving average once again.
We have a downtrend on the RSI indicator that supports the upward move with a breakout.
We have a major support area in green that pushed the price higher at 3.10.
Entry price: 3.12.
First target: 3.21.
Second target: 3.30.
Third target: 3.36.
To manage risk, don't forget stop loss and capital management.
When you reach the first target, save some profits and then change the stop order to an entry order.
For inquiries, please comment.
Thank you.

APT/USDTLast week’s Bitwise BINANCE:APTUSDT ETF news was overshadowed by the recent price action.
I’d turn bullish on this chart once it reclaims the range above $3.893.
If the December 2022 low around $3.066 comes into play, it could offer a good spot entry for medium-term accumulation at a discount.
The first plan for APT still looks much safer for now.

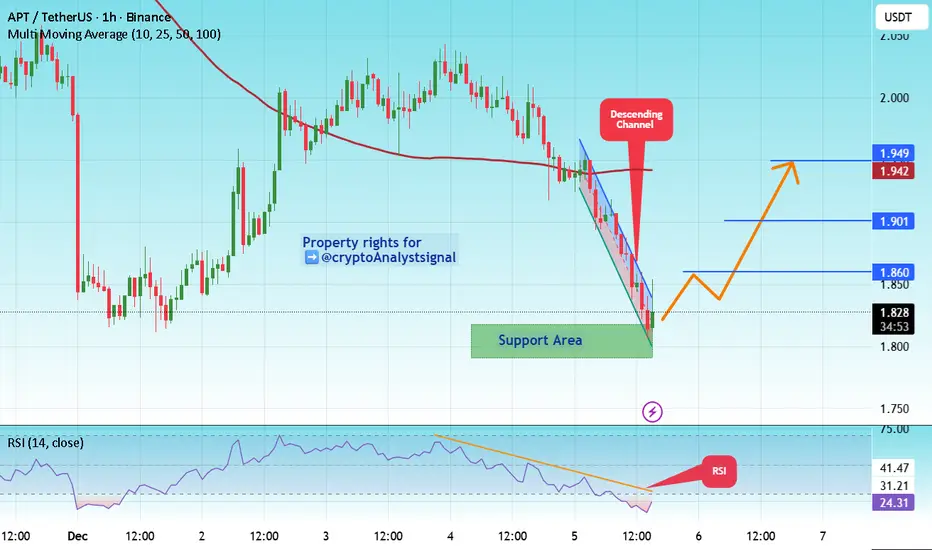
#APT/USDT bearish structural bias#APT
The price is moving within a descending channel on the 1-hour frame, adhering well to it, and is heading for a strong breakout and retest.
We have a bearish trend on the RSI indicator that is about to be broken and retested, which supports the upward move.
There is a major support area in green at 3.75, representing a strong support point.
We are heading for consolidation above the 100 moving average.
Entry price: 3.83
First target: 4.00
Second target: 4.22
Third target: 4.546
Don't forget a simple matter: capital management.
When you reach the first target, save some money and then change your stop-loss order to an entry order.
For inquiries, please leave a comment.
Thank you.

#APT/USDT Establish Support Zone !#APT
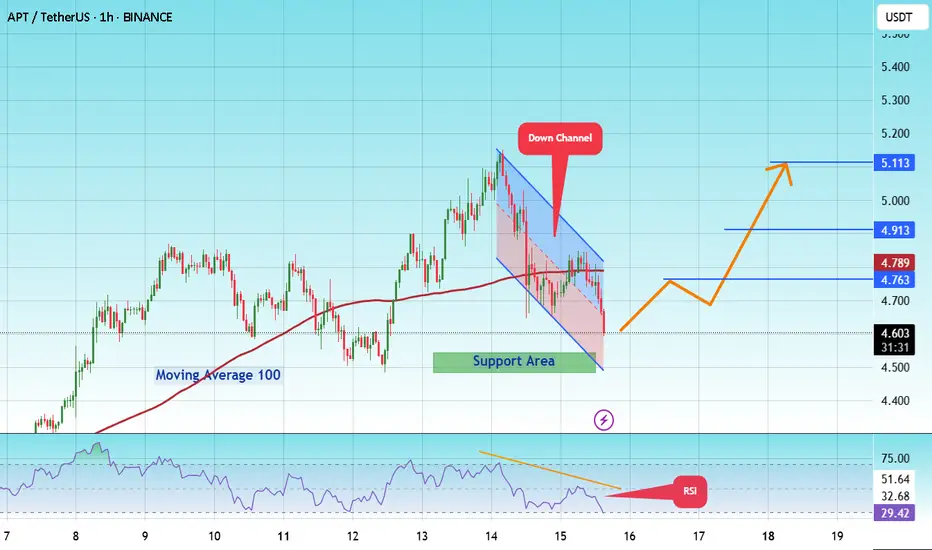
The price is moving within a descending channel on the 1-hour frame and is expected to break and continue upward.
We have a trend to stabilize above the 100 moving average once again.
We have a downtrend on the RSI indicator that supports the upward break.
We have a support area at the lower boundary of the channel at 4.54, acting as strong support from which the price can rebound.
We have a major support area in green that pushed the price higher at 4.49.
Entry price: 4.62.
First target: 4.76.
Second target: 4.91.
Third target: 5.11.
To manage risk, don't forget stop loss and capital management.
When you reach the first target, save some profits and then change your stop order to an entry order.
For inquiries, please comment.
Thank you.
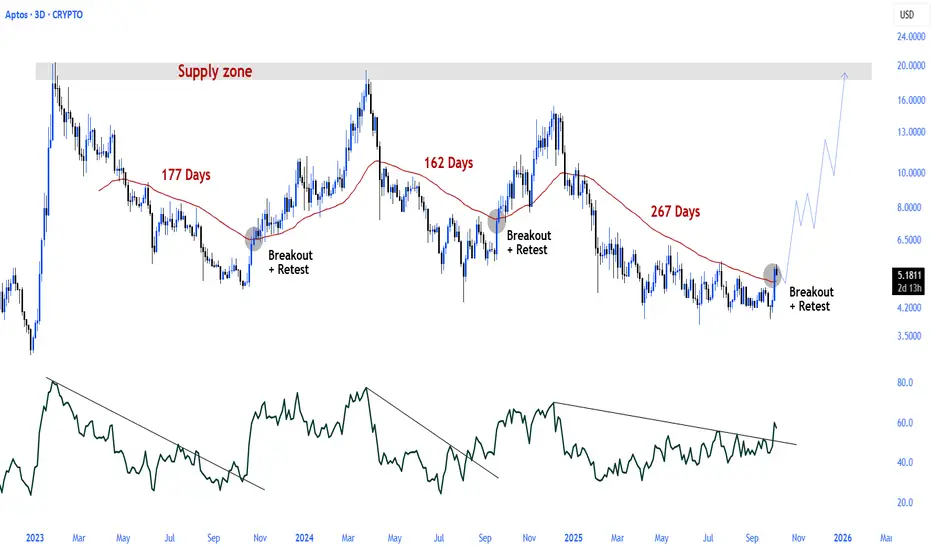
$APT \ Aptos Aptos, which previously initiated a strong rally following a breakout and retest of the 55 EMA, has now achieved a similar breakout 267 days later.
There is also a structural breakout in the RSI.
The outlook points to the start of a new run.
APT 1D Analysis - Key Triggers Ahead☃️ Welcome to the cryptos winter , I hope you’ve started your day well.
⏰ We’re analyzing APT on the 1-Day timeframe .
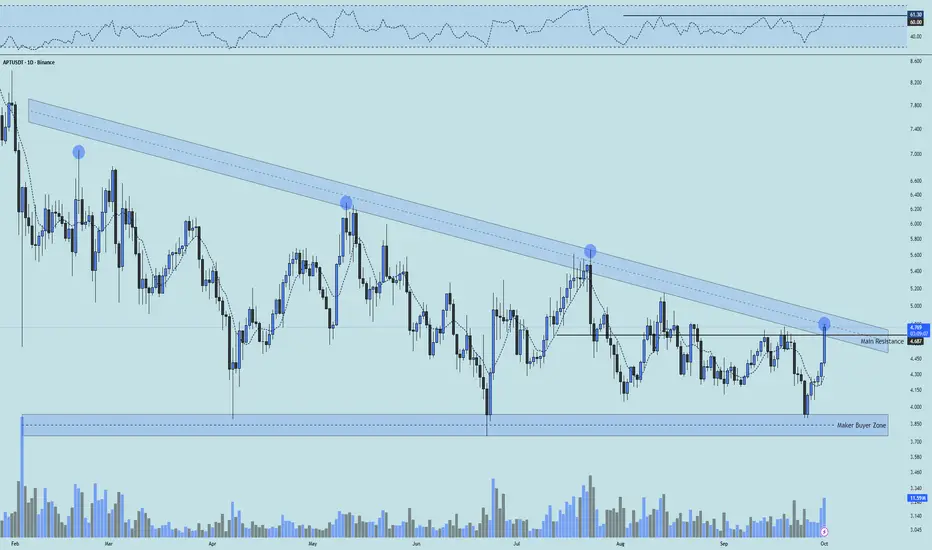
👀 On the daily timeframe for Aptos, we can see it's ranked 36 on CoinMarketCap, and its 24h trading volume is around 16% of its total market cap. This indicates heavy activity and high liquidity. APT is moving inside a triangular range, currently consolidating at the end of this triangle, with signs of a potential breakout. If it breaks and confirms above this structure, the coin could begin a price recovery after 240 days of ranging and selling pressure, pushing toward its higher resistances. The key resistance right now is at $4.7, and a confirmed breakout above this level can send it toward its next resistance zones.
🧮 Looking at the RSI oscillator, it was ranging inside a box between the 30–60 zone. On the 4th touch, the top of the box was broken and RSI crossed above 60. Our main RSI confirmation comes with a daily candle close above the $4.7 resistance, along with RSI stabilizing above 60, which would trigger increased volume, volatility, and even push RSI toward the overbought zone.
🕯 The size, volume, and number of recent green candles after the last touch of the maker-buyer zone have noticeably increased, with 6 bullish candles pushing the price toward the key resistance. Market participants in crypto are waiting to see the reaction here. From a time perspective, the coin spent 240 days in a descending range and completed a proper correction. Now that it's in the final squeeze phase, buying volume has increased well, and if the momentum continues, the coin could see a strong price rally.
💸 On the BINANCE:APTBTC pair, we can see it's at the end of the triangle and has almost pushed above its resistance with a whale candle, though volume is still relatively low. If the price stabilizes above the marked resistance on this pair and we also see rising volume on the USDT pair, a significant outperformance against Bitcoin is likely. This could attract whale attention and encourage rotation from BTC into APT.
🧠 For positioning on Aptos, entering with a reasonable risk makes sense, especially since after 240 days it's showing signs of forming a higher low and potentially a higher high. With a breakout above $4.7, the coin can continue toward its upper resistance levels.
↗️ Long Scenario: Breakout and confirmation above $4.7, with RSI stabilizing above the 60 zone as seen in the analysis, along with a confirmed breakout and support hold on the BTC pair. With increasing long volume and a completed pullback, entering on a secure higher low in multi-timeframe structure would be valid.
📉 Short Scenario (Risky): It's almost unlikely that the coin drops significantly from current levels, but if it does, losing the maker-buyer zone on both USDT and BTC pairs could trigger a deep correction with maximum selling pressure. Keep in mind, short positions in this phase of market compression breakouts are generally illogical since price reversals are very likely in these trends.
❤️ Disclaimer : This analysis is purely based on my personal opinion and I only trade if the stated triggers are activated .
#APT/USDT is currently strongly bullish
#APT
The price is moving within a descending channel on the 1-hour frame, adhering well to it, and is heading for a strong breakout and retest.
We have a bearish trend on the RSI indicator that is about to be broken and retested, which supports the upward breakout.
There is a major support area in green at 4.20, representing a strong support point.
We are heading for consolidation above the 100 moving average.
Entry price: 4.30
First target: 4.37
Second target: 4.43
Third target: 4.50
Don't forget a simple matter: capital management.
When you reach the first target, save some money and then change your stop-loss order to an entry order.
For inquiries, please leave a comment.
Thank you.

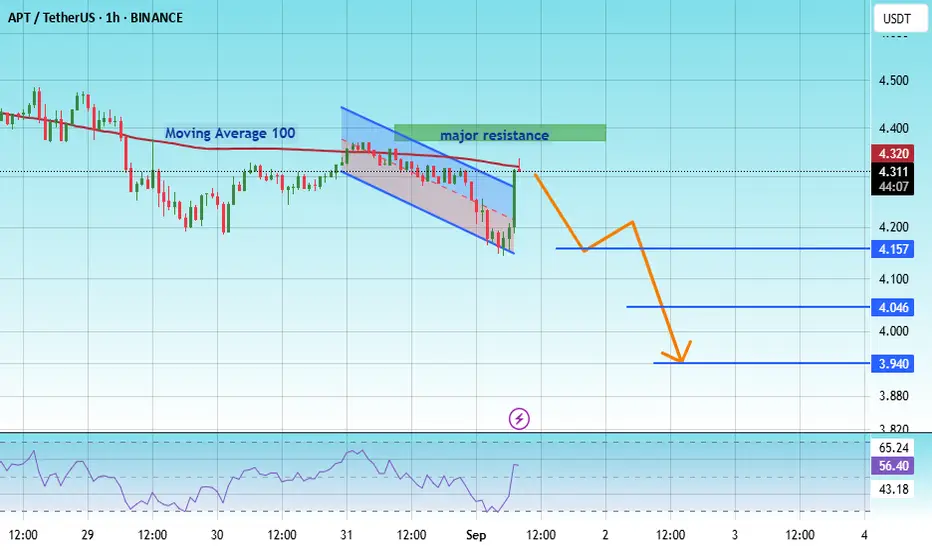
#APT/USDT - A lower timeframe view - Breakout Entry#APT
The price is moving within a descending channel on the 1-hour frame, adhering well to it, and is heading for a strong breakout and retest.
We have a bearish trend on the RSI indicator that is about to be broken and retested, which supports the decline.
There is a major resistance area (marked in green) at 4.32, which represents strong resistance.
For inquiries, please leave a comment.
We are in a consolidation trend below the 100 moving average.
Entry price: 4.324
First target: 4.15
Second target: 4.046
Third target: 3.94
Don't forget a simple matter: capital management.
When you reach the first target, save some money and then change your stop-loss order to an entry order.
For inquiries, please leave a comment.
Thank you.