APTUSDT — Retesting the Demand Zone Before Potential Rally back?1. Overview
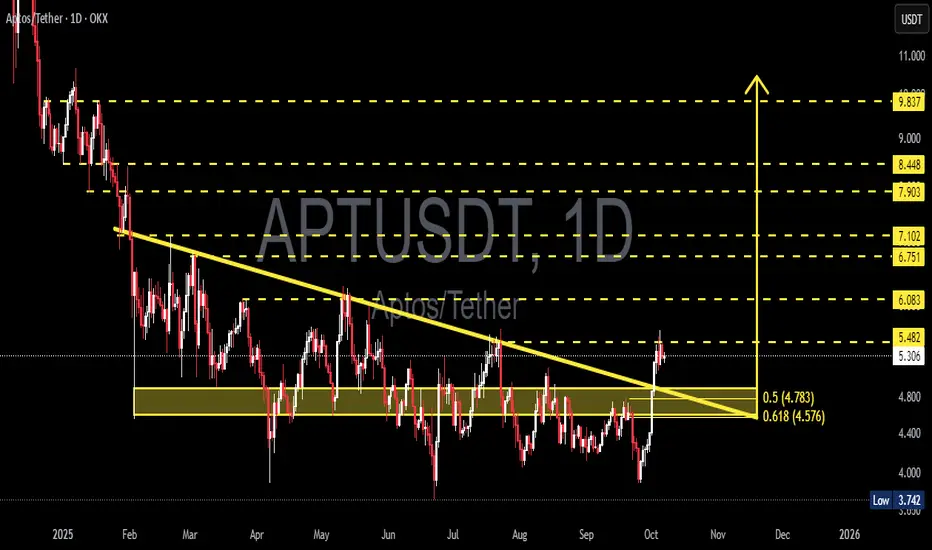
APT/USDT has been in a medium-term downtrend since early 2025, consistently forming lower highs and lower lows along the primary descending trendline (yellow).
Recently, however, the market has shown a clear shift in momentum: price successfully broke above the descending trendline and is now trading above a major confluence area between Fibonacci 0.5 and 0.618 (4.78–4.57).
This zone serves as the primary demand base, where historical accumulation by buyers has previously occurred. The breakout indicates a possible early stage of structural reversal, transitioning from a bearish environment toward a medium-term bullish phase.
---
2. Structure and Pattern
Over the past nine months, APT has formed a Descending Channel / Triangle pattern, where selling pressure gradually weakened as buyers began absorbing liquidity at lower levels.
The breakout above the trendline suggests a trendline breakout followed by a demand retest, a classic setup often signaling the start of a trend reversal.
If the 4.57–4.78 zone holds during the retest, the price structure could evolve into a compressed Inverse Head & Shoulders, further strengthening the bullish reversal narrative.
---
3. Key Technical Levels
The technical structure of APT can be summarized through several critical zones:
Main Demand Zone (4.783 – 4.576)
This is the key confluence area between the 0.5 and 0.618 Fibonacci retracements. Buyers have previously shown strong reactions here. Holding this level is crucial to validate the current breakout.
Immediate Resistance (5.482)
This marks the breakout line of the long-term descending trendline and the first significant psychological resistance. A daily close above this zone would confirm bullish continuation.
Major Support (3.742)
This is the main structural low formed during the previous capitulation phase. A breakdown below this level would invalidate the bullish structure and signal a potential continuation of the downtrend.
Upside Targets (Fibonacci Extensions)
Upon successful confirmation, price targets are projected at 6.083, 6.751, and 7.102, with extended targets at 7.903, 8.448, and 9.837.
The 4.57–4.78 region now acts as the core battlefield between buyers and sellers — defending this zone keeps the bullish structure intact.
---
4. Bullish Scenario
Confirmation Conditions:
Daily close above 5.48 with strong volume, or
Successful retest and bounce from 4.58–4.78.
If these conditions are met, the likelihood of sustained bullish continuation increases significantly.
Projected upside targets:
Target 1: 6.083
Target 2: 6.751
Target 3: 7.102
Momentum extension could push toward 7.90–9.84 if volume and sentiment align.
Additional confirmations:
RSI rising above 50 → showing positive momentum.
MACD golden cross in the positive zone → trend strength confirmation.
Increasing breakout volume → evidence of institutional accumulation.
Bullish invalidation: daily close below 4.576.
---
5. Bearish Scenario
If price fails to sustain above 5.48 and instead breaks down through the 4.58–4.78 zone, the breakout will be classified as a false breakout.
In this case, potential downside includes:
Short-term pullback toward 4.00,
And a deeper retest near 3.742, the major structural support.
A daily close below 3.742 would confirm trend continuation to the downside and nullify the reversal structure.
---
6. Market Sentiment and Dynamics
APT is currently in a transition phase between capitulation and re-accumulation.
The breakout above the trendline, combined with increasing buying volume, suggests a change in market character — shifting from selling pressure to growing demand.
If the broader crypto environment remains stable and risk appetite returns to altcoins, APT could become one of the stronger Layer-1 recovery candidates in the coming cycle.
However, two main risks remain:
1. False breakout caused by weak volume.
2. Low liquidity at higher levels that may lead to sharp retracements before continuation.
---
7. Trading Approach (Not Financial Advice)
A. Conservative Swing Approach
Entry: confirmed bounce at 4.78–4.60
Stop Loss: below 4.40
Take Profit: 6.08 / 6.75 / 7.10
Risk:Reward: approximately 1:3
B. Momentum Approach
Entry: breakout confirmation above 5.48 with strong volume
Stop Loss: below 4.78
Target: 6.75–7.10
---
8. Conclusion
APT/USDT stands at a technically decisive point.
The breakout above the long-term descending trendline signals a potential major shift in market direction.
However, full confirmation depends on the ability of the 4.58–4.78 zone to hold during the retest.
If the zone holds, the next move toward 6.75–7.10 could unfold over the coming weeks.
If it fails, sellers may regain control, pulling the price back to 3.74 and continuing the broader downtrend.
The coming sessions will determine whether this marks the beginning of a true bullish reversal or merely a temporary false breakout.
---
9. Relevant Hashtags
#APT #APTUSDT #Aptos #CryptoAnalysis #TechnicalAnalysis #Breakout #SupplyDemand #Fibonacci #SupportResistance #SwingTrading #PriceAction #TrendReversal #Altcoins #CryptoMarket
APTUSDC
APT/USDT — Key Support Retest, Watch for Breakout or Breakdown?🔎 Overview
APT/USDT is currently trading around $4.09, sitting right above the historical support zone between $1.00 – $3.50 that has repeatedly acted as a demand area since its early listings. This is the make-or-break level: either Aptos builds a strong accumulation base for a bullish reversal, or it loses ground and risks a deeper slide toward $1.00 lows.
---
🟨 Structure & Key Pattern
Critical Support (1.00 – 3.50): Long-term demand zone tested multiple times. If it holds → strong accumulation potential.
Consistent Lower Highs: Each bounce is weaker than the last → sellers still dominate. This creates a Descending Triangle-like structure, often bearish if support breaks.
Multi-Year Range: Price is locked in a wide sideways formation; such ranges usually precede a major breakout move.
Important Resistance Levels:
$5.14 → first resistance, often rejected.
$5.86 → key breakout validation level.
$7.63, $10.18 → mid-term bullish targets.
$14.51 – $18.27 → long-term bullish reversal targets.
---
🟢 Bullish Scenario
Confirmation: Weekly close above $5.86 with strong volume.
Narrative: Breakout from early supply zone → bulls regain control.
Upside Targets:
$5.14 → partial take profit.
$5.86 → breakout confirmation.
$7.63 → mid-term target.
$10.18 → major target, opening path toward $14.51 – $18.27.
Risk Management: Stop loss below $3.50 to protect against breakdown.
---
🔴 Bearish Scenario
Confirmation: Weekly close below $3.50.
Narrative: Breakdown from historical support → potential capitulation with panic selling.
Downside Targets:
$2.70 → minor support.
$1.00 → ultimate target and historical low.
Risk: Possible long squeeze if many traders hold without cutting losses.
---
📐 Risk/Reward Example (Swing Trade)
Entry: $4.09
Stop: $3.30
Risk = 0.79
Reward to $5.14 = +1.05 (RR 1.3 : 1)
Reward to $5.86 = +1.77 (RR 2.2 : 1)
Reward to $7.63 = +3.54 (RR 4.5 : 1)
→ Attractive R:R ratio if support holds.
---
📌 Conclusion
APT is at a critical decision zone.
As long as it holds above $1.00 – $3.50, there’s still a chance for accumulation and bullish reversal.
But a confirmed breakdown below $3.50 opens the door to $1.00 lows.
For long-term investors, this is a high-risk, high-reward zone. For traders, confirmation of breakout/breakdown is crucial before committing to big positions.
---
#APTUSDT #Aptos #CryptoAnalysis #WeeklyChart #SupportResistance #TechnicalAnalysis #PriceAction #Altcoin #SwingTrading #CryptoTrading

APT at Historic Support – Massive Reversal Incoming?APTUSDT technical analysis update
APT has been trading inside a descending channel for over 900 days, and it's now once again testing the channel support. As shown in the chart, the price has bounced multiple times from this level, making it a historically strong support zone.
Currently, the target is the upper boundary of the channel (resistance). If APT manages to break out of this long-term descending channel, it could trigger a strong bullish move, possibly a moonshot.

$APT: PULLBACK 🌊Everyone was in rush to invest in APTOS blockchain but big exchanges like Binance conquired big % of APT supply and it kinda controls price movement, dump $APT until retail traders get vanished then send it higher. This is exactly what happened in first days of $APT trading.
Now, after this breakout and print of a new HH, price is retracing to previous support and has already rejected it multiple times before going up nearly +30%.
Setting buy-limits at this support box. For SL, 5-10% below support should be fine as our TP is targeting a minimum of 50% gain.
Make sure you follow me to get alerts on this trade!

APTUSDTTo much confluence between 11.77- 11.20 probably there would be very big buy and from there we will atleast got bounce of 5-10%
Solid resistance: 12.6
Main resistance : 13.4
Last Resistance: 14.9
We are going step by step.
To be honest for me this is swing trade to mid term.
I will hold it till it don't hit my tp around 25-27$
