#APT/USDT
#APT
The price is moving in a descending channel on the 1-hour timeframe. It has reached the lower boundary and is heading towards a breakout, with a retest of the upper boundary expected.
We are seeing a bearish trend in the Relative Strength Index (RSI), which has reached near the lower boundary, and an upward bounce is expected.
There is a key support zone in green at 0.250, and the price has bounced from this level several times. Another bounce is expected.
We are seeing a trend towards stabilizing above the 100-period moving average, which we are approaching, supporting the upward trend.
Entry Price: 0.264
First Target: 0.270
Second Target: 0.280
Third Target: 0.291
Remember a simple principle: Money Management.
Place your stop-loss order below the green support zone.
For any questions, please leave a comment.
Thank you.
APTUSDT

##APT/USDT 1H – Stablecoin-heavy, swing long from local base#APT
The price is moving in a descending channel on the 1-hour timeframe. It has reached the lower boundary and is heading towards a breakout, with a retest of the upper boundary expected.
We are seeing a bearish trend in the Relative Strength Index (RSI), which has reached near the lower boundary, and an upward bounce is expected.
There is a key support zone in green at 1.62, and the price has bounced from this level several times. Another bounce is expected.
We are seeing a trend towards stabilizing above the 100-period moving average, which we are approaching, supporting the upward trend.
Entry Price: 1.71
First Target: 1.75
Second Target: 1.80
Third Target: 1.87
Remember a simple principle: Money Management.
Place your stop-loss order below the green support zone.
For any questions, please leave a comment.
Thank you.

Will APT see 50% growth?Aptos plummeted 61% with no rebounds! There is a high probability of seeing a similar movement until the first short FVG on the daily chart.
I think we will see a similar movement by the end of January or early February.
There are bullish divergences and oversold conditions in the RSI. Technically, there should be a rebound after a 61% drop without rebounds.
BINANCE:APTUSDT.P

#APT/USDT #APT The price is moving in a descending channel on #APT
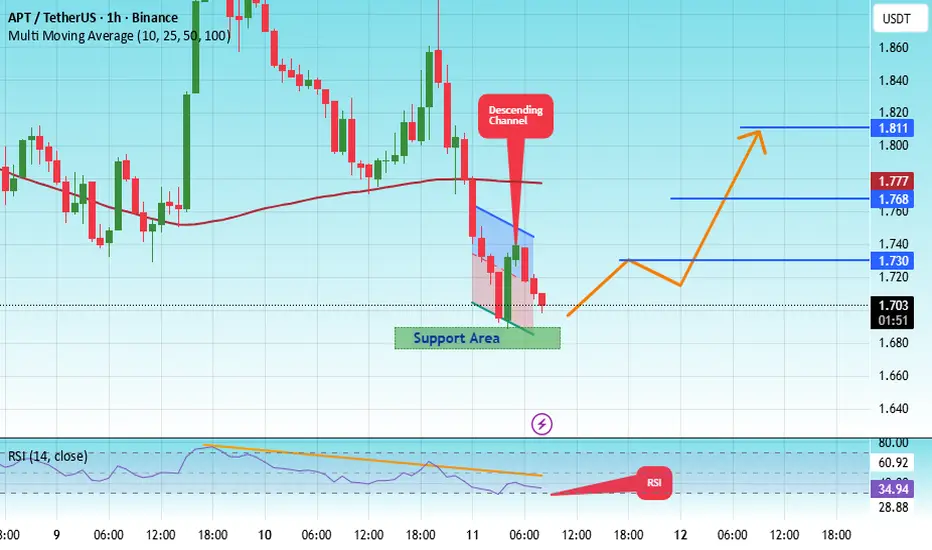
The price is moving in a descending channel on the 1-hour timeframe. It has reached the lower boundary and is heading towards breaking above it, with a retest of the upper boundary expected.
We have a downtrend on the RSI indicator, which has reached near the lower boundary, and an upward rebound is expected.
There is a key support zone in green at 1.68. The price has bounced from this zone multiple times and is expected to bounce again.
We have a trend towards consolidation above the 100-period moving average, as we are moving close to it, which supports the upward movement.
Entry price: 1.70
First target: 1.73
Second target: 1.76
Third target: 1.81
Don't forget a simple principle: money management.
Place your stop-loss below the support zone in green.
For any questions, please leave a comment.
Thank you.
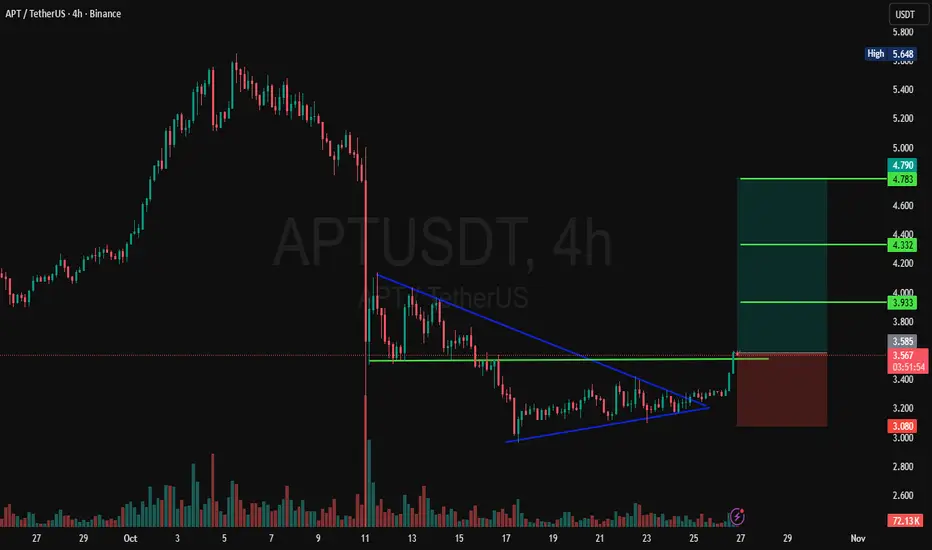
APT Buy/Long (4H)A solid structure shift has occurred on the chart, and a liquidity pool is visible above. If price reaches our entry zones before touching the supply area, we will enter the position.
We have two entry points, and we will enter using a DCA approach.
The targets are marked on the chart.
A daily candle close below the invalidation level will invalidate this analysis.
For risk management, please don't forget stop loss and capital management
When we reach the first target, save some profit and then change the stop to entry
Comment if you have any questions
Thank You

APT is testing the red resistance zone🚨📊 APT Update
APT is testing the red resistance zone 🔴 right now,
and this level is critical.
A breakout above could signal
bullish continuation.
If sellers step in here,
price may face rejection.
Watching the reaction closely. 👀

APT - BEARISH OUTLOOKAMEX:APT - Bearish Setup 📉
Same story: no buy pressure, strong downtrend & no historical support.🔴
Price looks ready to break to the downside once again.
Potential key support:
$ 1.510 and $1.380 level (0.706 fib).
Chart looks terrible under the key resistances mentioned. 🍿📉

#APT/USDT 1H – Stablecoin-heavy, swing long from local base#APT
The price is moving in a descending channel on the 1-hour timeframe. It has reached the lower boundary and is heading towards a breakout, with a retest of the upper boundary expected.
We are seeing a bearish bias in the Relative Strength Index (RSI), which has reached near the lower boundary, and an upward bounce is expected.
There is a key support zone in green at 1.80. The price has bounced from this level several times and is expected to bounce again.
We are seeing a trend towards stabilizing above the 100-period moving average, which we are approaching, supporting the upward trend.
Entry Price: 1.82
First Target: 1.86
Second Target: 1.90
Third Target: 1.95
Remember a simple principle: Money Management.
Place your stop-loss order below the green support zone.
For any questions, please leave a comment.
Thank you.
APT is forming a Double Bottom pattern🚨📊 APT Update
APT is forming a Double Bottom pattern,
a bullish reversal setup 🔄📈.
If price breaks out above the red resistance zone,
the first target will be the green line level 🟩🎯.

APT has broken below the blue support level🚨📊 APT Update
APT has broken below the blue support level 🔵⬇️,
showing clear weakness as sellers take control.
This breakdown increases the chance of further downside
unless buyers quickly reclaim this zone.

#APT/USDT 1H – Stablecoin-heavy, swing long from local base#APT
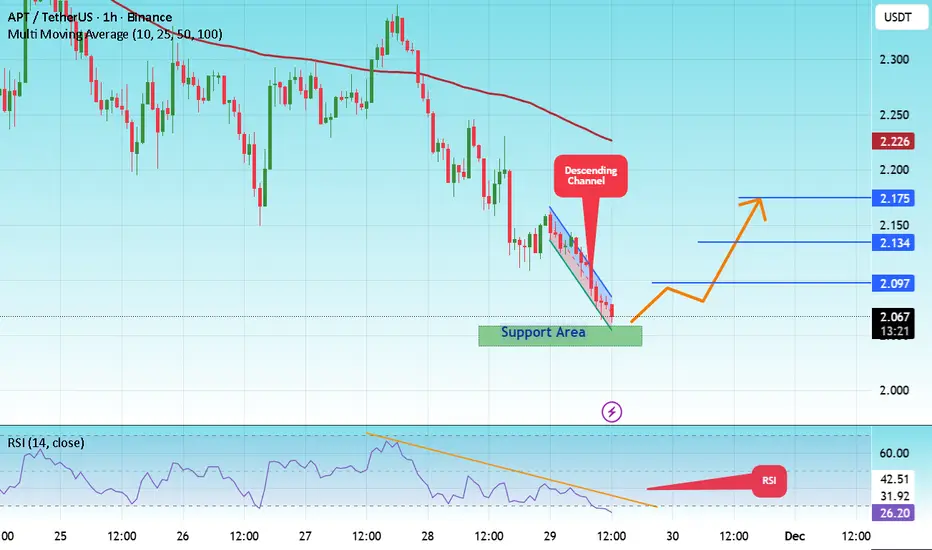
The price is moving in a descending channel on the 1-hour timeframe. It has reached the lower boundary and is heading towards a breakout, with a retest of the upper boundary expected.
We are seeing a bearish bias in the Relative Strength Index (RSI), which has reached near the lower boundary, and an upward bounce is expected.
There is a key support zone in green at 2.05. The price has bounced from this level several times and is expected to bounce again.
We are seeing a trend towards stabilizing above the 100-period moving average, which we are approaching, supporting the upward trend.
Entry Price: 2.06
First Target: 2.097
Second Target: 2.134
Third Target: 2.175
Remember a simple principle: Money Management.
Place your stop-loss order below the green support zone.
For any questions, please leave a comment.
Thank you.
#APT/USDT 1H – Stablecoin-heavy, swing long from local base#APT
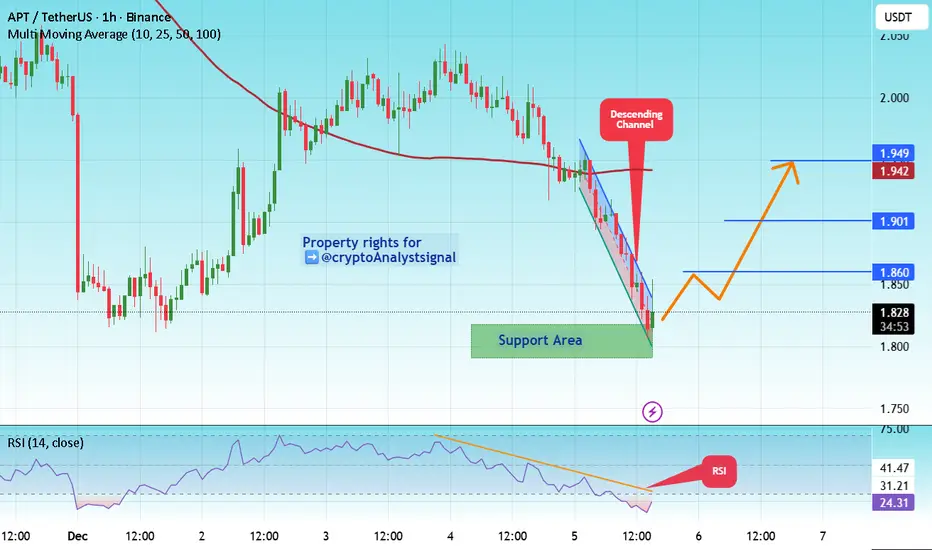
The price is moving in a descending channel on the 1-hour timeframe. It has reached the lower boundary and is heading towards breaking above it, with a retest of the upper boundary expected.
We have a downtrend on the RSI indicator, which has reached near the lower boundary, and an upward rebound is expected.
There is a key support zone in green at 1.81. The price has bounced from this zone multiple times and is expected to bounce again.
We have a trend towards consolidation above the 100-period moving average, as we are moving close to it, which supports the upward movement.
Entry price: 1.84
First target: 1.87
Second target: 1.90
Third target: 1.95
Don't forget a simple principle: money management.
Place your stop-loss below the support zone in green.
For any questions, please leave a comment.
Thank you.

#APT/USDT 1H – Stablecoin-heavy, swing long from local base#APT
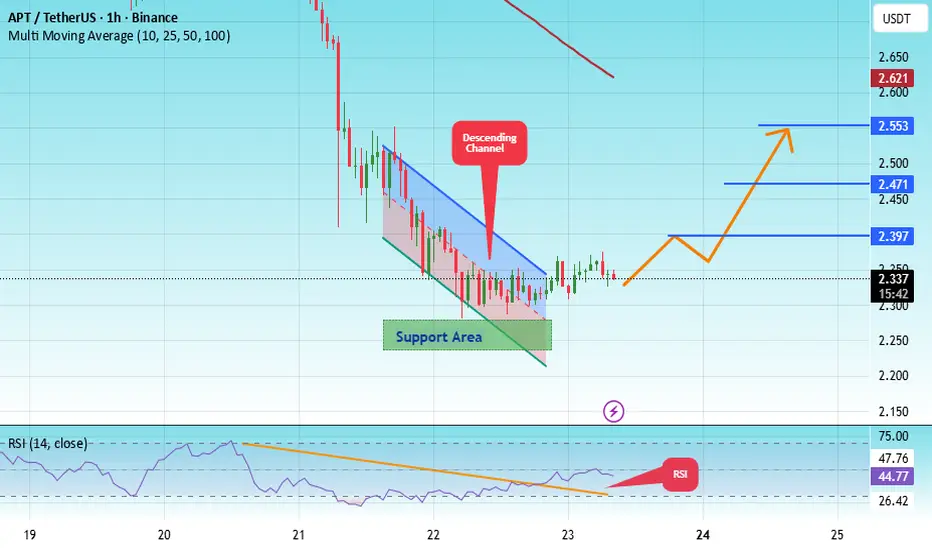
The price is moving within an ascending channel on the 1-hour timeframe and is adhering to it well. It is poised to break out strongly and retest the channel.
We have a downtrend line on the RSI indicator that is about to break and retest, which supports the upward move.
There is a key support zone in green at the price of 2.25, representing a strong support point.
We have a trend of consolidation above the 100-period moving average.
Entry price: 2.33
First target: 2.40
Second target: 2.47
Third target: 2.553
Don't forget a simple money management rule:
Place your stop-loss order below the support zone in green.
Once the first target is reached, save some money and then change your stop-loss order to an entry order.
For any questions, please leave a comment.
Thank you.
APT is Bearish (4H)It has a bearish structure. We have an iCH (liquidity grab / mitigation) on the chart, the overall power is bearish, and price is trading below a resistance line. Recently, a base has also broken to the downside, and all signs indicate a bearish outlook.
We can enter a sell/short position once the stop-loss (invalidation level) is tapped, targeting the levels marked on the chart.
Do not enter the position without capital management and stop setting
Comment if you have any questions
thank you

APT;Is it possible to climb the stairs?Hello friends
Considering the rise we had and the subsequent price compression that occurred, there is now an important resistance in the way of the price, and buyers can take the price to the higher targets that have been identified by breaking this resistance.
In case of further correction, we have also identified two other support areas.
Don't forget risk and capital management.
*Trade safely with us*
#APT/USDT#APT
The price is moving within an ascending channel on the 1-hour timeframe and is adhering to it well. It is poised to break out strongly and retest the channel.
We have a downtrend line on the RSI indicator that is about to break and retest, which supports the upward move.
There is a key support zone in green at the price of 2.59, representing a strong support point.
We have a trend of consolidation above the 100-period moving average.
Entry price: 2.62
First target: 2.65
Second target: 2.71
Third target: 2.81
Don't forget a simple money management rule:
Place your stop-loss order below the support zone in green.
Once the first target is reached, save some money and then change your stop-loss order to an entry order.
For any questions, please leave a comment.
Thank you.

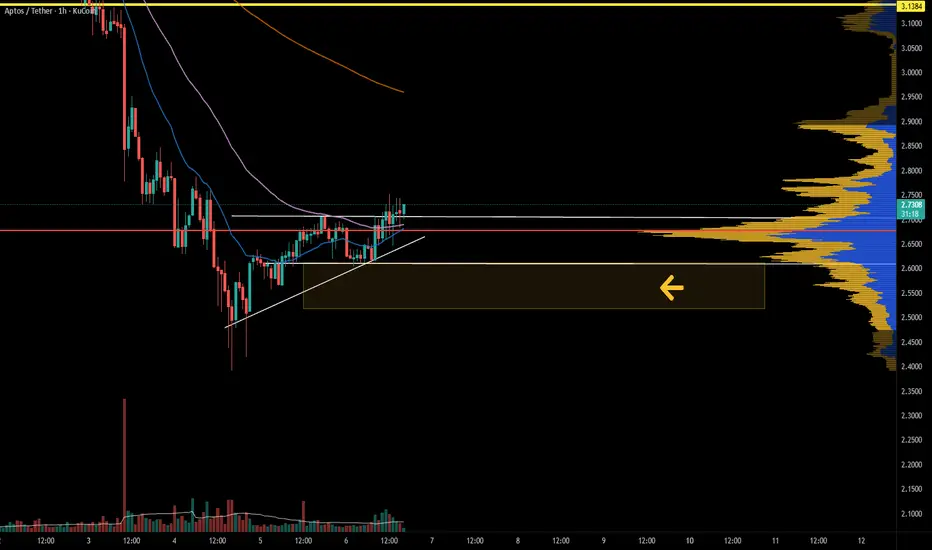
APTOS engaging in a battle of a lifetimeAPT has entered a dip-discovery phase, venturing into price territory with no prior historical action. These levels often present asymmetric opportunities — high potential reward, but elevated risk. The objective here is to locate an entry where downside exposure is limited while maximizing upside potential. Executing precision entries on lower timeframes and scaling them into swing positions as price confirms direction offers the optimal approach.
At current conditions, fresh short positions are unfavorable. Momentum is deeply oversold, market structure remains underdeveloped, yet price is trading at a notable discount. A further move into the highlighted yellow zone could provide an attractive risk-to-reward setup and potentially form a rounded accumulation base — a structure often preceding trend reversals.
#APT/USDT bearish structural bias#APT
The price is moving in an ascending channel on the 1-hour frame, adhering well to it, and heading for a strong breakout and retest.
We have a bearish trend on the RSI indicator that is about to be broken and retested, which supports the upward breakout.
There is a major support area in green at 3.36, representing a strong support point.
We are heading for consolidation above the 100 moving average.
Entry price: 3.48
First target: 3.53
Second target: 3.63
Third target: 3.77
Don't forget a simple matter: capital management.
When you reach the first target, save some money and then change your stop-loss order to an entry order.
For inquiries, please leave a comment.
Thank you.

APT 4H Trade IdeaAptos looks bullish here on 4H time frame.
It has broke sideways & important level. Looks like a good accumulation done.
Entry & Exit points are on the chart.
NFA DYOR
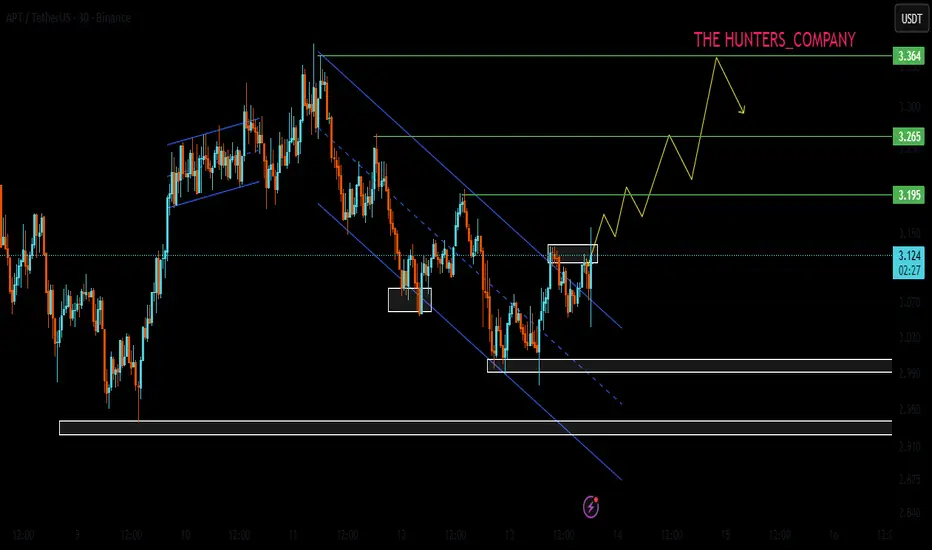
#APT/USDT bearish structural bias#APT
The price is moving in a descending channel on the 1-hour frame and is expected to break and continue upward.
We have a trend to stabilize above the 100 moving average once again.
We have a downtrend on the RSI indicator that supports the upward move with a breakout.
We have a major support area in green that pushed the price higher at 3.10.
Entry price: 3.12.
First target: 3.21.
Second target: 3.30.
Third target: 3.36.
To manage risk, don't forget stop loss and capital management.
When you reach the first target, save some profits and then change the stop order to an entry order.
For inquiries, please comment.
Thank you.

Aptos at critical levels. APT needs to hold this level. Below this horizontal support, the price gets into dip discovery. This is the last line in the sand. Retail is not buzzing about it, and its institutional vibes are not attracting mindshare. Momentum is not in favor of the bulls, but RR is at its best.

APT/USDTLast week’s Bitwise BINANCE:APTUSDT ETF news was overshadowed by the recent price action.
I’d turn bullish on this chart once it reclaims the range above $3.893.
If the December 2022 low around $3.066 comes into play, it could offer a good spot entry for medium-term accumulation at a discount.
The first plan for APT still looks much safer for now.

#APT/USDT bearish structural bias#APT
The price is moving within a descending channel on the 1-hour frame, adhering well to it, and is heading for a strong breakout and retest.
We have a bearish trend on the RSI indicator that is about to be broken and retested, which supports the upward move.
There is a major support area in green at 3.75, representing a strong support point.
We are heading for consolidation above the 100 moving average.
Entry price: 3.83
First target: 4.00
Second target: 4.22
Third target: 4.546
Don't forget a simple matter: capital management.
When you reach the first target, save some money and then change your stop-loss order to an entry order.
For inquiries, please leave a comment.
Thank you.
