APTUSDT — Retesting the Demand Zone Before Potential Rally back?1. Overview
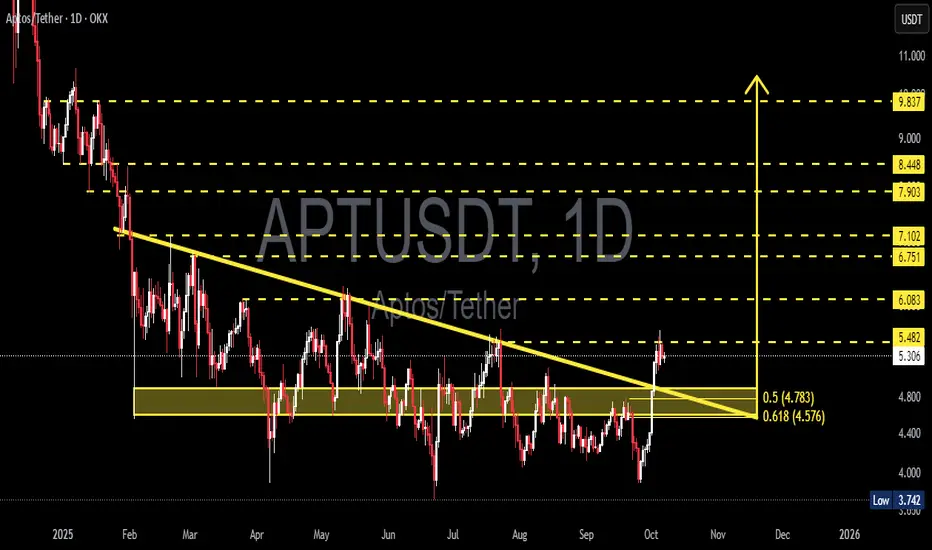
APT/USDT has been in a medium-term downtrend since early 2025, consistently forming lower highs and lower lows along the primary descending trendline (yellow).
Recently, however, the market has shown a clear shift in momentum: price successfully broke above the descending trendline and is now trading above a major confluence area between Fibonacci 0.5 and 0.618 (4.78–4.57).
This zone serves as the primary demand base, where historical accumulation by buyers has previously occurred. The breakout indicates a possible early stage of structural reversal, transitioning from a bearish environment toward a medium-term bullish phase.
---
2. Structure and Pattern
Over the past nine months, APT has formed a Descending Channel / Triangle pattern, where selling pressure gradually weakened as buyers began absorbing liquidity at lower levels.
The breakout above the trendline suggests a trendline breakout followed by a demand retest, a classic setup often signaling the start of a trend reversal.
If the 4.57–4.78 zone holds during the retest, the price structure could evolve into a compressed Inverse Head & Shoulders, further strengthening the bullish reversal narrative.
---
3. Key Technical Levels
The technical structure of APT can be summarized through several critical zones:
Main Demand Zone (4.783 – 4.576)
This is the key confluence area between the 0.5 and 0.618 Fibonacci retracements. Buyers have previously shown strong reactions here. Holding this level is crucial to validate the current breakout.
Immediate Resistance (5.482)
This marks the breakout line of the long-term descending trendline and the first significant psychological resistance. A daily close above this zone would confirm bullish continuation.
Major Support (3.742)
This is the main structural low formed during the previous capitulation phase. A breakdown below this level would invalidate the bullish structure and signal a potential continuation of the downtrend.
Upside Targets (Fibonacci Extensions)
Upon successful confirmation, price targets are projected at 6.083, 6.751, and 7.102, with extended targets at 7.903, 8.448, and 9.837.
The 4.57–4.78 region now acts as the core battlefield between buyers and sellers — defending this zone keeps the bullish structure intact.
---
4. Bullish Scenario
Confirmation Conditions:
Daily close above 5.48 with strong volume, or
Successful retest and bounce from 4.58–4.78.
If these conditions are met, the likelihood of sustained bullish continuation increases significantly.
Projected upside targets:
Target 1: 6.083
Target 2: 6.751
Target 3: 7.102
Momentum extension could push toward 7.90–9.84 if volume and sentiment align.
Additional confirmations:
RSI rising above 50 → showing positive momentum.
MACD golden cross in the positive zone → trend strength confirmation.
Increasing breakout volume → evidence of institutional accumulation.
Bullish invalidation: daily close below 4.576.
---
5. Bearish Scenario
If price fails to sustain above 5.48 and instead breaks down through the 4.58–4.78 zone, the breakout will be classified as a false breakout.
In this case, potential downside includes:
Short-term pullback toward 4.00,
And a deeper retest near 3.742, the major structural support.
A daily close below 3.742 would confirm trend continuation to the downside and nullify the reversal structure.
---
6. Market Sentiment and Dynamics
APT is currently in a transition phase between capitulation and re-accumulation.
The breakout above the trendline, combined with increasing buying volume, suggests a change in market character — shifting from selling pressure to growing demand.
If the broader crypto environment remains stable and risk appetite returns to altcoins, APT could become one of the stronger Layer-1 recovery candidates in the coming cycle.
However, two main risks remain:
1. False breakout caused by weak volume.
2. Low liquidity at higher levels that may lead to sharp retracements before continuation.
---
7. Trading Approach (Not Financial Advice)
A. Conservative Swing Approach
Entry: confirmed bounce at 4.78–4.60
Stop Loss: below 4.40
Take Profit: 6.08 / 6.75 / 7.10
Risk:Reward: approximately 1:3
B. Momentum Approach
Entry: breakout confirmation above 5.48 with strong volume
Stop Loss: below 4.78
Target: 6.75–7.10
---
8. Conclusion
APT/USDT stands at a technically decisive point.
The breakout above the long-term descending trendline signals a potential major shift in market direction.
However, full confirmation depends on the ability of the 4.58–4.78 zone to hold during the retest.
If the zone holds, the next move toward 6.75–7.10 could unfold over the coming weeks.
If it fails, sellers may regain control, pulling the price back to 3.74 and continuing the broader downtrend.
The coming sessions will determine whether this marks the beginning of a true bullish reversal or merely a temporary false breakout.
---
9. Relevant Hashtags
#APT #APTUSDT #Aptos #CryptoAnalysis #TechnicalAnalysis #Breakout #SupplyDemand #Fibonacci #SupportResistance #SwingTrading #PriceAction #TrendReversal #Altcoins #CryptoMarket
Aptusdtidea
APT/USDT — Key Support Retest, Watch for Breakout or Breakdown?🔎 Overview
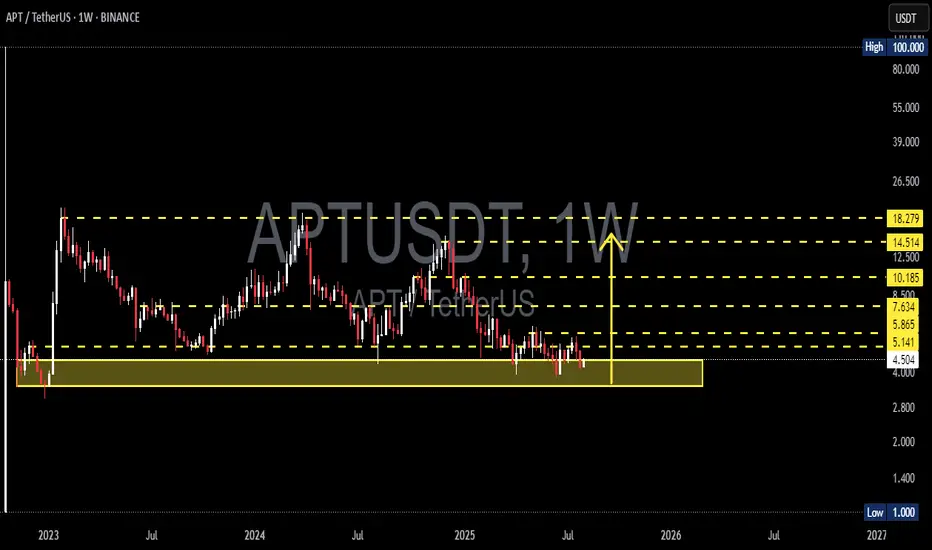
APT/USDT is currently trading around $4.09, sitting right above the historical support zone between $1.00 – $3.50 that has repeatedly acted as a demand area since its early listings. This is the make-or-break level: either Aptos builds a strong accumulation base for a bullish reversal, or it loses ground and risks a deeper slide toward $1.00 lows.
---
🟨 Structure & Key Pattern
Critical Support (1.00 – 3.50): Long-term demand zone tested multiple times. If it holds → strong accumulation potential.
Consistent Lower Highs: Each bounce is weaker than the last → sellers still dominate. This creates a Descending Triangle-like structure, often bearish if support breaks.
Multi-Year Range: Price is locked in a wide sideways formation; such ranges usually precede a major breakout move.
Important Resistance Levels:
$5.14 → first resistance, often rejected.
$5.86 → key breakout validation level.
$7.63, $10.18 → mid-term bullish targets.
$14.51 – $18.27 → long-term bullish reversal targets.
---
🟢 Bullish Scenario
Confirmation: Weekly close above $5.86 with strong volume.
Narrative: Breakout from early supply zone → bulls regain control.
Upside Targets:
$5.14 → partial take profit.
$5.86 → breakout confirmation.
$7.63 → mid-term target.
$10.18 → major target, opening path toward $14.51 – $18.27.
Risk Management: Stop loss below $3.50 to protect against breakdown.
---
🔴 Bearish Scenario
Confirmation: Weekly close below $3.50.
Narrative: Breakdown from historical support → potential capitulation with panic selling.
Downside Targets:
$2.70 → minor support.
$1.00 → ultimate target and historical low.
Risk: Possible long squeeze if many traders hold without cutting losses.
---
📐 Risk/Reward Example (Swing Trade)
Entry: $4.09
Stop: $3.30
Risk = 0.79
Reward to $5.14 = +1.05 (RR 1.3 : 1)
Reward to $5.86 = +1.77 (RR 2.2 : 1)
Reward to $7.63 = +3.54 (RR 4.5 : 1)
→ Attractive R:R ratio if support holds.
---
📌 Conclusion
APT is at a critical decision zone.
As long as it holds above $1.00 – $3.50, there’s still a chance for accumulation and bullish reversal.
But a confirmed breakdown below $3.50 opens the door to $1.00 lows.
For long-term investors, this is a high-risk, high-reward zone. For traders, confirmation of breakout/breakdown is crucial before committing to big positions.
---
#APTUSDT #Aptos #CryptoAnalysis #WeeklyChart #SupportResistance #TechnicalAnalysis #PriceAction #Altcoin #SwingTrading #CryptoTrading

APT/USDT – Price Tests Critical Historical Demand Zone!📌 Quick Summary:
APT is now at a crucial technical crossroad. After a prolonged downtrend from its previous highs, price action is once again testing the strong demand zone that historically acted as a key accumulation area. Is this the start of a new rally, or a breakdown toward uncharted lows?
---
🧱 Major Support / Demand Zone (High-Value Buy Area)
📍 $3.00 – $4.50 zone has acted as a major defensive wall since early 2023. This range represents a high-interest area for smart money accumulation, as shown by multiple strong rejections in the past.
> 🔎 Note: If this zone fails to hold, the long-term structure will flip fully bearish.
---
🧭 Key Resistance Levels (Bullish Targets):
These levels will act as challenges in any bullish recovery:
🔹 $4.49 – Minor resistance, first breakout confirmation.
🔹 $5.14 & $5.86 – Intermediate resistance; breaking above signals mid-trend strength.
🔹 $7.63 & $8.50 – Critical zones where past distribution occurred.
🔹 $10.18 – $12.50 – Gateway to the upper structure.
🔹 $14.51 – $18.27 – Long-term targets, last known macro resistance levels.
---
📈 Bullish Scenario: Rebound from Strong Foundation
Bullish momentum may build up if:
Weekly candlestick closes show bullish reversal patterns (hammer, engulfing, strong wicks),
Increasing buy-side volume on H4, D1, and W1 timeframes,
Clean breakout and retest of the $5.14 – $5.86 zone.
This could initiate a new bullish leg with mid-term targets around $8.00 – $10.00, and potentially higher if market conditions improve (e.g., BTC and ETH uptrending).
> 🎯 Bullish Validation: Weekly close above $7.63.
---
📉 Bearish Scenario: Full Breakdown Risk
If the $3.00 – $4.50 demand zone fails:
Price could drop toward the psychological level of $2.80 and potentially revisit the historical low of $1.00.
The major downtrend structure will be confirmed: lower highs and lower lows.
This may signal a full capitulation phase before the next cycle begins.
> ⚠️ Bearish Risk Trigger: Weekly close below $3.00 with strong volume.
---
🧠 Market Structure & Pattern Watch:
Sideways Accumulation: Multi-week tight range consolidation suggests accumulation by smart money.
Potential Double Bottom: A strong bounce from the $3.00 – $3.50 range could form a bullish reversal base.
Volume Compression: Decreasing volume suggests a buildup phase before a major move.
---
🔮 Strategic Takeaway:
APT is sitting at a make-or-break level. The $3.00 – $4.50 zone is critical for both short- and long-term structure. For swing traders and investors, this zone offers a high risk-reward opportunity — but confirmation is key.
> ⏳ Patience in the demand zone can lead to the best trades. Wait for confirmation, not hope.
#APTUSDT #AltcoinAnalysis #DemandZone #CryptoReversal #TechnicalAnalysis #PriceAction #SwingTrading #CryptoMarket
APT : Did the buyers arrive?Hello friends🙌
📈An ascending channel and then a descending channel and then an ascending channel.📉
✔The point is that when the price entered an ascending channel, your price entered and with a failure it entered a descending channel and you exited with a loss and again when the price is at the peak of despair you see that the main buyers enter and push the price up and cause a new ascending channel.
🔊Considering these tips we have told you, always have a trading plan and follow capital management so that you do not fall into the trap.
🔥Follow us for more signals🔥
*Trade safely with us*

APT at Historic Support – Massive Reversal Incoming?APTUSDT technical analysis update
APT has been trading inside a descending channel for over 900 days, and it's now once again testing the channel support. As shown in the chart, the price has bounced multiple times from this level, making it a historically strong support zone.
Currently, the target is the upper boundary of the channel (resistance). If APT manages to break out of this long-term descending channel, it could trigger a strong bullish move, possibly a moonshot.

APTUSDT 1W AnalysisAPT ~ 1W Analysis
#APT If you still have faith in this coin. This support can be considered to start buying back with a short-term target of at least 15%++

APTUSDT 1D AnalysisAPT ~ 1D Analysis
#APT Buy back gradually from here if you still have confidence in this coin with a short term target of at least 15%+ and a long term target of $15

APTUSDT 1D Analysis APT ~ 1D Analysis
#APT Buy back gradually from this support block with a short term target of at least 15%++ from here.

Aptos scalp n swing trade setupAptos is facing daily Order Block resistance , While on Weekly clearly showing to take out the previous high 15-16$, It's a weekly TF so it will take time. On a day trade you can take long position from the mentioned zone, while in upcoming days it's gonna hit 7.42$ at least to fill the imbalance even if it's a bear market. If any 1hr candle closes below the mentioned zone then it will take correction for short term of period then it will take flight to towards the 15-16$. If you are investor then accumulate between 4.5-5$ and set tp and forget it. If you wanna take the long position then take it from the mentioned zone if candle closes below the zone then wait for the retest and close on breakeven.

APTUSDT 1D AnalysisAPT ~ 1D Analysis
#APT Buy after successfully penetrating this resistant line with a short -term target of at least 10%+ from here.

APTUSDT - the real monster!APT has reached its strongest support level ever.
You’ll notice that price always tends to bounce from this exact zone.
This coin hasn’t moved yet, and its long-term targets are insane — definitely worth having a portion of it in your portfolio
Best regards Cecilion🎯

#APT/USDT
#APT
The price is moving within a descending channel on the 1-hour frame, adhering well to it, and is heading for a strong breakout and retest.
We are experiencing a rebound from the lower boundary of the descending channel, which is support at 4.75.
We are experiencing a downtrend on the RSI indicator that is about to be broken and retested, supporting the upward trend.
We are looking for stability above the 100 Moving Average.
Entry price: 4.95
First target: 5.06
Second target: 5.17
Third target: 5.28

APTUSDT 4DAPT ~ 4D Analysis
#APT Buy back when testing this support with a short -term target of at least 20%+ from here.


APTUSDT LONG 4H [2 Targets Done]This position received new variables from the roar on this fall , generating EQL values of $5.04
Accordingly, the POI range test as a basis for personal expectations is confirmed :
-volume
-retention rate
-confirmation of the structure.
At the moment, 2 targets are fixed and the stop is moving to breakeven . A more detailed review can be seen in this replay:

APTUSDT LONG 4H I expect the APT price to decrease in the POI 4H block, in which I will work out a long position with the goals indicated on the trading chart :
Targets:
$5.77
$6.44
$7.34
$8.23
Risk management - 1% on stop order

APT target $8.64h time frame
-
Entry: $5.95
TP: $8.6
SL: $5.77
RR: 14.3
-
(1) APT has broken out the wedge structure on 19th Feb.
(2) Currently retesting this wedge and fibonacci 0.382 at $5.95
(3) One more time to retest $5.95 with effective support is our entry opportunity
(4) Targets analyzed from structure and fibonaaci are $7.27 and $8.76
(4) Stop loss once going below $5.77

APTUSDT Analysis: Waiting for Lower LevelsI see no reason not to wait for lower levels in APTUSDT. The market conditions suggest that there might be a better opportunity for entries at these levels.
Key Points:
Lower Levels: Waiting for lower levels might provide better risk/reward setups.
Market Conditions: Keep in mind that market conditions can change quickly, so stay cautious.
Confirmation Indicators: Use CDV, liquidity heatmaps, volume profiles, volume footprints , and upward market structure breaks in lower time frames for validation.
Learn With Me: If you're interested in learning how to use these tools for accurate demand zone identification, feel free to DM me.
If this analysis helps you, please don’t forget to boost and comment. Your support motivates me to share more insights!
If you think this analysis helps you, please don't forget to boost and comment on this. These motivate me to share more insights with you!
I keep my charts clean and simple because I believe clarity leads to better decisions.
My approach is built on years of experience and a solid track record. I don’t claim to know it all, but I’m confident in my ability to spot high-probability setups.
If you would like to learn how to use the heatmap, cumulative volume delta and volume footprint techniques that I use below to determine very accurate demand regions, you can send me a private message. I help anyone who wants it completely free of charge.
My Previous Analysis
🎯 ZENUSDT.P: Patience & Profitability | %230 Reaction from the Sniper Entry
🐶 DOGEUSDT.P: Next Move
🎨 RENDERUSDT.P: Opportunity of the Month
💎 ETHUSDT.P: Where to Retrace
🟢 BNBUSDT.P: Potential Surge
📊 BTC Dominance: Reaction Zone
🌊 WAVESUSDT.P: Demand Zone Potential
🟣 UNIUSDT.P: Long-Term Trade
🔵 XRPUSDT.P: Entry Zones
🔗 LINKUSDT.P: Follow The River
📈 BTCUSDT.P: Two Key Demand Zones
🟩 POLUSDT: Bullish Momentum
🌟 PENDLEUSDT.P: Where Opportunity Meets Precision
🔥 BTCUSDT.P: Liquidation of Highly Leveraged Longs
🌊 SOLUSDT.P: SOL's Dip - Your Opportunity
🐸 1000PEPEUSDT.P: Prime Bounce Zone Unlocked
🚀 ETHUSDT.P: Set to Explode - Don't Miss This Game Changer
🤖 IQUSDT: Smart Plan
⚡️ PONDUSDT: A Trade Not Taken Is Better Than a Losing One
💼 STMXUSDT: 2 Buying Areas
🐢 TURBOUSDT: Buy Zones and Buyer Presence
🌍 ICPUSDT.P: Massive Upside Potential | Check the Trade Update For Seeing Results
🟠 IDEXUSDT: Spot Buy Area | %26 Profit if You Trade with MSB
📌 USUALUSDT: Buyers Are Active + %70 Profit in Total
🌟 FORTHUSDT: Sniper Entry +%26 Reaction
🐳 QKCUSDT: Sniper Entry +%57 Reaction
📊 BTC.D: Retest of Key Area Highly Likely
I stopped adding to the list because it's kinda tiring to add 5-10 charts in every move but you can check my profile and see that it goes on..

APTUSDT 6DAPT ~ 6D Analysis
#APT If you still have a Conviction on this coin,. buy gradually from here with a minimum target of 20%+

#APT/USDT Ready to go higher#APT
The price is moving in a descending channel on the 1-hour frame and sticking to it well
We have a bounce from the lower limit of the descending channel, this support is at a price of 4.20
We have a downtrend on the RSI indicator that is about to be broken, which supports the rise
We have a trend to stabilize above the moving average 100
Entry price 8.23
First target 8.58
Second target 8.82
Third target 9.08

APTUSDT 1WAPT ~ 1W
#APT Has finished with the rising wave 5,. This is an Elliot Wave pattern, and usually this will be followed by an ABC correction. if this really happens,. then this support block would be a good buying place for now.

#APT/USDT Ready to go higher#APT
The price is moving in a descending channel on a 15-minute frame and sticking to it well
We have a bounce from the lower limit of the descending channel, this support is at 13.00
We have a downtrend on the RSI indicator that is about to be broken, which supports the rise
We have a trend to stabilize above the moving average 100
Entry price 13.40
First target 13.73
Second target 14.19
Third target 14.62

Aptos APT is ready to take off!Hello, Skyrexians!
Yesterday we considered ADA analysis and today the price of this asset started moving up and surged +14% in less than one day. Hope you were able to make a right decision. Today we will take a look at BINANCE:APTUSDT - another one interesting cryptocurrency with the great potential in the bull market.
On the chart you can see the weekly time frame for Aptos. Technically it is printing the global 2 year sideways. As you know, the sideways movement can be the accumulation or distribution. We suppose that it's accumulation before the mark up phase. Elliott waves analysis gives us the clear answer. We consider the early growth as the impulsive wave 1, after that APT is in flat correction, the wave 2, which consists of zigzag ABC. Look how perfectly wave C collected liquidity below the wave's A bottom and started going up.
Let's also notice the green dot which has been flashed by Bullish/Bearish Bars Indicator . It's is showing us the potential reversal points. Take a look how great it worker previous 2 times, indicated wave's A bottom and wave's B top. Now there is a high probability that it was the global bottom before the expansion to the upside.
The while line of the indicator showing the local support, if price is able to maintain above it, usually it leads to impulse. If our analysis is correct the wave 3 is incoming. We can calculate the targets using Fibonacci extension levels. The minimal one is $42, max target is $64.
Best regards,
Skyrexio Team
___________________________________________________________
Please, boost this article and subscribe our page if you like analysis!
