APTUSDT — Retesting the Demand Zone Before Potential Rally back?1. Overview
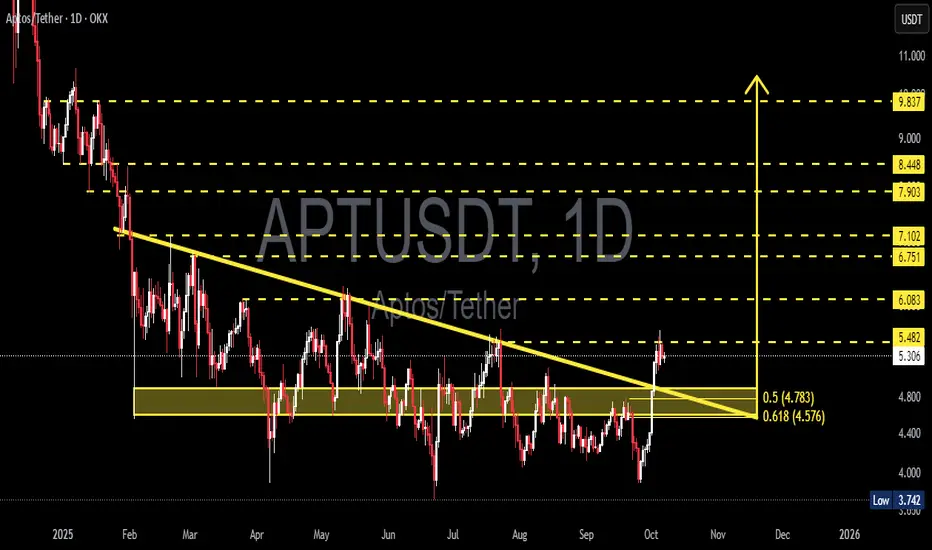
APT/USDT has been in a medium-term downtrend since early 2025, consistently forming lower highs and lower lows along the primary descending trendline (yellow).
Recently, however, the market has shown a clear shift in momentum: price successfully broke above the descending trendline and is now trading above a major confluence area between Fibonacci 0.5 and 0.618 (4.78–4.57).
This zone serves as the primary demand base, where historical accumulation by buyers has previously occurred. The breakout indicates a possible early stage of structural reversal, transitioning from a bearish environment toward a medium-term bullish phase.
---
2. Structure and Pattern
Over the past nine months, APT has formed a Descending Channel / Triangle pattern, where selling pressure gradually weakened as buyers began absorbing liquidity at lower levels.
The breakout above the trendline suggests a trendline breakout followed by a demand retest, a classic setup often signaling the start of a trend reversal.
If the 4.57–4.78 zone holds during the retest, the price structure could evolve into a compressed Inverse Head & Shoulders, further strengthening the bullish reversal narrative.
---
3. Key Technical Levels
The technical structure of APT can be summarized through several critical zones:
Main Demand Zone (4.783 – 4.576)
This is the key confluence area between the 0.5 and 0.618 Fibonacci retracements. Buyers have previously shown strong reactions here. Holding this level is crucial to validate the current breakout.
Immediate Resistance (5.482)
This marks the breakout line of the long-term descending trendline and the first significant psychological resistance. A daily close above this zone would confirm bullish continuation.
Major Support (3.742)
This is the main structural low formed during the previous capitulation phase. A breakdown below this level would invalidate the bullish structure and signal a potential continuation of the downtrend.
Upside Targets (Fibonacci Extensions)
Upon successful confirmation, price targets are projected at 6.083, 6.751, and 7.102, with extended targets at 7.903, 8.448, and 9.837.
The 4.57–4.78 region now acts as the core battlefield between buyers and sellers — defending this zone keeps the bullish structure intact.
---
4. Bullish Scenario
Confirmation Conditions:
Daily close above 5.48 with strong volume, or
Successful retest and bounce from 4.58–4.78.
If these conditions are met, the likelihood of sustained bullish continuation increases significantly.
Projected upside targets:
Target 1: 6.083
Target 2: 6.751
Target 3: 7.102
Momentum extension could push toward 7.90–9.84 if volume and sentiment align.
Additional confirmations:
RSI rising above 50 → showing positive momentum.
MACD golden cross in the positive zone → trend strength confirmation.
Increasing breakout volume → evidence of institutional accumulation.
Bullish invalidation: daily close below 4.576.
---
5. Bearish Scenario
If price fails to sustain above 5.48 and instead breaks down through the 4.58–4.78 zone, the breakout will be classified as a false breakout.
In this case, potential downside includes:
Short-term pullback toward 4.00,
And a deeper retest near 3.742, the major structural support.
A daily close below 3.742 would confirm trend continuation to the downside and nullify the reversal structure.
---
6. Market Sentiment and Dynamics
APT is currently in a transition phase between capitulation and re-accumulation.
The breakout above the trendline, combined with increasing buying volume, suggests a change in market character — shifting from selling pressure to growing demand.
If the broader crypto environment remains stable and risk appetite returns to altcoins, APT could become one of the stronger Layer-1 recovery candidates in the coming cycle.
However, two main risks remain:
1. False breakout caused by weak volume.
2. Low liquidity at higher levels that may lead to sharp retracements before continuation.
---
7. Trading Approach (Not Financial Advice)
A. Conservative Swing Approach
Entry: confirmed bounce at 4.78–4.60
Stop Loss: below 4.40
Take Profit: 6.08 / 6.75 / 7.10
Risk:Reward: approximately 1:3
B. Momentum Approach
Entry: breakout confirmation above 5.48 with strong volume
Stop Loss: below 4.78
Target: 6.75–7.10
---
8. Conclusion
APT/USDT stands at a technically decisive point.
The breakout above the long-term descending trendline signals a potential major shift in market direction.
However, full confirmation depends on the ability of the 4.58–4.78 zone to hold during the retest.
If the zone holds, the next move toward 6.75–7.10 could unfold over the coming weeks.
If it fails, sellers may regain control, pulling the price back to 3.74 and continuing the broader downtrend.
The coming sessions will determine whether this marks the beginning of a true bullish reversal or merely a temporary false breakout.
---
9. Relevant Hashtags
#APT #APTUSDT #Aptos #CryptoAnalysis #TechnicalAnalysis #Breakout #SupplyDemand #Fibonacci #SupportResistance #SwingTrading #PriceAction #TrendReversal #Altcoins #CryptoMarket
Aptusdtsignal

Aptus Apt usdt Daily analysis
Time frame daily
Risk rewards ratio >2 👈👌
Target 7.4$
Pattern = two bottom

APTUSDT Aptos Scalp buy / Long Setupaptos trying to breakout, wait till London session, if tp hits first then ignore, will share setup, must use sl as it's a scalp trade.

APT/USDT – Final Defense at Weekly Demand Zone! Prepare for MoveAPT is currently standing at a make-or-break level. Price has retraced back to the critical weekly demand zone between $4.00 and $4.40 — a region that previously served as the launchpad for a major rally in early 2023.
This isn't just any support — it’s a historical accumulation zone, where strong buying interest was previously observed. The big question is: Will history repeat itself, or is a major breakdown looming?
🔍 Pattern Structure and Technical Outlook:
APT has been consolidating inside a large horizontal range (accumulation box) between $4.00 and $18.27 for nearly two years.
Price is now retesting the lower boundary of this range, right at the $4.00–$4.40 zone.
Current price action shows heavy selling pressure, but buyers may step in at this demand level.
A potential double bottom or false breakdown could form if this week closes with a long lower wick and bullish body.
🟢 Bullish Scenario: Reversal from the Legendary Support
If the $4.00–$4.40 zone holds once again, we could witness a technical rebound with meaningful upside targets:
Key Bullish Targets:
1. $5.14 – Immediate minor resistance, easy to break if short-covering begins.
2. $5.86 – A key level previously rejected, acting as the first confirmation of trend reversal.
3. $7.63 – $9.00 – Former consolidation zone, potential mid-term target.
4. $10.18 to $14.51 – If momentum builds, this becomes the next major expansion zone.
> 📈 Positive catalysts such as improving crypto sentiment, strong volume inflow, or bullish fundamentals could accelerate this scenario.
🔴 Bearish Scenario: Critical Breakdown from Demand Structure
If sellers remain dominant and price closes below $4.00, this would:
Confirm a breakdown from the long-standing accumulation range
Open the door for a deeper retracement toward:
$3.50
$2.80
Possibly as low as the psychological level of $2.00
> ⚠️ Such a breakdown could indicate a major distribution phase and a loss of confidence from larger market players.
🧠 Suggested Trading Strategies:
Buy on Confirmation: Look for strong bullish reversal candles (hammer, pin bar, bullish engulfing) at the demand zone.
Breakout Strategy: Wait for a breakout and retest above $5.86–$7.63 for a safer entry.
Bearish Bias: Consider short entries on a confirmed breakdown and failed retest above $4.00.
📌 Conclusion:
APT is testing its final line of defense. The $4.00 zone remains the last stand for bulls before opening the door to deeper downside levels. Will buyers show strength once again, or are we headed for a major sell-off?
> This week’s close is crucial and could define APT’s trajectory for the upcoming quarter. Watch volume, candle structure, and buyer reaction very closely.
#APTUSDT #APTAnalysis #CryptoReversal #DemandZone #SupportAndResistance #PriceActionTrading #AltcoinSetup #TechnicalAnalysis #CryptoBreakout

APTUSDT 1W AnalysisAPT ~ 1W Analysis
#APT If you still have faith in this coin. This support can be considered to start buying back with a short-term target of at least 15%++

APTUSDT 1D AnalysisAPT ~ 1D Analysis
#APT Buy back gradually from here if you still have confidence in this coin with a short term target of at least 15%+ and a long term target of $15

APTUSDT 1D Analysis APT ~ 1D Analysis
#APT Buy back gradually from this support block with a short term target of at least 15%++ from here.

APTUSDT 1D AnalysisAPT ~ 1D Analysis
#APT Buy after successfully penetrating this resistant line with a short -term target of at least 10%+ from here.

APTUSDT 4DAPT ~ 4D Analysis
#APT Buy back when testing this support with a short -term target of at least 20%+ from here.


APTUSDT LONG 4H [2 Targets Done]This position received new variables from the roar on this fall , generating EQL values of $5.04
Accordingly, the POI range test as a basis for personal expectations is confirmed :
-volume
-retention rate
-confirmation of the structure.
At the moment, 2 targets are fixed and the stop is moving to breakeven . A more detailed review can be seen in this replay:

APTUSDT LONG 4H I expect the APT price to decrease in the POI 4H block, in which I will work out a long position with the goals indicated on the trading chart :
Targets:
$5.77
$6.44
$7.34
$8.23
Risk management - 1% on stop order

APT/USDT : Next Stop $20?BINANCE:APTUSDT
"In the weekly timeframe, the price is at a bottom and has shown a positive reaction. Considering the current conditions of Bitcoin and Ethereum—especially Ethereum, which has had a significant drop and is now at strong support—I believe this Symbol has strong potential for a substantial upward move. My price target, based on liquidity above key highs, is over $20."

#APTUSDT expecting further decline📉 SHORT BYBIT:APTUSDT.P from $5.5950
🛡 Stop Loss: $5.7250
⏱ 1H Timeframe
✅ Overview:
➡️ BYBIT:APTUSDT.P remains in a downtrend, forming lower lows. The price broke key support at $5.6600 and continues downward.
➡️ POC (Point of Control) at $5.94 indicates the highest liquidity zone, confirming a bearish market sentiment.
➡️ A breakdown of $5.5950 strengthens the downtrend, opening the way toward $5.2950, where buyers previously showed interest.
➡️ Holding below $5.5950 will likely accelerate selling pressure.
⚡ Plan:
➡️ Enter SHORT after confirming a breakdown below $5.5950, signaling further downside.
➡️ Risk management through Stop-Loss at $5.7250, placed above resistance.
➡️ Primary downside target – $5.2950, where buyers may step in.
🎯 TP Targets:
💎 TP1: $5.2950 – key support level.
📢 BYBIT:APTUSDT.P remains in a strong downtrend with no clear signs of reversal. If the $5.5950 level breaks with increasing volume, the decline may accelerate.
📢 It is crucial to watch the reaction at $5.2950—if significant buying interest appears, a short-term bounce is possible. However, if selling pressure persists, the price may continue to fall toward $4.3450.
🚀 BYBIT:APTUSDT.P remains weak - expecting further decline!

APTUSDT 6DAPT ~ 6D Analysis
#APT If you still have a Conviction on this coin,. buy gradually from here with a minimum target of 20%+

APTUSDT 1WAPT ~ 1W
#APT Has finished with the rising wave 5,. This is an Elliot Wave pattern, and usually this will be followed by an ABC correction. if this really happens,. then this support block would be a good buying place for now.

APTUSDT Technical Analysis: Risk-Reward Setup with Dynamic Sp.LvRisk: %17 | Reward: %45 and beyond
APTUSDT is exhibiting signs of potential price movement with significant technical indicators supporting the analysis. A noticeable bullish divergence on RSI and a temporary retracement towards a key support level may provide an ideal opportunity for long positions. Traders are advised to watch price action closely around the identified trendline and support zones for entry confirmations.
Trading suggestion:
A possible retracement to the $8.37 support line might occur.
Traders can consider setting buy orders based on price action confirmation near the suggested support and aim for mid to long-term targets.
Technical analysis:
The RSI is oversold, indicating potential upside momentum if the trendline is respected.
The DMF Index shows declining bearish pressure, hinting at a reversal possibility.
SL = Break below $6.91 support zone.
This setup offers a favorable risk-to-reward ratio with dynamic levels to monitor. Always trade with proper risk management strategies.

APTUSDT Is a Bullish Breakout Coming, or Will Support Give Way?Yello, Paradisers! Are you keeping an eye on #APTUSDT? This setup could deliver significant gains or signal a sharp pullback—let’s break it down.
💎#APT recently made a strong rebound from its support zone, suggesting the potential for bullish continuation if it can break above the minor resistance at 15.36. A successful breakout here could trigger a mid-term rally, with the major resistance zone as the next target.
💎However, there are critical levels to watch. If APT fails to break 15.36, the price might pull back to the support area between 11.20 and 10.40. If this zone holds, we could see a rebound and another attempt at the minor resistance.
💎If the 11.20–10.40 support doesn’t hold, the price could dip further into the demand zone at 9.60. A liquidity sweep here might spark a stronger rebound and a renewed upward movement.
💎It’s important to stay cautious. If APT breaks below the strong support at 9.60 and closes a daily candle below it, the bullish case will be invalidated, and further downside may follow.
Be patient, wait for clear confirmations, and manage your risks wisely. Consistency and discipline are the keys to navigating opportunities like this one. Stay focused and trade strategically.
MyCryptoParadise
iFeel the success🌴

APTUSDT - Real project ... Potential targets!APT is one of the important coins in layer1 Network with (7.65B marketcap)
if u want to triple ur capital then buy APT!
- Strong project
- Ranked 25 in marketcap
- displays a Cup and Handle pattern in weekly chart
- Hasn't moved strongly yet
Best regards Ceciliones🎯

APTUSDT Bullish Momentum or Breakdown? A Critical Moment Ahead!Yello, Paradisers! Is #APTUSDT about to break out further or slide into a bearish trap? Let’s dive in.
💎#APT is showing strong bullish momentum, successfully breaking out from the Inverse Head and Shoulders (IHNS) pattern and its resistance trendline. The price is now retesting the breakout, and with a successful rebound, we anticipate an upward movement towards the minor resistance level at $9.4. This will be a crucial level to watch, as a breakout above $9.4 will pave the way for APT to reach our final target at the strong resistance area.
💎However, we should be cautious. If APT fails to hold the support at $7.2 and breaks down, this could be a dangerous sign. In that case, the price might head towards the demand area at $5.6. For a continued bullish move, APT needs to reclaim and stay above $7.5.
💎But here’s the real danger zone—if APT fails to rebound at the demand area and breaks below it, our bullish outlook will be invalidated, and the probability of a deeper dip will increase significantly.
If you want to be consistently profitable, you need to be extremely patient and always wait only for the best, highest probability trading opportunities.
MyCryptoParadise
iFeel the success🌴

Long Position on APTUSDT 1H / (Volume Projection)BINANCE:APTUSDT
COINBASE:APTUSD
Mid-risk status: 5x-8x Leverage
Low-risk status: 3x-4x Leverage
👾The setup is active but expect the uncertain phase as well.
⚡️TP:
5.96
6.05
6.15
6.25
6.32
6.45
6.52
6.60(In Optimistic Scenario)
➡️SL:
5.6
🧐The Alternate scenario:
🔴If the price stabilizes below the trigger zone, the setup will be cancelled.

APTUSDT: Bullish Move on the HorizonAPTUSDT Technical analysis update
APT price is trading within a descending channel and is now moving toward a potential breakout. Before the breakout, we can expect a small pullback. Once the breakout occurs, a strong bullish move is anticipated.
Buy level: after the breakout confirmation.
Regards
Hexa
