FireHoseReel | ARB 4H Range Structure with Pre-Breakout Zones🔥 Welcome To FireHoseReel !
Let’s dive into Arbitrum (ARB) analysis.
⛳️ ARB Fundamental Overview
Arbitrum (ARB) is an Ethereum Layer-2 scaling solution ranked #56 on CoinMarketCap. It makes transactions faster and cheaper while supporting many dApps.
👀 ARB 4H Overview
ARB is trading inside a 4-hour range, with the upper boundary at $0.2242 and the lower boundary at $0.1875. At the moment, two pre-breakout zones have formed, both offering potential trading opportunities.
📊 Volume Analysis
Compared to other coins, ARB’s volume remains relatively strong. However, while price is ranging inside this box, volume has slightly decreased compared to previous levels. A volume expansion could trigger the next move and drive price out of the range.
✍️ ARB Trading Scenarios
🟢 Long Scenario 1:
A break above the pre-breakout zone at $0.2025, supported by rising buying volume and an RSI momentum break above the 46 level, could provide a valid long setup. The next resistance is located at the range high around $0.2242.
🔴 Short Scenario:
A break below the pre-breakout zone at $0.1921, confirmed by increasing selling volume and an RSI momentum break below the 32 level, could offer a short opportunity. The next support lies near the range low at $0.1875. Since these two levels are close, the position would be entered slightly earlier.
🧠 Protect your capital first. No setup is worth blowing your account. If risk isn’t controlled, profit means nothing. Trade with rules, not emotions.
Arbanalysis

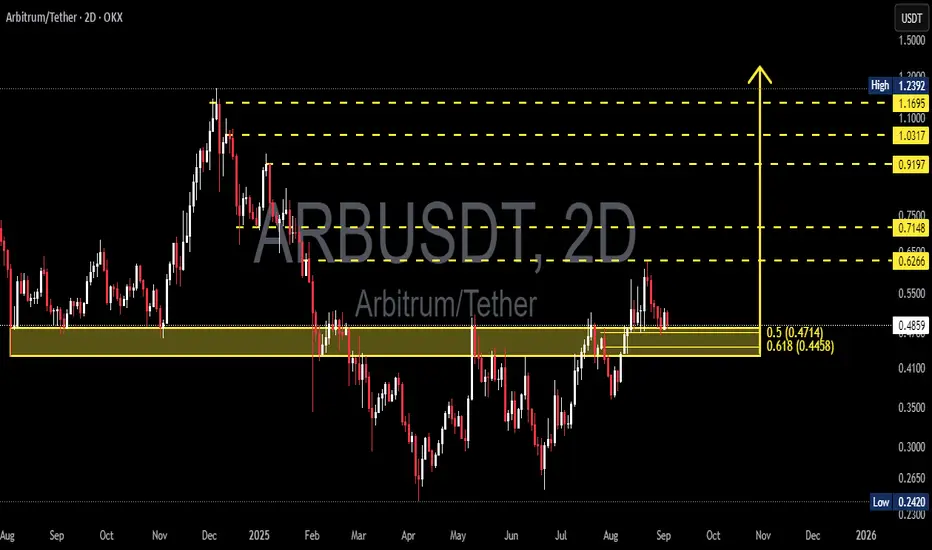
ARB/USDT — Retesting the Golden Pocket Before the Next Big Move?
📝 Key Summary:
Arbitrum (ARB) is currently consolidating within the Fibonacci golden pocket (0.445–0.471), which also acts as a major demand zone. This area will decide whether ARB can continue its bullish phase toward the psychological $1+ levels, or fail to hold and revisit deeper supports.
---
🔍 Price Structure & Key Patterns
1. Accumulation / Demand Zone (0.445–0.471):
This zone is a confluence of Fibonacci 0.5–0.618 and a strong historical support-resistance flip. Holding this level keeps the mid-term bullish case alive.
2. Higher Low Formation Since June:
From the 0.242 bottom, ARB has started forming higher lows, suggesting a potential transition toward a healthier uptrend.
3. Rejection at Supply Zone (0.62–0.63):
The latest rally was rejected here, confirming strong selling pressure. A clean breakout above this zone will be a key signal for a larger rally.
4. Wide Trading Range:
ARB is still ranging between 0.24 (low) and 1.23 (high). The current price sits in the lower-mid range, making this a high-interest zone for medium-term investors.
---
📈 Bullish Scenario
✅ Conditions: Price holds above 0.445–0.471 (2D bullish close + volume confirmation).
➡️ Upside targets:
First resistance: 0.6266
Next: 0.7148 → 0.9197 → 1.0317 → 1.1695 → 1.2392 (previous high)
📌 Note: A breakout above 0.63 with strong volume could trigger a multi-week swing rally.
---
📉 Bearish Scenario
❌ Conditions: 2D close below 0.4458 + strong selling volume.
➡️ Downside targets:
0.35 (intermediate support)
0.2420 (multi-month low / extreme demand zone)
📌 Note: Losing the golden pocket usually signals that the market isn’t ready for a bullish trend, raising the risk of retesting previous lows.
---
🧭 Trading Approach
Conservative: Wait for a 2D bullish rejection above 0.47 → long entry, stop below 0.445, first target 0.6266+.
Aggressive: Partial long entries at current levels, adding more upon bullish confirmation.
Short setup: Valid on breakdown below 0.445 → target 0.35, extension to 0.24 if selling persists.
Always apply risk management (RR ≥ 1:2), scale out at resistance levels.
---
📌 Conclusion
ARB is currently sitting at the key decision zone (Fibonacci golden pocket 0.445–0.471).
If this zone holds → bullish bias toward 0.63 up to 0.92+.
If this zone breaks → bearish bias toward 0.35 and potentially 0.24.
Traders should wait for candle + volume confirmation before committing, as this level could mark a major turning point in ARB’s mid-term trend.
---
#ARB #ARBUSDT #Arbitrum #CryptoAnalysis #PriceAction #SupportResistance #Fibonacci #CryptoTrading #Altcoins #SwingTrade
Bullish Setup on ARBUSDT: Risking 5.5% to Gain 13% Toward $0.339The price action of ARBUSDT has shown a significant reversal from a strong support region around 0.2612–0.2838 USDT, marked by bullish engulfing candles and a clear break above the descending trendline. This breakout is reinforced by the Supertrend indicator flipping green, signaling a potential shift in momentum toward the upside.
After bottoming out near 0.26, ARBUSDT has established a short-term higher low structure, and the current price action shows consolidation above the trendline, hinting at a possible continuation toward the next resistance.
A resistance level is marked at 0.3399, which coincides with previous supply and rejection zones. Volume and structure suggest buyers are regaining control, especially after holding support above 0.29 despite market-wide volatility.
📈 Trade Setup
• Entry Zone: 0.3000–0.3015
(Preferably on a bullish 4H candle close above 0.3000 for confirmation)
• Stop-Loss: 0.2838
(Just below the short-term demand zone and minor structure)
• Take-Profit: 0.3399
(Aligns with recent resistance and upper rejection zones)
• Risk–Reward Ratio: ~2.36
(Potential gain: ~13.11%, Potential loss: ~5.56%)
💬 Conclusion
ARBUSDT looks poised for a recovery after bottoming out near a strong multi-week support region. The break of the falling trendline and transition above the Supertrend resistance enhances the bullish outlook. A breakout above 0.3015 could lead to a push toward the 0.3399 resistance.
Note: If momentum builds above 0.3399, we may even see extension targets around 0.36–0.38 in the coming sessions. However, for now, staying disciplined within the trade plan ensures better risk control.

ARB/USDT Symmetrical Triangle Breakout with Pullback OpportunityThe chart depicts a Symmetrical Triangle pattern, indicating a phase of consolidation followed by a confirmed breakout to the upside. Currently, the price is undergoing a pullback, presenting a potential opportunity for entry within the retracement zone.
Key Observations
1. The Symmetrical Triangle structure has already been breached, signaling the continuation of bullish momentum.
2. The price is retracing towards the $0.85–$0.84 zone, which aligns with key support and represents an attractive area for accumulation.
3. The projected target post-breakout is approximately $1.00, consistent with historical resistance levels and the triangle's measured move.
Strategic Implications
Focus on the pullback as a buying opportunity near $0.85–$0.84. Ensure the pullback holds within this range to confirm support and validate the bullish setup. Look for signs of reversal, such as bullish candlestick patterns or increased volume, to reinforce confidence in the trade. Set a stop-loss below $0.80 to mitigate downside risk, while aiming for the $1.00 target as the primary profit zone.

#ARB (SPOT) entry range( 0.4650- 0.6150) T.(1.3990) SL(0.4287)BINANCE:ARBUSDT
entry range ( 0.4650- 0.6150)
Target1 (0.9000) - Target2 (1.0740)- Target3 (1.3990)
1 Extra Targets(optional) in chart, if you like to continue in the trade with making stoploss very high.
SL .1D close below (0.4287)
*** collect the coin slowly in the entry range ***
*** No FOMO - No Rush , it is a long journey ***
**** #Manta ,#OMNI, #DYM, #AI, #IO, #XAI , #ACE #NFP #RAD #WLD #ORDI #BLUR #SUI #Voxel #AEVO #VITE #APE #RDNT #FLUX #NMR #VANRY #TRB #HBAR #DGB #XEC #ERN #ALT #IO #ACA #HIVE #ASTR #ARDR #PIXEL #LTO #AERGO #SCRT #ATA #HOOK #FLOW #KSM #HFT #MINA #DATA #SC #JOE #RDNT #IQ #CFX #BICO #ARB ****

Arbitrum Analysis | Consolidation with a Bearish BiasCurrent Chart Analysis: The daily chart of ARB continues to show a steady downtrend within a broad range. This pattern reflects sustained selling pressure and dominant bearish sentiment in the market. The price is approaching a significant support level around $0.76 - $0.74, historically serving as a crucial zone for price stabilization.
Support and Resistance Levels: The current price is near a support level around $0.91. The critical resistance level to monitor is $1.29, which has been a strong barrier, often leading to price struggles and reversals upon testing.
Volume Analysis: Trading volumes typically increase during price declines, highlighting intensified selling pressure. During consolidation phases, volumes remain elevated while candlesticks exhibit low volatility. This pattern suggests market uncertainty and a lack of clear directional momentum, potentially signaling position accumulation by traders preparing for the next significant breakout or breakdown.
Possible Scenarios:
🟩 Bullish Scenario: A breakout above the local resistance level at $1.10, accompanied by increased trading volumes, could signal a potential bullish reversal, driving the price up to $1.29. To confirm the shift in market sentiment, this breakout should be supported by high volumes and price consolidation above the $1.29 level on the daily timeframe. This could lead to a subsequent phase of price consolidation, allowing for further testing of key resistance levels on the path to continued growth.
🟥 Bearish Scenario: If the price fails to hold above the $0.91 support level, it could lead to further declines. Consolidation below this support level would likely continue the downtrend towards the next support zone around $0.76 - $0.74. Traders should be prepared for potential short positions or implementing protective measures if this scenario unfolds.
Overall Market Sentiment:
Current Bias: ARB is displaying bearish sentiment, with potential for extended range-bound trading between the support at $0.91 and the resistance levels at $1.10 and $1.29. The recent token unlock event has added significant supply, contributing to downward pressure, while overall market uncertainty in the crypto space exacerbates this trend. Despite the bullish potential from the Robinhood integration, its impact appears muted in the current environment, unable to counterbalance the prevailing bearish dynamics.
Recommendations for Traders:
◼️ Monitoring Trading Volumes: Keep a close watch on trading volumes around key support and resistance levels to assess the strength of any breakout or pullback.
◼️ Preparation for Volatility: Given the recent increase in token supply and market uncertainties, expect heightened volatility. Consider risk management strategies such as setting stop-loss orders, adjusting position sizes, and employing careful entry and exit planning to mitigate risks from sudden market movements.
Disclaimer: Content for seasoned traders only. Not financial advice. You bear sole responsibility for trading outcomes. ➖ DYOR 🧠 💡
