#ARB/USDT#ARB
The price is moving within a descending channel on the hourly timeframe. It has reached the upper boundary and is trending downwards, with a retest of this boundary expected.
The Relative Strength Index (RSI) is showing an upward trend, approaching the upper boundary, and a downward reversal is anticipated.
There is a key resistance zone (in green) at 0.2250, and the price has bounced from this zone several times. Another bounce is expected.
The price is showing a consolidation pattern above the 100-period moving average, which we are approaching, supporting the possibility of a downward move towards it.
Entry Price: 0.2120
Target 1: 0.2017
Target 2: 0.1963
Target 3: 0.1887
Stop Loss: Above the green resistance zone.
Don't forget one simple thing: Money Management.
For inquiries, please leave a comment.
Thank you.
Arbbtc

#ARB/USDT | Testing Wedge Breakout Amid Key Support#ARB
The price is moving in a descending channel on the 1-hour timeframe. It has reached the lower boundary and is heading towards a breakout, with a retest of the upper boundary expected.
We are seeing a bearish trend in the Relative Strength Index (RSI), which has reached near the lower boundary, and an upward bounce is expected.
There is a key support zone in green at 0.1840, and the price has bounced from this level several times. Another bounce is expected.
We are seeing a trend towards stabilizing above the 100-period moving average, which we are approaching, supporting the upward trend.
Entry Price: 0.1900
First Target: 0.1924
Second Target: 0.1958
Third Target: 0.1995
Remember a simple principle: Money Management.
Place your stop-loss order below the green support zone.
For any questions, please leave a comment.
Thank you.

#ARB/USDT | Testing Wedge Breakout Amid Key Support#ARB
The price is moving in a descending channel on the 1-hour timeframe. It has reached the lower boundary and is heading towards breaking above it, with a retest of the upper boundary expected.
We have a downtrend on the RSI indicator, which has reached near the lower boundary, and an upward rebound is expected.
There is a key support zone in green at 0.1850. The price has bounced from this zone multiple times and is expected to bounce again.
We have a trend towards consolidation above the 100-period moving average, as we are moving close to it, which supports the upward movement.
Entry price: 0.1900
First target: 0.1931
Second target: 0.1984
Third target: 0.2044
Don't forget a simple principle: money management.
Place your stop-loss order below the support zone in green.
For any questions, please leave a comment.
Thank you.

FireHoseReel | ARB 4H Range Structure with Pre-Breakout Zones🔥 Welcome To FireHoseReel !
Let’s dive into Arbitrum (ARB) analysis.
⛳️ ARB Fundamental Overview
Arbitrum (ARB) is an Ethereum Layer-2 scaling solution ranked #56 on CoinMarketCap. It makes transactions faster and cheaper while supporting many dApps.
👀 ARB 4H Overview
ARB is trading inside a 4-hour range, with the upper boundary at $0.2242 and the lower boundary at $0.1875. At the moment, two pre-breakout zones have formed, both offering potential trading opportunities.
📊 Volume Analysis
Compared to other coins, ARB’s volume remains relatively strong. However, while price is ranging inside this box, volume has slightly decreased compared to previous levels. A volume expansion could trigger the next move and drive price out of the range.
✍️ ARB Trading Scenarios
🟢 Long Scenario 1:
A break above the pre-breakout zone at $0.2025, supported by rising buying volume and an RSI momentum break above the 46 level, could provide a valid long setup. The next resistance is located at the range high around $0.2242.
🔴 Short Scenario:
A break below the pre-breakout zone at $0.1921, confirmed by increasing selling volume and an RSI momentum break below the 32 level, could offer a short opportunity. The next support lies near the range low at $0.1875. Since these two levels are close, the position would be entered slightly earlier.
🧠 Protect your capital first. No setup is worth blowing your account. If risk isn’t controlled, profit means nothing. Trade with rules, not emotions.

#ARB/USDT | Testing Wedge Breakout Amid Key Support#ARB
The price is moving in a descending channel on the 1-hour timeframe. It has reached the lower boundary and is heading towards breaking above it, with a retest of the upper boundary expected.
We have a downtrend on the RSI indicator, which has reached near the lower boundary, and an upward rebound is expected.
There is a key support zone in green at 0.2000. The price has bounced from this level multiple times and is expected to bounce again.
We have a trend towards consolidation above the 100-period moving average, as we are moving close to it, which supports the upward movement.
Entry price: 0.2142
First target: 0.2170
Second target: 0.2219
Third target: 0.2280
Don't forget a simple principle: money management.
Place your stop-loss order below the support zone in green.
For any questions, please leave a comment.
Thank you.

#ARB/USDT | Testing Wedge Breakout Amid Key Support#ARB
The price is moving within an ascending channel on the 1-hour timeframe and is adhering to it well. It is poised to break out strongly and retest the channel.
We have a downtrend line on the RSI indicator that is about to break and retest, which supports the upward move.
There is a key support zone in green at 0.2276, representing a strong support point.
We have a trend of consolidation above the 100-period moving average.
Entry price: 0.2318
First target: 0.2384
Second target: 0.2447
Third target: 0.2520
Don't forget a simple money management rule:
Place your stop-loss order below the green support zone.
Once you reach the first target, save some money and then change your stop-loss order to an entry order.
For any questions, please leave a comment.
Thank you.
#ARB/USDT — Last Line of Defense: Reversal Incoming or Breakdo#ARB
The price is moving within an ascending channel on the 1-hour timeframe and is adhering to it well. It is poised to break out strongly and retest the channel.
We have a downtrend line on the RSI indicator that is about to break and retest, which supports the upward move.
There is a key support zone in green at 0.2517, representing a strong support point.
We have a trend of consolidation above the 100-period moving average.
Entry price: 0.2619
First target: 0.2693
Second target: 0.2776
Third target: 0.2883
Don't forget a simple money management rule:
Place your stop-loss order below the green support zone.
Once you reach the first target, save some money and then change your stop-loss order to an entry order.
For any questions, please leave a comment.
Thank you.

#ARB/USDT#ARB
The price is moving within an ascending channel on the 1-hour frame, adhering well to it, and is heading for a strong breakout and retest.
We have a bearish trend on the RSI indicator that is about to be broken and retested, which supports the upward breakout.
There is a major support area in green at 0.3200, which represents a strong support point.
We are heading for stability above the 100 moving average.
Entry price: 0.3307
First target: 0.3363
Second target: 0.3470
Third target: 0.3618
Don't forget a simple matter: capital management.
When you reach the first target, save some money and then change your stop-loss order to an entry order.
For inquiries, please leave a comment.
Thank you.

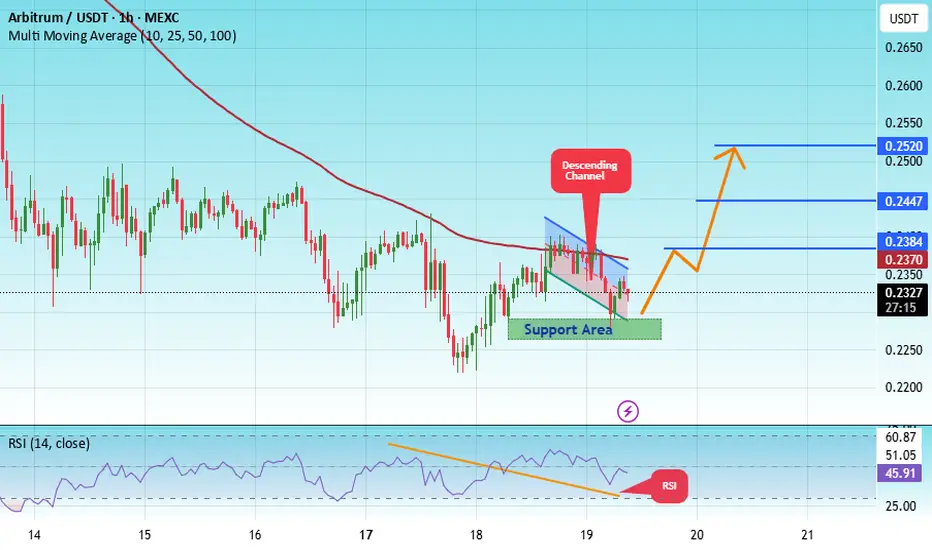
#ARB/USDT Analysis: Breakout Potential with Overbought RSI !#ARB
The price is moving within a descending channel on the 1-hour frame, adhering well to it, and is heading for a strong breakout and retest.
We have a bearish trend on the RSI indicator that is about to be broken and retested, which supports the upward breakout.
There is a major support area in green at 0.4180, which represents a strong support point.
We are heading for consolidation above the 100 moving average.
Entry price: 0.4229
First target: 0.4303
Second target: 0.4370
Third target: 0.4454
Don't forget a simple matter: capital management.
When you reach the first target, save some money and then change your stop-loss order to an entry order.
For inquiries, please leave a comment.
Thank you.
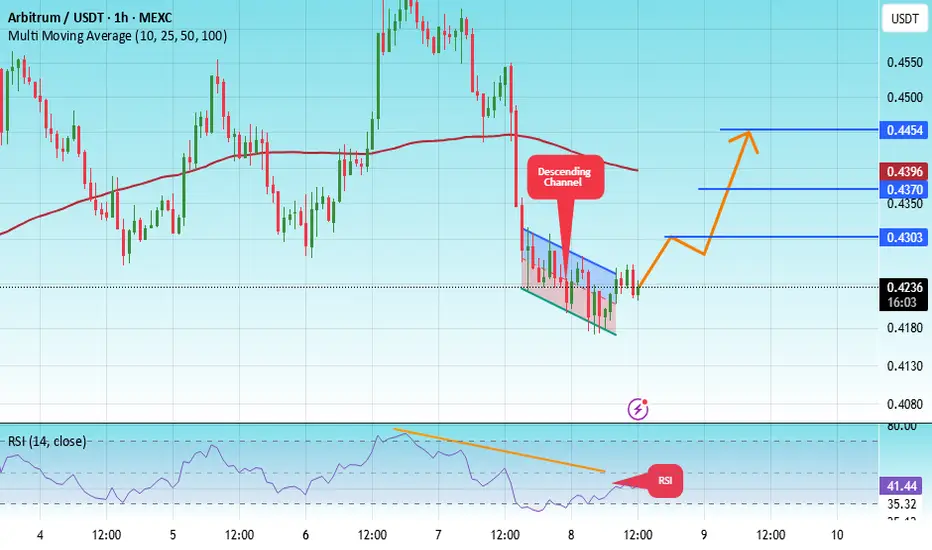
#ARB/USDT (ARB): Looking For Buy Entry | 2 Zones To Keep an Ey#ARB
The price is moving within a descending channel on the 1-hour frame, adhering well to it, and heading for a strong breakout and retest.
We have a bearish trend on the RSI indicator that is about to be broken and retested, which supports the upward breakout.
There is a major support area in green at 0.4140, which represents a strong support point.
We are heading for consolidation above the 100 moving average.
Entry price: 0.4160
First target: 0.4215
Second target: 0.4264
Third target: 0.4325
Don't forget a simple matter: capital management.
When you reach the first target, save some money and then change your stop-loss order to an entry order.
For inquiries, please leave a comment.
Thank you.

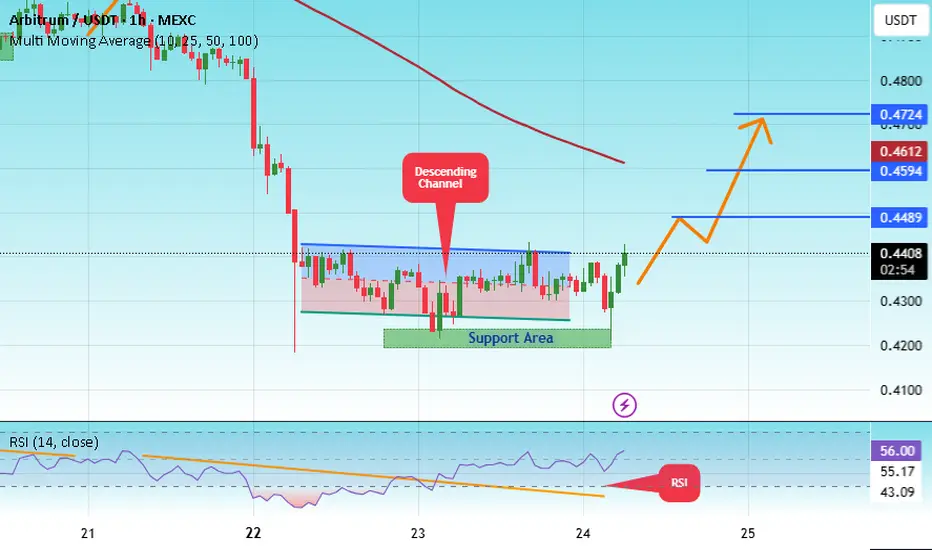
#ARB/USDT (ARB): Strong Liquidity Grab | Expecting Quick Recov#ARB
The price is moving within a descending channel on the 1-hour frame, adhering well to it, and is heading for a strong breakout and retest.
We have a bearish trend on the RSI indicator that is about to be broken and retested, which supports the upward breakout.
There is a major support area in green at 0.4200, which represents a strong support point.
We are heading for stability above the 100 moving average.
Entry price: 0.4400
First target: 0.4490
Second target: 0.4590
Third target: 0.4720
Don't forget a simple matter: capital management.
When you reach the first target, save some money and then change your stop-loss order to an entry order.
For inquiries, please leave a comment.
Thank you.
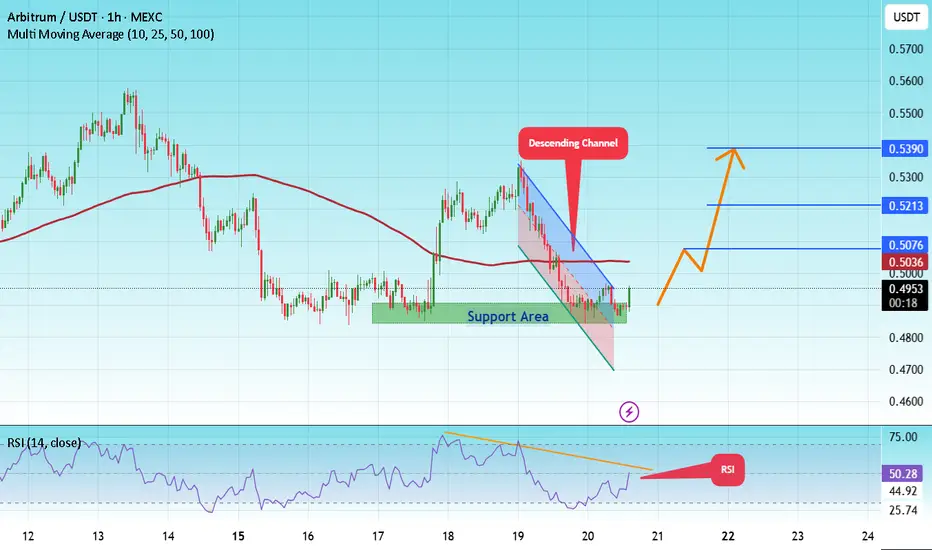
#ARB/USDT | TON Testing Wedge Breakout Amid Key Support#ARB
The price is moving in a descending channel on the 1-hour frame and is expected to break and continue upward.
We have a trend to stabilize above the 100 moving average once again.
We have a downtrend on the RSI indicator that supports the upward move with a breakout.
We have a major support area in green that pushed the price higher at 0.4858.
Entry price: 0.4940.
First target: 0.5076.
Second target: 0.5213.
Third target: 0.5390.
To manage risk, don't forget stop loss and capital management.
When you reach the first target, save some profits and then change the stop order to an entry order.
For inquiries, please comment.
Thank you.
#ARB/USDT Pro | ARB Set for Pump After Pullback to Support#ARB
The price is moving within a descending channel on the 1-hour frame, adhering well to it, and is heading for a strong breakout and retest.
We have a bearish trend on the RSI indicator that is about to be broken and retested, which supports the upward breakout.
There is a major support area in green at 0.4890, which represents a strong support point.
For inquiries, please leave a comment.
We are in a consolidation trend above the 100 moving average.
Entry price: 0.4942
First target: 0.5085
Second target: 0.5216
Third target: 0.5400
Don't forget a simple matter: capital management.
When you reach the first target, save some money and then change your stop-loss order to an entry order.
For inquiries, please leave a comment.
Thank you.

#ARB/USDT | ARB Set for Pump After Pullback to Support#ARB
The price is moving within a descending channel on the 1-hour frame, adhering well to it, and is heading for a strong breakout and retest.
We have a bearish trend on the RSI indicator that is about to be broken and retested, which supports the upward breakout.
There is a major support area in green at 0.4950, which represents a strong support point.
For inquiries, please leave a comment.
We are in a consolidation trend above the 100 moving average.
Entry price: 0.5083
First target: 0.5158
Second target: 0.5262
Third target: 0.5388
Don't forget a simple matter: capital management.
When you reach the first target, save some money and then change your stop-loss order to an entry order.
For inquiries, please leave a comment.
Thank you.

#ARB/USDT possible resistance/support flip happening#ARB
The price is moving within a descending channel on the 1-hour frame and is expected to break and continue upward.
We have a trend to stabilize above the 100 Moving Average once again.
We have a bearish trend on the RSI indicator, supporting the upward break.
We have a support area at the lower boundary of the channel at 0.4900, acting as strong support from which the price can rebound.
We have a major support area in green that pushed the price upward at 0.4860.
Entry price: 0.4940.
First target: 0.5008.
Second target: 0.5085.
Third target: 0.5180.
To manage risk, don't forget stop loss and capital management.
When you reach the first target, save some profits and then change your stop order to an entry order.
For inquiries, please comment.
Thank you.

#ARB/USDT#ARB
The price is moving within a descending channel on the 1-hour frame and is expected to break and continue upward.
We have a trend to stabilize above the 100 moving average once again.
We have a downtrend on the RSI indicator that supports the upward break.
We have a support area at the lower boundary of the channel at 0.4900, acting as strong support from which the price can rebound.
We have a major support area in green that pushed the price upward at 0.5000.
Entry price: 0.5314.
First target: 0.5578.
Second target: 0.5955.
Third target: 0.6341.
To manage risk, don't forget stop loss and capital management.
When you reach the first target, save some profits and then change your stop order to an entry order.
For inquiries, please comment.
Thank you.

ARBUSDT Forming Bullish WaveARBUSDT is currently forming a bullish wave pattern, signaling a continuation of upward momentum after a period of accumulation. This setup often reflects strengthening buyer interest and growing confidence among investors. The market structure suggests that the pair could see a breakout, with projections pointing to potential gains of 30% to 40%+ in the coming sessions. The healthy trading volume further confirms strong participation and momentum support for this bullish outlook.
The consistent price movement within this wave formation highlights the potential for sustained upward growth. If ARBUSDT maintains its current pace and successfully breaks above key resistance levels, it could trigger a strong bullish rally. Traders should keep an eye on support and resistance zones to confirm the breakout and capitalize on possible price surges.
Investor sentiment toward ARBUSDT is also improving, with increasing participation and interest in the project. As more traders recognize the bullish technical structure and the possibility of strong returns, the pair is gaining traction as a favorable setup. With good volume and clear technical signals, ARBUSDT presents an attractive opportunity for those looking for mid-term upside potential.
✅ Show your support by hitting the like button and
✅ Leaving a comment below! (What is You opinion about this Coin)
Your feedback and engagement keep me inspired to share more insightful market analysis with you!

#ARB/USDT – Watching Key Support for Long Entry !#ARB
The price is moving within an ascending channel on the 1-hour frame, adhering well to it, and is on track to break it strongly upwards and retest it.
We have support from the lower boundary of the ascending channel, at 0.4880.
We have a downtrend on the RSI indicator that is about to break and retest, supporting the upside.
There is a major support area in green at 0.4800, which represents a strong basis for the upside.
Don't forget a simple thing: ease and capital.
When you reach the first target, save some money and then change your stop-loss order to an entry order.
For inquiries, please leave a comment.
We have a trend to hold above the 100 Moving Average.
Entry price: 0.4880.
First target: 0.5050.
Second target: 0.5327.
Third target: 0.5600.
Don't forget a simple thing: ease and capital.
When you reach the first target, save some money and then change your stop-loss order to an entry order.
For inquiries, please leave a comment.
Thank you.
#ARB/USDT – Watching Key Support for Long Entry !#ARB
The price is moving within a descending channel on the 1-hour frame and is expected to break and continue upward.
We have a trend to stabilize above the 100 moving average once again.
We have a downtrend on the RSI indicator that supports the upward move with a breakout.
We have a support area at the lower boundary of the channel at 0.4850, acting as strong support from which the price can rebound.
We have a major support area in green that pushed the price upward at 0.4740.
Entry price: 0.4890.
First target: 0.5100.
Second target: 0.5394.
Third target: 0.5737.
To manage risk, don't forget stop loss and capital management.
When you reach the first target, save some profits and then change the stop order to an entry order.
For inquiries, please comment.
Thank you.

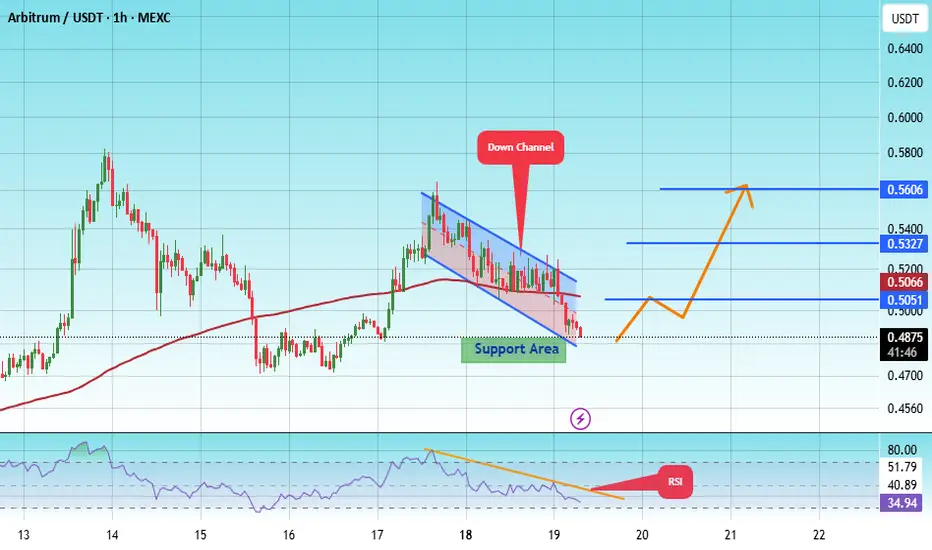
#ARB/USDT – Watching Key Support for Long Entry#ARB
The price is moving within an ascending channel on the 1-hour frame, adhering well to it, and is on track to break it strongly upwards and retest it.
We have support from the lower boundary of the ascending channel, at 0.4500.
We have a downtrend on the RSI indicator that is about to break and retest, supporting the upside.
There is a major support area in green at 0.4420, which represents a strong basis for the upside.
Don't forget a simple thing: ease and capital.
When you reach the first target, save some money and then change your stop-loss order to an entry order.
For inquiries, please leave a comment.
We have a trend to hold above the 100 Moving Average.
Entry price: 0.4580.
First target: 0.4650.
Second target: 0.4810.
Third target: 0.5000.
Don't forget a simple thing: ease and capital.
When you reach the first target, save some money and then change your stop-loss order to an entry order.
For inquiries, please leave a comment.
Thank you.
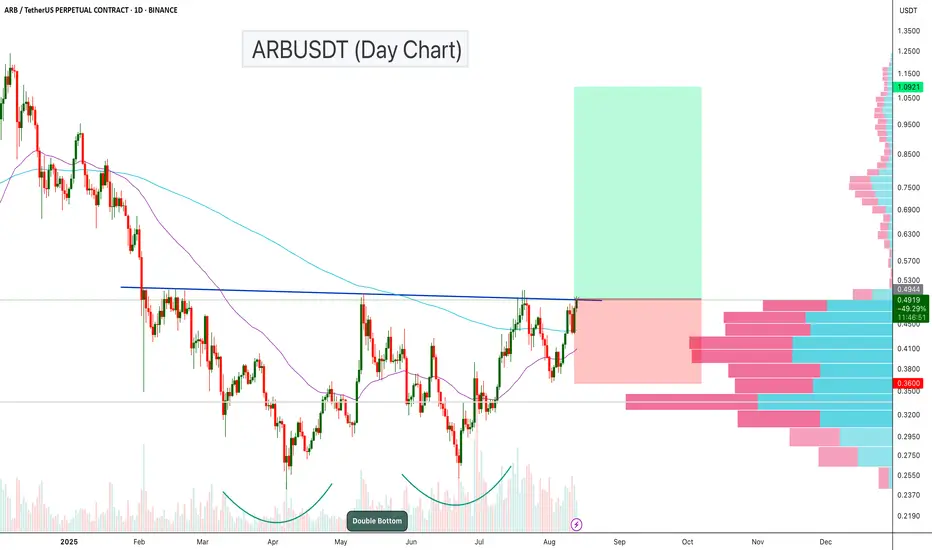
ARBUSDT – Double Bottom Breakout Loading?ARBUSDT is showing a strong bullish structure on the daily chart, with a classic Double Bottom pattern forming over the past few months. Price is now pressing against the neckline resistance, which, if broken, could trigger a powerful upside move.
Key Points:
Double Bottom Formation: The pattern started in April 2025 and completed its second bottom in July, indicating a potential long-term reversal setup.
Neckline Resistance: Price is currently testing the $0.49–$0.50 zone, which aligns with previous swing highs and marks the breakout level for the pattern.
Volume Profile: The visible range volume profile shows low-volume nodes above $0.50, suggesting a potential “thin air” move toward higher targets if the breakout is confirmed.
The chart is setting up for a potential trend reversal. A confirmed breakout from the double bottom neckline could propel ARBUSDT toward the $1+ zone
Cheers
Hexa
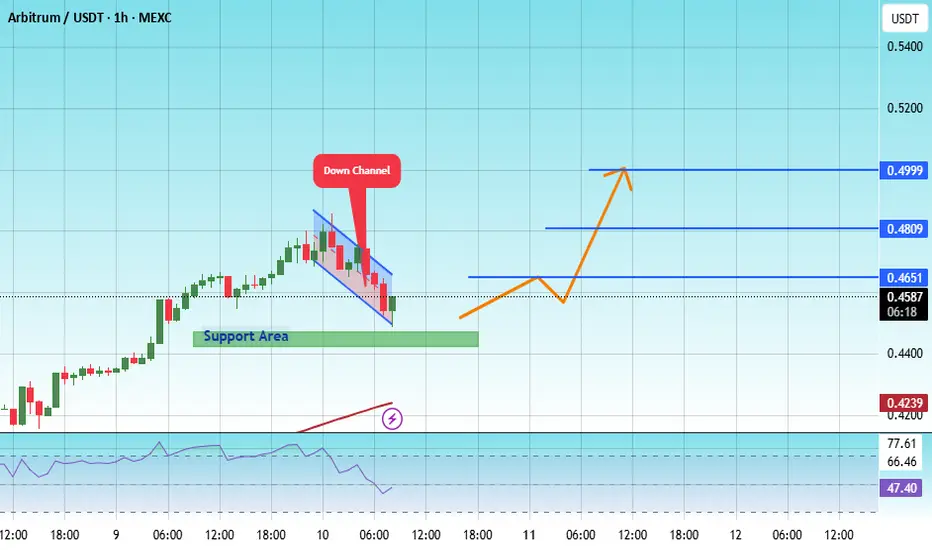
#ARB/USDT#ARB
The price is moving within a descending channel on the 1-hour frame, adhering well to it, and is on its way to breaking strongly upwards and retesting it.
We have support from the lower boundary of the descending channel, at 0.4550.
We have a downtrend on the RSI indicator that is about to be broken and retested, supporting the upside.
There is a major support area in green at 0.4520, which represents a strong basis for the upside.
Don't forget a simple thing: ease and capital.
When you reach the first target, save some money and then change your stop-loss order to an entry order.
For inquiries, please leave a comment.
We have a trend to hold above the 100 Moving Average.
Entry price: 0.4616
First target: 0.4751
Second target: 0.4923
Third target: 0.5135
Don't forget a simple thing: ease and capital.
When you reach the first target, save some money and then change your stop-loss order to an entry order.
For inquiries, please leave a comment.
Thank you.

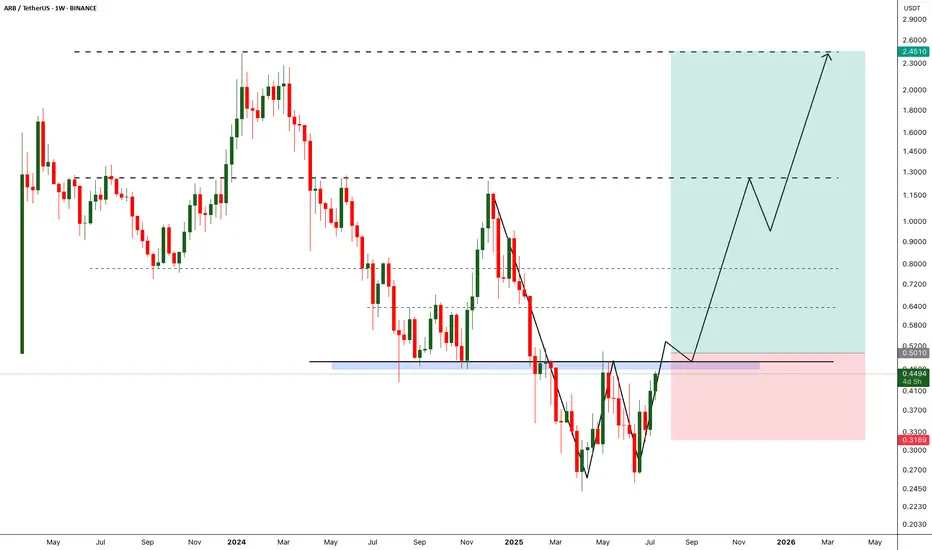
ARB - Breakout will break the market- Arbitrum is one of the fundamentally strong token on ETH L2.
- After back to back crashes finally we are seeing some reversal from the bottom
- A breakout from the local resistance would push the arb price further, we need to wait till the breakout to enter the trade.
Entry Price: 0.5010 (after breakout)
StopLoss: 0.3169
TP1: 0.6300
TP2: 0.7698
TP3: 1.2297
TP4: 1.7566
TP5: 2.3943
Max Leverage: 5x
Don't forget to keep stoploss
Cheers
GreenCrypto