#ARB/USDT | Testing Wedge Breakout Amid Key Support#ARB
The price is moving within a descending channel on the hourly timeframe. It has reached the lower boundary and is heading towards a breakout, with a retest of the upper boundary expected.
The Relative Strength Index (RSI) is showing a downward trend, approaching the lower boundary, and an upward bounce is anticipated.
There is a key support zone in green at 0.2100. The price has bounced from this level several times and is expected to bounce again.
The RSI is showing a trend towards consolidation above the 100-period moving average, which we are approaching, supporting the upward move.
Entry Price: 0.2130
First Target: 0.2157
Second Target: 0.2190
Third Target: 0.2234
Stop Loss: Below the green support zone.
Remember this simple thing: Money management.
For any questions, please leave a comment.
Thank you.
Arbitrage

#ARB/USDT#ARB
The price is moving within a descending channel on the hourly timeframe. It has reached the upper boundary and is trending downwards, with a retest of this boundary expected.
The Relative Strength Index (RSI) is showing an upward trend, approaching the upper boundary, and a downward reversal is anticipated.
There is a key resistance zone (in green) at 0.2250, and the price has bounced from this zone several times. Another bounce is expected.
The price is showing a consolidation pattern above the 100-period moving average, which we are approaching, supporting the possibility of a downward move towards it.
Entry Price: 0.2120
Target 1: 0.2017
Target 2: 0.1963
Target 3: 0.1887
Stop Loss: Above the green resistance zone.
Don't forget one simple thing: Money Management.
For inquiries, please leave a comment.
Thank you.

#ARB/USDT | Testing Wedge Breakout Amid Key Support#ARB
The price is moving in a descending channel on the 1-hour timeframe. It has reached the lower boundary and is heading towards a breakout, with a retest of the upper boundary expected.
We are seeing a bearish trend in the Relative Strength Index (RSI), which has reached near the lower boundary, and an upward bounce is expected.
There is a key support zone in green at 0.1840, and the price has bounced from this level several times. Another bounce is expected.
We are seeing a trend towards stabilizing above the 100-period moving average, which we are approaching, supporting the upward trend.
Entry Price: 0.1900
First Target: 0.1924
Second Target: 0.1958
Third Target: 0.1995
Remember a simple principle: Money Management.
Place your stop-loss order below the green support zone.
For any questions, please leave a comment.
Thank you.

#ARB/USDT | Testing Wedge Breakout Amid Key Support#ARB
The price is moving in a descending channel on the 1-hour timeframe. It has reached the lower boundary and is heading towards breaking above it, with a retest of the upper boundary expected.
We have a downtrend on the RSI indicator, which has reached near the lower boundary, and an upward rebound is expected.
There is a key support zone in green at 0.1850. The price has bounced from this zone multiple times and is expected to bounce again.
We have a trend towards consolidation above the 100-period moving average, as we are moving close to it, which supports the upward movement.
Entry price: 0.1900
First target: 0.1931
Second target: 0.1984
Third target: 0.2044
Don't forget a simple principle: money management.
Place your stop-loss order below the support zone in green.
For any questions, please leave a comment.
Thank you.

The 5 Types of Trading Bots Every Trader Should Know
Not All Trading Bots Are the Same - Some Amplify Your Edge, Some Amplify Your Pain
Saying "I want a bot" is like saying "I want a vehicle":
A Formula 1 car
A delivery truck
A scooter
A helicopter
All are vehicles. None are interchangeable.
In the era of AI‑assisted trading, bots are execution engines for your ideas. This post breaks down five major bot archetypes so you can stop hunting for "the best bot" and start matching the right structure to your market, risk profile, and skill set.
First Cold Truth: Bots Don't Create Edge — They Scale It
Before we talk types, it’s worth being brutally honest:
If your strategy has no edge, a bot just lets you lose money faster, more consistently, and with perfect discipline.
Bots are about discipline , speed , and scalability . The edge still has to come from your logic, testing, and risk framework.
Quick Map of the 5 Bot Types
Trend‑Following: Ride directional moves, ignore the noise.
Mean‑Reversion: Fade extremes, bet on snap‑backs.
Grid: Harvest volatility inside a range.
Signal‑Based: Turn ideas/alerts into consistent execution.
Arbitrage: Exploit price differences between related markets.
From here, you want to ask two things: What structure is the market in? and What structure is my brain comfortable with?
Type 1 – Trend‑Following Bots
These bots try to behave like a disciplined trend trader that never hesitates and never gets emotional.
Core idea: Buy strength in uptrends, sell weakness in downtrends.
Typical tools:
Moving‑average crossovers (fast vs slow)
Breakouts above recent highs or below recent lows
Momentum filters (e.g., ADX, rate of change, volatility filters)
Shine in: Clean, directional markets where pullbacks are shallow.
Struggle in: Sideways chop where price crosses the same levels repeatedly.
Main risk: A long sequence of small whipsaw losses when there is no real trend.
In the AI era, you can use models to classify regimes (trending vs ranging) and only let the trend bot run when the environment actually supports it.
//@version=6
indicator("Simple Trend Filter", overlay=true)
fast = ta.ema(close, 20)
slow = ta.ema(close, 50)
trendUp = fast > slow
trendDown = fast < slow
// Simple visual trend filter
plot(fast, color=color.teal)
plot(slow, color=color.orange)
bgcolor(trendUp ? color.new(color.teal, 90) : trendDown ? color.new(color.orange, 90) : na)
This kind of logic is usually just one piece of a full bot, but it shows how a trend‑following engine "sees" the market.
Type 2 – Mean‑Reversion Bots
Mean‑reversion bots assume that, most of the time, price doesn't drift off to infinity — it oscillates around some reference value.
Core idea: Fade overextended moves and bet on a return to the mean.
Typical tools:
RSI or Stochastic extremes ("overbought" / "oversold")
Touches or pierces of Bollinger Bands
Deviation from a moving average (z‑score, % distance)
Shine in: Ranging markets, stable channels, and mean‑reverting pairs.
Struggle in: Strong trends where "oversold" keeps getting more oversold.
Main risk: One big runaway move can erase many small wins if sizing and stops are not controlled.
These bots can feel smooth until they don't. AI can help here by measuring when volatility/range structure changes and cutting exposure before that "one big trend" shows up.
Type 3 – Grid Bots
Grid bots are volatility harvesters. They care less about direction and more about price oscillating through pre‑defined levels.
Core idea: Place a ladder of buy and sell orders above and below price.
Profit engine: As price bounces through the grid, the bot systematically buys lower, sells higher, and repeats.
Shine in: Sideways but active markets that revisit levels frequently.
Struggle in: Strong one‑way moves that blow through the grid and never mean‑revert.
Main risk: Deep, unrealized drawdowns if price trends hard against the grid without a safety mechanism.
Smart grid design in the AI era often includes:
Dynamic grid width that widens or tightens based on volatility
Max drawdown or margin‑usage limits that trigger a partial or full shutdown
Regime filters that turn the grid off when a strong trend is detected
Type 4 – Signal‑Based Bots
Signal bots don't "think" on their own – they are pure executors. Their job is to turn a human or model‑generated signal into consistent, rules‑based action.
Core idea: Separate idea generation from order execution .
Signal sources can include:
Multi‑indicator confluence (trend + volume + volatility)
Pattern recognition (breakouts, candle patterns, structures)
Order‑flow or whale‑tracking alerts
On‑chain, macro, or sentiment data for crypto and indices
Shine in: Any market where the underlying signal logic has been tested and proven.
Struggle in: Environments where the signal is over‑fitted, delayed, or not monitored.
Main risk: Blind faith in a black‑box signal without understanding its limits.
This is where AI often plugs in directly – models generate scores or labels, and the bot simply acts when the score crosses a threshold.
Type 5 – Arbitrage Bots
Arbitrage bots focus on relationships instead of single charts. They look for small, temporary mispricings and try to lock them in.
Core idea: Buy where something is cheap and sell where it's expensive, as close to simultaneously as possible.
Common approaches:
Same asset, different exchanges (spot vs spot or spot vs perp)
Triangular FX arbitrage between three currency pairs
Statistical arbitrage between correlated assets that have diverged
Shine in: Fragmented, less efficient markets with occasional big gaps.
Struggle in: Highly efficient markets where spreads and latency competition eat the edge.
Main risk: Execution risk – slippage, fees, and delays can flip a theoretical "risk‑free" trade into a losing one.
These are the most infrastructure‑heavy bots. Latency, connectivity, fee structure, and capital sizing matter as much as the model itself.
Choosing Your Bot in the AI Era
Instead of asking "Which bot makes the most?", ask:
What market structure am I actually trading most of the time?
How much drawdown and variance am I truly comfortable with?
Am I more aligned with riding trends or fading extremes?
What is my technical and infrastructure level right now?
Where can AI realistically help me – signal quality, risk controls, or execution?
AI can support you by:
Classifying regimes (trend vs range) and routing orders to the right bot type
Monitoring portfolio‑level risk across multiple bots and symbols
Detecting when performance degrades and suggesting parameter reviews
But the decision of which bot to run, when to turn it off, and how to size it is still your responsibility.
Your Turn
Which of these five bot types actually fits your temperament and the markets you trade right now?
If you had to upgrade one layer of your automation with AI today - signal generation, risk management, or execution - which one would move the needle the most for you?
Share it below. The clearer you are about what kind of bot you’re running and why , the less you’ll ever have to blame "the bot" when the outcome doesn’t match the plan.
#ARB/USDT | Testing Wedge Breakout Amid Key Support#ARB
The price is moving in a descending channel on the 1-hour timeframe. It has reached the lower boundary and is heading towards breaking above it, with a retest of the upper boundary expected.
We have a downtrend on the RSI indicator, which has reached near the lower boundary, and an upward rebound is expected.
There is a key support zone in green at 0.2000. The price has bounced from this level multiple times and is expected to bounce again.
We have a trend towards consolidation above the 100-period moving average, as we are moving close to it, which supports the upward movement.
Entry price: 0.2142
First target: 0.2170
Second target: 0.2219
Third target: 0.2280
Don't forget a simple principle: money management.
Place your stop-loss order below the support zone in green.
For any questions, please leave a comment.
Thank you.

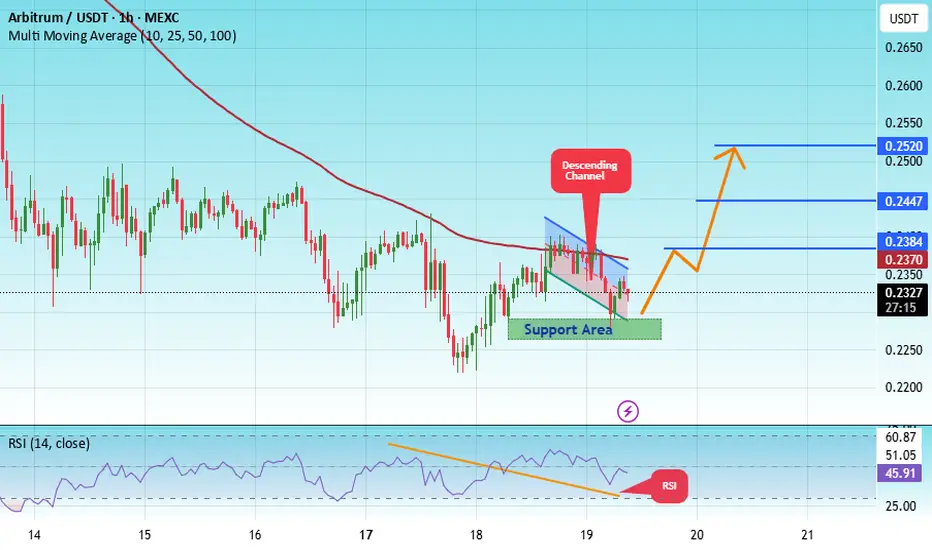
#ARB/USDT | Testing Wedge Breakout Amid Key Support#ARB
The price is moving within an ascending channel on the 1-hour timeframe and is adhering to it well. It is poised to break out strongly and retest the channel.
We have a downtrend line on the RSI indicator that is about to break and retest, which supports the upward move.
There is a key support zone in green at 0.2276, representing a strong support point.
We have a trend of consolidation above the 100-period moving average.
Entry price: 0.2318
First target: 0.2384
Second target: 0.2447
Third target: 0.2520
Don't forget a simple money management rule:
Place your stop-loss order below the green support zone.
Once you reach the first target, save some money and then change your stop-loss order to an entry order.
For any questions, please leave a comment.
Thank you.
#ARB/USDT — Last Line of Defense: Reversal Incoming or Breakdo#ARB
The price is moving within an ascending channel on the 1-hour timeframe and is adhering to it well. It is poised to break out strongly and retest the channel.
We have a downtrend line on the RSI indicator that is about to break and retest, which supports the upward move.
There is a key support zone in green at 0.2517, representing a strong support point.
We have a trend of consolidation above the 100-period moving average.
Entry price: 0.2619
First target: 0.2693
Second target: 0.2776
Third target: 0.2883
Don't forget a simple money management rule:
Place your stop-loss order below the green support zone.
Once you reach the first target, save some money and then change your stop-loss order to an entry order.
For any questions, please leave a comment.
Thank you.

#ARB/USDT#ARB
The price is moving within an ascending channel on the 1-hour frame, adhering well to it, and is heading for a strong breakout and retest.
We have a bearish trend on the RSI indicator that is about to be broken and retested, which supports the upward breakout.
There is a major support area in green at 0.3200, which represents a strong support point.
We are heading for stability above the 100 moving average.
Entry price: 0.3307
First target: 0.3363
Second target: 0.3470
Third target: 0.3618
Don't forget a simple matter: capital management.
When you reach the first target, save some money and then change your stop-loss order to an entry order.
For inquiries, please leave a comment.
Thank you.

The Future of Arbitrage OpportunitiesIntroduction
Arbitrage, the simultaneous purchase and sale of an asset across different markets to exploit price discrepancies, has been a cornerstone of financial markets for centuries. From the simple practice of buying commodities in one region and selling them in another to complex, high-frequency trading strategies, arbitrage has consistently provided risk-free or low-risk profit opportunities for investors. In today’s interconnected global markets, arbitrage not only fosters market efficiency but also drives liquidity and price convergence. However, the future of arbitrage is poised for a transformation due to technological advancements, regulatory changes, evolving market structures, and global economic shifts. Understanding these dynamics is critical for investors, traders, and policymakers alike.
Technological Innovations and Arbitrage
One of the most profound influences on the future of arbitrage will be technology. Over the past two decades, financial markets have undergone rapid digitization. High-frequency trading (HFT) and algorithmic trading have revolutionized how arbitrage opportunities are detected and exploited. Algorithms can now scan thousands of markets and instruments in milliseconds, executing trades with minimal latency.
1. Artificial Intelligence and Machine Learning:
Artificial intelligence (AI) is becoming a game-changer in identifying subtle and fleeting arbitrage opportunities that human traders may overlook. Machine learning models can analyze historical price data, trading volumes, and market sentiment to predict short-term discrepancies in asset prices. This predictive capability can enhance the precision and profitability of arbitrage strategies.
2. Blockchain and Decentralized Finance (DeFi):
The rise of blockchain technology and decentralized exchanges (DEXs) is creating new arbitrage frontiers. Price differences across multiple DEXs or between centralized and decentralized platforms can be exploited efficiently using smart contracts, which automatically execute trades based on pre-defined conditions. This automated, trustless mechanism reduces execution risk and lowers transaction costs.
3. Quantum Computing Potential:
Although still in its infancy, quantum computing promises to reshape arbitrage by solving complex optimization problems much faster than classical computers. Quantum algorithms could, in the future, analyze multi-market, multi-asset scenarios instantaneously, uncovering arbitrage opportunities that are currently invisible due to computational constraints.
Market Globalization and Arbitrage Opportunities
Globalization has increased the interconnectivity of markets, creating both challenges and opportunities for arbitrage. Cross-border trading in currencies, equities, commodities, and derivatives allows traders to exploit inefficiencies arising from differences in interest rates, inflation, and regulatory policies.
1. Currency Arbitrage in a Globalized Economy:
The proliferation of emerging markets and currency trading platforms has expanded the scope for triangular arbitrage, where discrepancies in exchange rates among three currencies are exploited. However, geopolitical tensions, trade wars, and differing monetary policies can introduce both risk and opportunity in global currency arbitrage.
2. Commodity and Energy Arbitrage:
Global trade integration allows arbitrage in commodities such as oil, gold, and agricultural products. Price differences due to regional supply-demand mismatches, transportation costs, and regulatory constraints can be leveraged for profit. The future will see more sophisticated arbitrage strategies utilizing real-time logistics data, satellite imagery for crop yield estimates, and predictive analytics for energy demand.
Regulatory Evolution and Its Impact
Regulation plays a critical role in shaping arbitrage opportunities. While arbitrage thrives on inefficiencies, excessive or inconsistent regulation can reduce market discrepancies. Regulatory bodies worldwide are increasingly monitoring high-frequency trading and algorithmic strategies to prevent market manipulation and systemic risks.
1. Stricter Compliance Requirements:
As financial markets mature, regulators are introducing stringent reporting standards, know-your-customer (KYC) rules, and anti-money laundering (AML) measures. These rules may limit certain types of arbitrage, especially in cross-border contexts, but can also create new niches where regulatory arbitrage—exploiting differences in legal frameworks—becomes possible.
2. Harmonization of Global Standards:
With initiatives like Basel III, MiFID II, and evolving Securities and Exchange Commission (SEC) rules, market standards are gradually converging. This reduces the scope for classic arbitrage between markets with vastly different regulations but encourages sophisticated strategies that adapt quickly to regulatory nuances.
The Role of Data and Analytics
Data is the new currency in modern finance. Arbitrage increasingly relies on real-time information and predictive analytics.
1. Big Data Analytics:
By leveraging big data from multiple sources, including news feeds, social media, and satellite data, traders can detect price anomalies faster and with greater accuracy. Big data tools can also simulate potential arbitrage scenarios under various market conditions, optimizing strategy execution.
2. Sentiment Analysis and Alternative Data:
Beyond traditional financial data, market sentiment derived from social media, news sentiment, and alternative data sources can be integrated into arbitrage models. For example, a sudden surge in social media activity about a stock can create short-lived mispricing between exchanges that sophisticated models can exploit.
3. Integration of IoT in Commodities and Supply Chains:
Internet of Things (IoT) devices in logistics, agriculture, and energy sectors allow real-time monitoring of supply and demand, providing actionable insights for arbitrage in physical markets. For instance, temperature sensors in agricultural storage can signal supply issues, creating short-term price deviations across regional markets.
Challenges and Risks
Despite technological and global advancements, the future of arbitrage is not without challenges.
1. Market Efficiency:
As technology improves and more traders employ arbitrage strategies, price discrepancies are quickly corrected. This heightened efficiency reduces the profitability of traditional arbitrage opportunities.
2. Competition and Overcrowding:
The proliferation of algorithmic and high-frequency trading firms has intensified competition, leading to “crowded trades” where multiple players exploit the same opportunity simultaneously, reducing profit margins.
3. Cybersecurity and Operational Risks:
With increased reliance on digital infrastructure, arbitrage is exposed to cybersecurity threats, system failures, and execution risks. A minor glitch in automated trading systems can result in significant financial losses.
4. Regulatory Risks:
Rapidly changing regulatory landscapes can render some arbitrage strategies illegal or highly risky, particularly in emerging markets with inconsistent enforcement. Traders must maintain agile compliance frameworks to mitigate these risks.
Emerging Trends in Arbitrage
The future will witness the evolution of new types of arbitrage beyond traditional financial markets.
1. Environmental and Carbon Credit Arbitrage:
With the rise of carbon markets and ESG investing, opportunities will emerge in trading carbon credits, renewable energy certificates, and green bonds. Price discrepancies between different environmental markets could become a fertile ground for arbitrage.
2. Cryptocurrency and Digital Asset Arbitrage:
Cryptocurrencies and tokenized assets offer unique opportunities for arbitrage, particularly across exchanges with varying liquidity, regulations, and operational efficiencies. Smart contract-enabled automated trading could make crypto arbitrage both scalable and efficient.
3. Statistical and AI-driven Arbitrage:
Pairs trading, index arbitrage, and other statistical strategies will evolve with AI and deep learning. These approaches can identify complex, non-linear relationships between assets that traditional models cannot capture.
The Strategic Outlook
The future of arbitrage is likely to be shaped by a combination of technology, market evolution, and regulatory oversight. Investors and institutions must adapt by:
Investing in advanced technological infrastructure to identify and execute opportunities faster.
Diversifying across markets and asset classes to exploit cross-market inefficiencies.
Incorporating ESG and alternative asset classes into arbitrage strategies to tap into emerging trends.
Adapting to regulatory changes dynamically to ensure compliance while maximizing strategic advantage.
In essence, the competitive edge in future arbitrage will lie in the ability to combine speed, intelligence, and adaptability. Traders who can integrate real-time data, AI-driven insights, and robust risk management frameworks will thrive in a world where traditional inefficiencies are increasingly rare.
Conclusion
Arbitrage will continue to be a fundamental component of financial markets, ensuring price alignment, liquidity, and market efficiency. However, the landscape is shifting rapidly due to technological advancements, globalization, and regulatory evolution. The future of arbitrage will increasingly favor those who can harness AI, blockchain, big data, and alternative markets while navigating competitive pressures and regulatory frameworks. While classic arbitrage opportunities may diminish as markets become more efficient, new opportunities will emerge in digital assets, environmental markets, and algorithmically driven strategies. Ultimately, the evolution of arbitrage reflects the broader trajectory of global finance: dynamic, technology-driven, and increasingly interconnected.
Arbitrage will remain not just a mechanism for profit but a lens through which the efficiency, resilience, and innovation of financial markets can be observed and leveraged. The future belongs to those who anticipate these shifts and adapt their strategies to an ever-changing financial ecosystem.

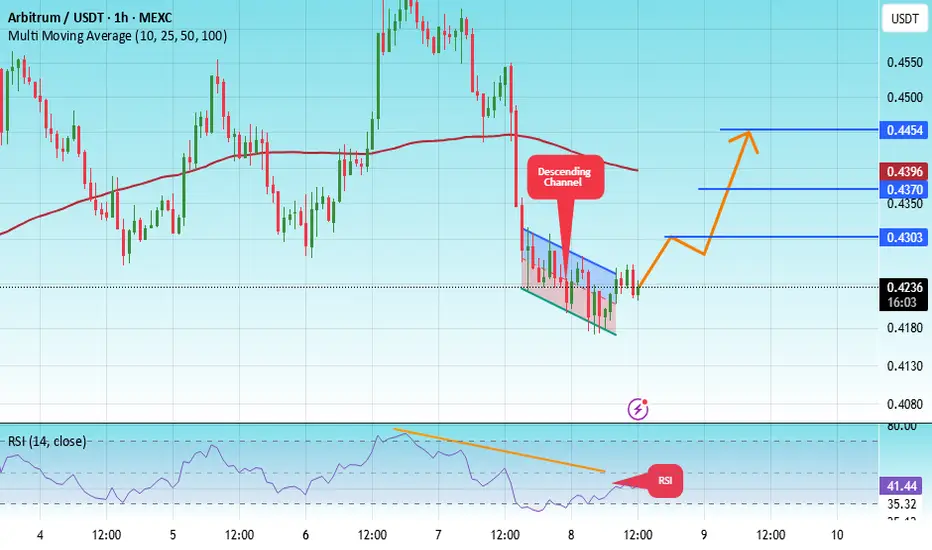
#ARB/USDT Analysis: Breakout Potential with Overbought RSI !#ARB
The price is moving within a descending channel on the 1-hour frame, adhering well to it, and is heading for a strong breakout and retest.
We have a bearish trend on the RSI indicator that is about to be broken and retested, which supports the upward breakout.
There is a major support area in green at 0.4180, which represents a strong support point.
We are heading for consolidation above the 100 moving average.
Entry price: 0.4229
First target: 0.4303
Second target: 0.4370
Third target: 0.4454
Don't forget a simple matter: capital management.
When you reach the first target, save some money and then change your stop-loss order to an entry order.
For inquiries, please leave a comment.
Thank you.
Global Arbitrage Opportunities: Across World ExchangesIntroduction: The Art of Earning from Market Inefficiencies
In the world of finance and trading, arbitrage is often considered the holy grail of risk-free profit-making. It is the art of exploiting price differences of the same asset across different markets or exchanges. Though it sounds simple, global arbitrage requires deep market knowledge, speed, technology, and capital efficiency. As world exchanges become increasingly connected through technology and globalization, arbitrage has evolved from manual calculations to high-frequency trading algorithms that identify even millisecond differences.
In 2025, as global markets face volatility, digitalization, and decentralization, arbitrage remains a powerful strategy for both institutional and individual investors. This article explores how arbitrage works across world exchanges, the types of arbitrage that exist, key global examples, and how traders can spot opportunities amid market inefficiencies.
1. Understanding Arbitrage in Global Markets
Arbitrage occurs when an asset—such as a stock, commodity, currency, or cryptocurrency—is priced differently across two or more markets. Traders simultaneously buy the asset where it’s undervalued and sell it where it’s overvalued, profiting from the price difference.
For example, suppose Apple Inc. (AAPL) trades at $180 on the NASDAQ and $181 on the London Stock Exchange (LSE). A trader could buy Apple shares on NASDAQ and sell them simultaneously on LSE, pocketing the $1 difference per share, excluding transaction costs.
This principle applies across stocks, commodities, currencies, derivatives, and digital assets—making global arbitrage a multidimensional opportunity.
2. The Foundation of Arbitrage: Market Inefficiency
The core of arbitrage lies in the concept of market inefficiency. In an ideal, perfectly efficient market, asset prices should reflect all available information simultaneously. However, due to differences in time zones, regulations, liquidity, exchange rates, and information flow, inefficiencies persist even today.
These inefficiencies give rise to price gaps that can be exploited for profit. High-frequency traders, hedge funds, and institutional investors deploy advanced algorithms that scan global markets in microseconds to identify such discrepancies.
Even with today’s high level of automation, inefficiencies cannot be completely eliminated—creating continuous arbitrage potential worldwide.
3. Major Types of Global Arbitrage Opportunities
Let’s explore the most common and profitable forms of arbitrage that occur across world exchanges:
a. Spatial Arbitrage (Inter-Exchange Arbitrage)
This is the most classic form—buying an asset in one market and selling it in another where the price differs.
Example: Buying gold futures on the London Metal Exchange (LME) and selling them at a higher price on COMEX (New York).
b. Triangular Arbitrage
A strategy used in foreign exchange (forex) markets, where discrepancies between three currency pairs allow traders to profit.
Example: Using USD, EUR, and GBP pairs to exploit minor rate mismatches across exchanges.
c. Statistical Arbitrage
This involves using quantitative models to identify mispriced securities based on historical correlations.
Example: If two global steel companies usually move in tandem, but one lags temporarily, a trader can long one and short the other expecting reversion.
d. Cross-Border Index Arbitrage
Global index futures—like the S&P 500, Nikkei 225, or FTSE 100—often trade differently on international exchanges. Traders exploit these pricing gaps between index futures and their underlying baskets.
e. Commodity Arbitrage
Differences in oil, gold, copper, or agricultural commodity prices across world exchanges (MCX India, CME US, LME UK) often create arbitrage windows due to supply-chain disruptions or currency fluctuations.
f. Crypto Arbitrage
With 24/7 trading and hundreds of exchanges, cryptocurrencies offer one of the richest fields for arbitrage. For instance, Bitcoin might trade at $62,300 on Binance and $62,450 on Coinbase, allowing instant profit.
g. Interest Rate Arbitrage (Covered Interest Arbitrage)
This involves borrowing in a low-interest-rate currency and investing in a higher-yielding currency, hedging the exchange rate risk through forward contracts.
4. Global Markets Where Arbitrage Flourishes
1. United States (NYSE, NASDAQ, CME)
The U.S. markets are highly liquid, making arbitrage opportunities smaller but more frequent.
Example: Arbitrage between S&P 500 futures on CME and ETFs like SPY on NYSE.
2. United Kingdom (LSE)
London’s time zone overlap with both Asia and the U.S. makes it ideal for intercontinental arbitrage. Traders exploit pricing differences in dual-listed companies such as Unilever or HSBC.
3. India (NSE, BSE, MCX)
The Indian exchanges often see arbitrage between cash and futures markets, and also between NSE and BSE due to liquidity differences.
Example: Buying Reliance shares on NSE and selling on BSE if there’s a small price gap.
4. Japan (TSE) and Hong Kong (HKEX)
Arbitrage between Japanese ADRs (listed in the U.S.) and their domestic listings is common. Similarly, the Shanghai-Hong Kong Stock Connect allows price discrepancies between mainland and Hong Kong shares (A-shares and H-shares).
5. Europe (Euronext, Deutsche Börse)
European markets see cross-border arbitrage due to multiple exchanges trading the same blue-chip stocks. For example, Shell Plc trades across several European exchanges.
6. Crypto Exchanges (Binance, Kraken, Coinbase, OKX)
Crypto exchanges are globally fragmented and unregulated compared to traditional markets. This creates consistent arbitrage windows—especially between fiat-to-crypto pairs.
5. Tools and Technology Driving Modern Arbitrage
Global arbitrage today is a technology-driven discipline. Traditional traders are being replaced or assisted by algorithms, bots, and AI-powered systems. Here’s what drives modern arbitrage:
a. Algorithmic Trading
High-frequency algorithms detect and execute trades within microseconds. These algorithms continuously compare prices across exchanges.
b. Cross-Exchange APIs
APIs allow traders to fetch real-time prices and execute simultaneous buy/sell orders across global platforms.
c. Artificial Intelligence & Machine Learning
AI models analyze historical correlations, volatility patterns, and market inefficiencies to predict potential arbitrage zones.
d. Blockchain & Smart Contracts
In crypto markets, smart contracts automate arbitrage transactions—reducing latency and ensuring immediate execution.
e. Cloud-Based Trading Infrastructure
Cloud servers ensure that traders are geographically closer (co-located) to global exchanges, minimizing network delays.
6. Challenges and Risks in Global Arbitrage
While arbitrage is theoretically risk-free, in practice, execution, regulation, and timing risks can eat into profits. Key challenges include:
1. Transaction Costs
Brokerage, taxes, and exchange fees can eliminate small price differences, making trades unprofitable.
2. Execution Delays
Even a few milliseconds of lag between buying and selling can result in losses if prices move unfavorably.
3. Liquidity Risk
Low-volume assets may not allow traders to exit quickly, causing slippage.
4. Exchange Rate Fluctuations
In cross-border trades, currency volatility can erode arbitrage gains.
5. Regulatory Barriers
Some countries restrict cross-border trading or capital movement, making arbitrage legally complex.
6. Competition
Institutional traders and high-frequency funds dominate arbitrage, leaving minimal room for manual traders.
7. Technology Failures
Glitches, internet outages, or API failures can disrupt trades and cause heavy losses.
7. Case Studies: Real-World Arbitrage Scenarios
Case 1: Gold Arbitrage Between London and New York
When gold prices on the London Bullion Market Association (LBMA) were slightly lower than those on the COMEX, traders shipped gold physically or used futures contracts to arbitrage the difference—making steady profits before logistical costs reduced margins.
Case 2: A-Share and H-Share Arbitrage (China)
Companies listed both on the Shanghai Stock Exchange (A-shares) and the Hong Kong Stock Exchange (H-shares) often show price gaps due to investor access restrictions. Institutional traders exploit this through arbitrage using the Stock Connect link.
Case 3: Bitcoin Arbitrage in 2021-2022
During crypto bull markets, Bitcoin often traded at a “premium” in South Korea (the “Kimchi Premium”) compared to global averages. Arbitrageurs moved BTC from U.S. or Japanese exchanges to Korean exchanges for instant gains.
Case 4: ETF and Futures Arbitrage
During high volatility, index futures may deviate from their underlying ETF prices. Arbitrageurs buy the cheaper and sell the expensive instrument until prices converge.
8. The Future of Global Arbitrage: Trends for 2025 and Beyond
As the financial world moves deeper into digitalization, arbitrage is becoming more complex, global, and data-driven. Some emerging trends include:
1. AI-Enhanced Arbitrage
AI algorithms now learn from historical inefficiencies and predict arbitrage windows across correlated assets.
2. Tokenized Assets
With real-world assets being tokenized on blockchain, arbitrage between traditional and digital markets will rise.
3. Multi-Asset Arbitrage
Cross-market opportunities involving stocks, commodities, forex, and crypto will create new strategies.
4. Decentralized Exchanges (DEXs)
On-chain arbitrage between DEXs and centralized exchanges (CEXs) will continue to expand, especially in DeFi ecosystems.
5. Regulatory Harmonization
Efforts by global regulators to integrate financial systems (e.g., Basel norms, MiFID II) may reduce inefficiencies but also make legal cross-border arbitrage safer.
6. Quantum Computing
Quantum algorithms could soon revolutionize arbitrage by processing millions of correlations simultaneously—making inefficiencies vanish almost instantly.
9. How Individual Traders Can Find Arbitrage Opportunities
While institutional players dominate, retail traders can still benefit by focusing on specific niches:
Track price spreads between NSE and BSE for dual-listed stocks.
Monitor crypto exchanges for real-time differences using bots.
Use broker data APIs to automate alerts for arbitrage opportunities.
Combine forex and commodity arbitrage strategies using multi-asset platforms.
Participate in ETF arbitrage where price gaps persist during volatile periods.
With proper tools, discipline, and low transaction costs, individual traders can still find small but consistent profits.
10. Conclusion: Arbitrage—The Silent Engine of Global Market Efficiency
Arbitrage is not just about profit—it plays a vital role in maintaining market balance and price efficiency. By exploiting inefficiencies, arbitrageurs help ensure that identical assets trade at consistent prices worldwide.
In 2025, global arbitrage has evolved into a sophisticated, technology-powered discipline spanning traditional finance, commodities, and digital assets. Despite tighter spreads and fierce competition, opportunities persist for those who understand global linkages, act swiftly, and leverage automation.
In essence, arbitrage is where intelligence meets precision—a strategy that proves markets may be efficient, but never perfectly so.
#ARB/USDT (ARB): Looking For Buy Entry | 2 Zones To Keep an Ey#ARB
The price is moving within a descending channel on the 1-hour frame, adhering well to it, and heading for a strong breakout and retest.
We have a bearish trend on the RSI indicator that is about to be broken and retested, which supports the upward breakout.
There is a major support area in green at 0.4140, which represents a strong support point.
We are heading for consolidation above the 100 moving average.
Entry price: 0.4160
First target: 0.4215
Second target: 0.4264
Third target: 0.4325
Don't forget a simple matter: capital management.
When you reach the first target, save some money and then change your stop-loss order to an entry order.
For inquiries, please leave a comment.
Thank you.

BUY AND HOLDHello friends
Given the price reaching the bottom and the floor that this currency has made, we can expect its price to grow because the buyers at the bottom pushed the price up and now we are in a correction, which is a good opportunity to buy with capital and risk management and in steps and move with it to the specified goals.
Note that the holding period is at least 3 months, so be patient and observe capital management.
*Trade safely with us*

#ARB/USDT (ARB): Strong Liquidity Grab | Expecting Quick Recov#ARB
The price is moving within a descending channel on the 1-hour frame, adhering well to it, and is heading for a strong breakout and retest.
We have a bearish trend on the RSI indicator that is about to be broken and retested, which supports the upward breakout.
There is a major support area in green at 0.4200, which represents a strong support point.
We are heading for stability above the 100 moving average.
Entry price: 0.4400
First target: 0.4490
Second target: 0.4590
Third target: 0.4720
Don't forget a simple matter: capital management.
When you reach the first target, save some money and then change your stop-loss order to an entry order.
For inquiries, please leave a comment.
Thank you.
#ARB/USDT | TON Testing Wedge Breakout Amid Key Support#ARB
The price is moving in a descending channel on the 1-hour frame and is expected to break and continue upward.
We have a trend to stabilize above the 100 moving average once again.
We have a downtrend on the RSI indicator that supports the upward move with a breakout.
We have a major support area in green that pushed the price higher at 0.4858.
Entry price: 0.4940.
First target: 0.5076.
Second target: 0.5213.
Third target: 0.5390.
To manage risk, don't forget stop loss and capital management.
When you reach the first target, save some profits and then change the stop order to an entry order.
For inquiries, please comment.
Thank you.
Sprott Copper COP.UN discount NAV coming inDuring last few weeks the discount on NAV for COP.UN , current discount around 17%
Further upsie possible. Short term trend is up above the blue support line. So still buying possibilities for real copper with a great discount!
Price chart; cop.un against copper LME spread chart on 1 hour chart.

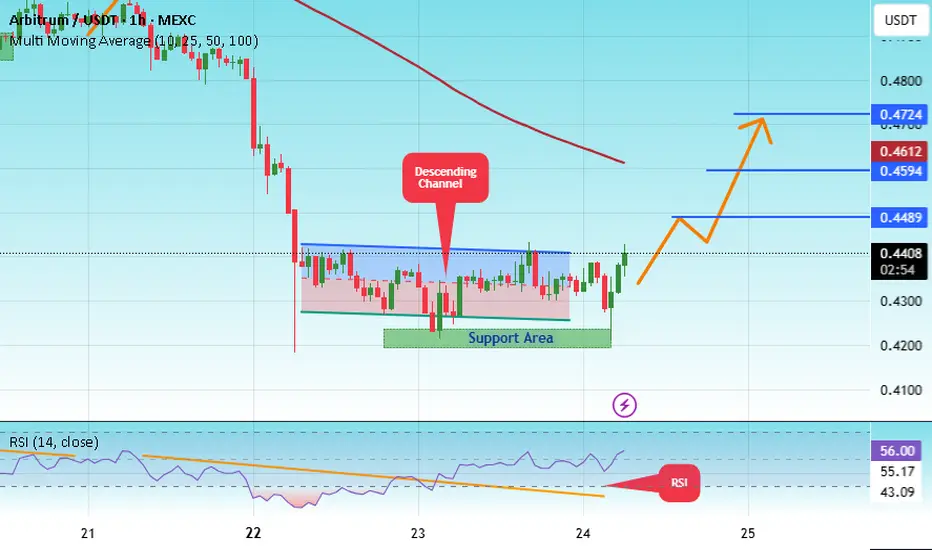
#ARB/USDT Pro | ARB Set for Pump After Pullback to Support#ARB
The price is moving within a descending channel on the 1-hour frame, adhering well to it, and is heading for a strong breakout and retest.
We have a bearish trend on the RSI indicator that is about to be broken and retested, which supports the upward breakout.
There is a major support area in green at 0.4890, which represents a strong support point.
For inquiries, please leave a comment.
We are in a consolidation trend above the 100 moving average.
Entry price: 0.4942
First target: 0.5085
Second target: 0.5216
Third target: 0.5400
Don't forget a simple matter: capital management.
When you reach the first target, save some money and then change your stop-loss order to an entry order.
For inquiries, please leave a comment.
Thank you.

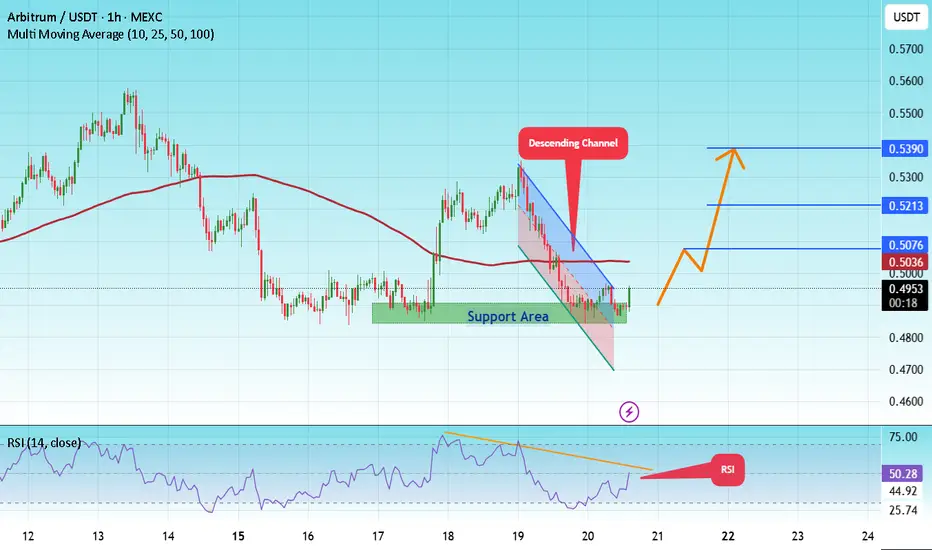
#ARB/USDT | ARB Set for Pump After Pullback to Support#ARB
The price is moving within a descending channel on the 1-hour frame, adhering well to it, and is heading for a strong breakout and retest.
We have a bearish trend on the RSI indicator that is about to be broken and retested, which supports the upward breakout.
There is a major support area in green at 0.4950, which represents a strong support point.
For inquiries, please leave a comment.
We are in a consolidation trend above the 100 moving average.
Entry price: 0.5083
First target: 0.5158
Second target: 0.5262
Third target: 0.5388
Don't forget a simple matter: capital management.
When you reach the first target, save some money and then change your stop-loss order to an entry order.
For inquiries, please leave a comment.
Thank you.

#ARB/USDT possible resistance/support flip happening#ARB
The price is moving within a descending channel on the 1-hour frame and is expected to break and continue upward.
We have a trend to stabilize above the 100 Moving Average once again.
We have a bearish trend on the RSI indicator, supporting the upward break.
We have a support area at the lower boundary of the channel at 0.4900, acting as strong support from which the price can rebound.
We have a major support area in green that pushed the price upward at 0.4860.
Entry price: 0.4940.
First target: 0.5008.
Second target: 0.5085.
Third target: 0.5180.
To manage risk, don't forget stop loss and capital management.
When you reach the first target, save some profits and then change your stop order to an entry order.
For inquiries, please comment.
Thank you.

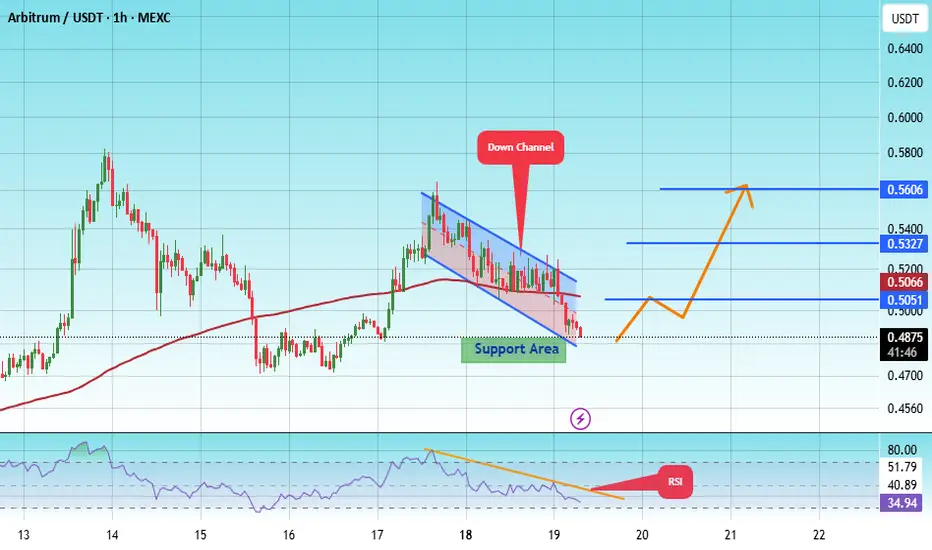
#ARB/USDT – Watching Key Support for Long Entry !#ARB
The price is moving within an ascending channel on the 1-hour frame, adhering well to it, and is on track to break it strongly upwards and retest it.
We have support from the lower boundary of the ascending channel, at 0.4880.
We have a downtrend on the RSI indicator that is about to break and retest, supporting the upside.
There is a major support area in green at 0.4800, which represents a strong basis for the upside.
Don't forget a simple thing: ease and capital.
When you reach the first target, save some money and then change your stop-loss order to an entry order.
For inquiries, please leave a comment.
We have a trend to hold above the 100 Moving Average.
Entry price: 0.4880.
First target: 0.5050.
Second target: 0.5327.
Third target: 0.5600.
Don't forget a simple thing: ease and capital.
When you reach the first target, save some money and then change your stop-loss order to an entry order.
For inquiries, please leave a comment.
Thank you.
#ARB/USDT – Watching Key Support for Long Entry !#ARB
The price is moving within a descending channel on the 1-hour frame and is expected to break and continue upward.
We have a trend to stabilize above the 100 moving average once again.
We have a downtrend on the RSI indicator that supports the upward move with a breakout.
We have a support area at the lower boundary of the channel at 0.4850, acting as strong support from which the price can rebound.
We have a major support area in green that pushed the price upward at 0.4740.
Entry price: 0.4890.
First target: 0.5100.
Second target: 0.5394.
Third target: 0.5737.
To manage risk, don't forget stop loss and capital management.
When you reach the first target, save some profits and then change the stop order to an entry order.
For inquiries, please comment.
Thank you.

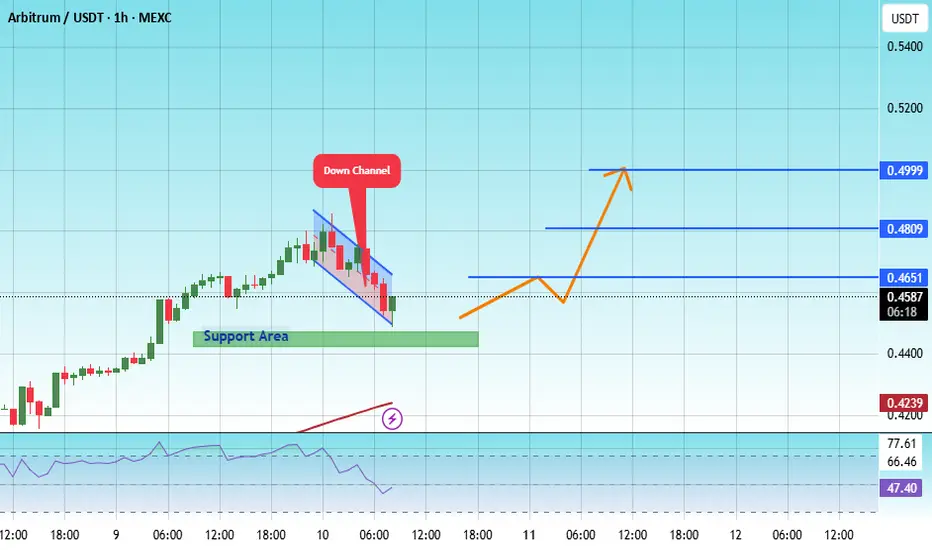
#ARB/USDT – Watching Key Support for Long Entry#ARB
The price is moving within an ascending channel on the 1-hour frame, adhering well to it, and is on track to break it strongly upwards and retest it.
We have support from the lower boundary of the ascending channel, at 0.4500.
We have a downtrend on the RSI indicator that is about to break and retest, supporting the upside.
There is a major support area in green at 0.4420, which represents a strong basis for the upside.
Don't forget a simple thing: ease and capital.
When you reach the first target, save some money and then change your stop-loss order to an entry order.
For inquiries, please leave a comment.
We have a trend to hold above the 100 Moving Average.
Entry price: 0.4580.
First target: 0.4650.
Second target: 0.4810.
Third target: 0.5000.
Don't forget a simple thing: ease and capital.
When you reach the first target, save some money and then change your stop-loss order to an entry order.
For inquiries, please leave a comment.
Thank you.