TradeCityPro | ARBUSDT Easiest Short Trigger!👋 Welcome to TradeCityPro Channel!
Let’s go for the analysis of Arbitrum (ARB/USDT), one of the favorite coins among airdrop hunters with great memories, and still one of the most popular DeFi tokens.
🌐 Overview of Bitcoin
Before starting the analysis, let me remind you again that we moved the Bitcoin analysis section out of this part and made it a separate daily analysis as per your request, so we can discuss Bitcoin’s condition in more detail and analyze its charts and dominance separately.
This is the general Bitcoin dominance analysis that we promised to cover separately and analyze in longer time frames:
📈 On the 4H timeframe, ARB experienced a strong bullish wave. After breaking 0.4059 and moving out of the range box (0.36–0.40), it had a sharp rally reaching 0.6146.
❌ After rejection from this key weekly resistance, ARB formed a lower high and sharply corrected, eventually breaking below a resistance trendline.
📉 It has now reached the strong support at 0.4738, which also aligns with the 50% Fibonacci retracement level. According to Dow theory, the 50% level is also a very critical area, making this point an important PRZ (Potential Reversal Zone).
✅ For long positions: It’s still a bit early. With a trendline breakout you could attempt something, but personally, I’d wait for a higher high and higher low structure before going long.
⚠️ For short positions: The setup is much clearer. After breaking below 0.4738, we can open a short position targeting 0.4358, while keeping risk management in mind for opening positions.
📝 Final Thoughts
Stay calm, trade wisely, and let's capture the market's best opportunities!
This analysis reflects our opinions and is not financial advice.
Share your thoughts in the comments, and don’t forget to share this analysis with your friends! ❤️
Arbitrum

Can ARB get $1 back?!Hey there! It looks like the BINANCE:ARBUSDT token, which powers the Arbitrum blockchain, is getting ready for a big move. It's showing some strong bullish momentum, and we might see it climb past the $1 mark soon. This is happening at a great time, as the overall crypto market has been on a tear lately. Just look at how well Ethereum and other top coins have performed—it seems ARB is following a similar path.
⛔"Daily crypto market analyses I provide are personal opinions & not financial advice. Trading carries risks, so do your own research & seek advisor's help. #DYOR
LongBreaking the 203-day resistance with a double pattern in the medium term of the specified target is not out of mind

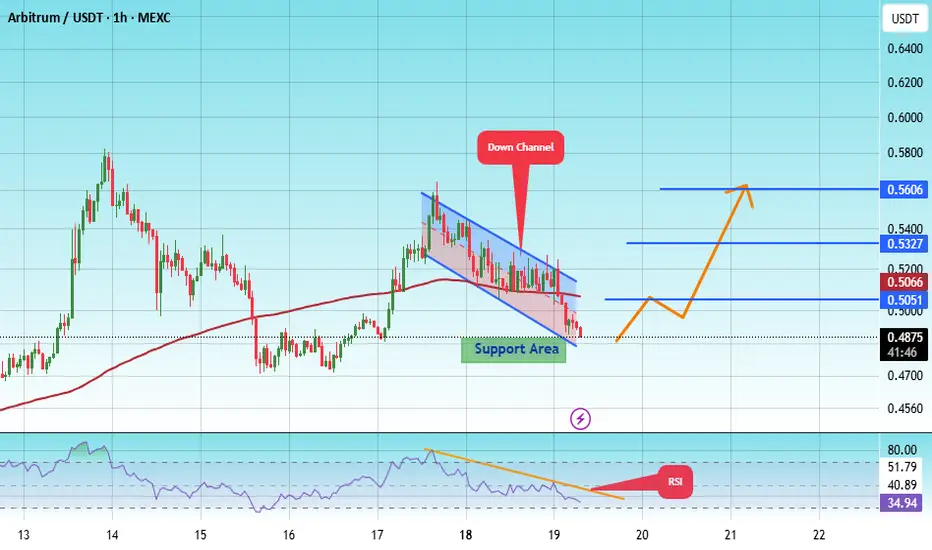
#ARB/USDT – Watching Key Support for Long Entry !#ARB
The price is moving within an ascending channel on the 1-hour frame, adhering well to it, and is on track to break it strongly upwards and retest it.
We have support from the lower boundary of the ascending channel, at 0.4880.
We have a downtrend on the RSI indicator that is about to break and retest, supporting the upside.
There is a major support area in green at 0.4800, which represents a strong basis for the upside.
Don't forget a simple thing: ease and capital.
When you reach the first target, save some money and then change your stop-loss order to an entry order.
For inquiries, please leave a comment.
We have a trend to hold above the 100 Moving Average.
Entry price: 0.4880.
First target: 0.5050.
Second target: 0.5327.
Third target: 0.5600.
Don't forget a simple thing: ease and capital.
When you reach the first target, save some money and then change your stop-loss order to an entry order.
For inquiries, please leave a comment.
Thank you.
Arbitrum ready for the double bottom breakout?It’s already broken above the neckline recently then dipped back below so another dip back below is certainly possible, however after the recent bullish sentiment from Jackson Hole, I think probability favors the breakout getting confirmed in the very near future. *not financial advice*
Arbitrum is getting better... Everything is about to speed up!ARB has been rising since the 16-July week, for 63 days. This is after the higher low. Since 7-April, we have a total of 133 days. With each passing day, the action comes closer to resistance. With each passing day, trading volume continues to rise on the bullish side. Just last week ARBUSDT produced the highest buy-volume since April 2023, more than two years ago.
Going deeper, you can see the big purple descending channel. Current action is happening within this channel and this can be considered bearish, but this is only if you are looking at the entire market from the perspective of this channel.
See a different perspective here:
Here we have a downtrend and when 7-April comes, the new all-time low, bearish volume is not present. The same day the all-time low was hit the session ended green. Prices start to move higher and volume starts to rise.
The action starts to move above multiple long-term moving averages and we get a strong RSI.
Finally, marketwide action and related projects will reveal the last piece of the puzzle. Ether hits a new all-time high, Bitcoin continues to do great, many altcoins are trading at multiple years high and yet had a chart that was almost the same to this, when it comes to the highs and lows.
Since the bottom is already in, we can expect long-term growth.
Arbitrum is already going up, it has been doing it for months. The good news is that everything is about to speed up.
Namaste.
Arbitrum Structural Bull Unfolding Amid Ethereum ETF Surge 🚀📊 Arbitrum Structural Bull Unfolding Amid Ethereum ETF Surge 🌐🔥
🏦 Institutional Tidal Wave – Ethereum ETF Inflows Surge
Spot Ethereum ETFs have minted over $7.7 billion in net inflows, with more than $533 million coming in on a single day—a new record level of institutional capital deployment
Analysts estimate $50–100B more capital is set to flow into ETH over the next 12–18 months, fueling long-duration structural demand beyond speculators
ETF inflows are now collectively absorbing more ETH than new issuance, tightening supply dynamics and driving pricing power
🌉 Why ARB Is Positioned to Capitalize
Arbitrum TVL exceeds $2.5B, with network activity up more than 90% since spring. ⚙️ ARB’s price surged ~91% from April lows, though $0.50 remains critical resistance
Stablecoin supply on Arbitrum hit an all-time high in July , highlighting real use-case growth and on-chain USD demand
Robinhood launched tokenized U.S. stock trading on Arbitrum— a major milestone showing enterprise-level trust and integration
📈 Network Fundamentals & Technical Drivers
The In-kind ETF ruling link s real ETH custody to TradFi flows —Arbitrum sits directly in that fast lane as a scaling infrastructure ﹘ this isn’t theory, it's architectural necessity.
Recent academic research shows that optimistic MEV (arbitrage probing) constitutes over 50% of L2 gas consumption on Base/OP, though only ~7% on Arbitrum —suggesting steadier, lower-waste gas dynamics and room for growth in blockspace usage
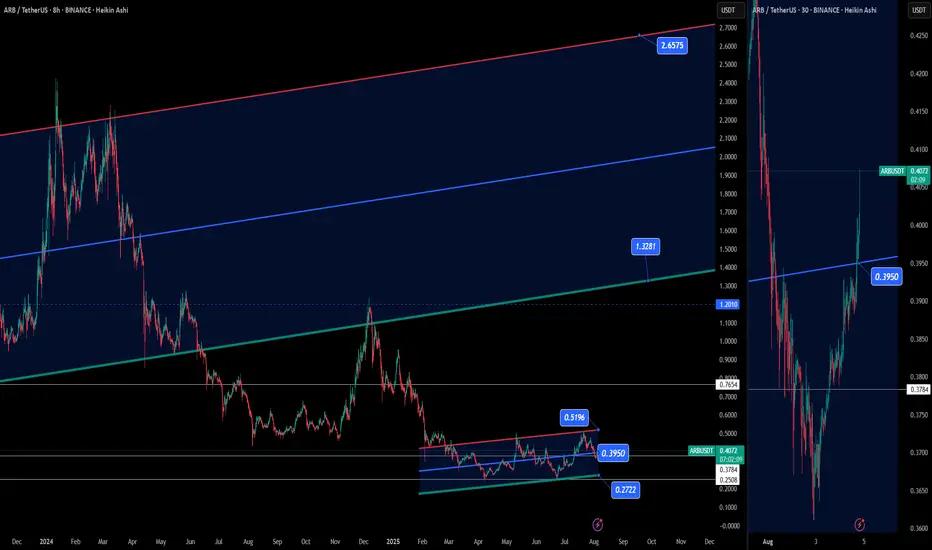
🔧 Chart Structure – ARBUSDT (8H & 30m)
Horizontal support around $0.3950 held, while resistance at $0.5196 defines the upper micro‑range. Holding above support suggests buyers are stepping in.
Macro channel structure points toward $1.33 (mid-channel) and $2.66 (upper channel) as multi-month targets—now in play if resistance breaks
30-minute consolidation turned into a textbook breakout— volume picked up above $0.3950, reinforcing the resumption of bullish momentum.
🧠 Risk & Narrative Considerations
Vote-buying incidents in the Arbitrum DAO raised questions about governance integrity—though these were isolated and transparently addressed
A $140K exploit via signature bypass in March highlights the need for continued security evolution—though the protocol responded promptly
On-chain data shows user churn remains an obstacle—some studies find 80% of users quit blockchains within 90 days. Retention is the next frontier for L2 credibility
✅ Trade Setup Recap
📌 Entry zone: Hold above $0.3950, target initial breakout to $0.5196; next extensions toward $1.33 / $2.66.
📌 Catalysts: ETF capital flow, TradFi infrastructure demand, tokenized stock settlement, stablecoin adoption, and developer activity.
📌 Metrics watching: Futures open interest, DAO participation, new dApp deployment, stablecoin inflows.
🧵 Narrative Summary:
Arbitrum is sitting at the intersection of scaling demand, institutional capital landing in Ethereum, and real-world utility use cases. The current structure—which includes firm technical support, active protocol adoption, and ETF-induced capital flows—sets it apart from altcoin speculation cycles.
If ARB can close convincingly above $0.52, expect the macro expansion phase to begin.
Stay sharp. Structure > Noise.
One 💙 Love,
The FX PROFESSOR
Disclosure: I am happy to be part of the Trade Nation's Influencer program and receive a monthly fee for using their TradingView charts in my analysis. Awesome broker, where the trader really comes first! 🌟🤝📈
ARB/USDT — Golden Pocket Re-Test: Big Momentum Ahead?🔎 Chart Overview
ARB/USDT (2D - OKX) is now at a critical decision point. The price is currently testing the Golden Pocket Fibonacci 0.5–0.618 (0.445–0.475 USDT), which also aligns with a Support-Resistance Flip (S/R Flip) from previous structure.
This area is not just another technical level; it’s the “battlefield” that will define whether ARB enters a new bullish trend or slips back into a deeper correction.
---
📈 Bullish Scenario (Trend Continuation)
If ARB can close above 0.495–0.505 (2D candle confirmation), the Golden Pocket re-test will be validated. This could trigger a progressive bullish wave with targets as follows:
1️⃣ 0.6266 → first resistance checkpoint
2️⃣ 0.7148 → key psychological + structural resistance
3️⃣ 0.8500 → mid-range target
4️⃣ 0.9197 → prior supply zone
5️⃣ 1.0317 → strong historical resistance
6️⃣ 1.1695–1.2392 → major supply zone / previous swing high
👉 If this scenario plays out, we could see +20% to +120% upside from current levels.
---
📉 Bearish Scenario (Failed Re-Test)
On the flip side, if ARB fails to hold above 0.445, the Golden Pocket will flip into a strong sell zone. That could send the price into deeper levels:
0.420 → immediate minor support
0.360 → important support floor
0.310 → old consolidation base
0.260 – 0.2420 → extreme demand zone & structural low
👉 This scenario would expose ARB to a potential -30% to -50% downside.
---
🌀 Structure & Pattern Insight
Accumulation Signs: Since June 2025, ARB has been forming Higher Lows, hinting at steady accumulation.
Supply Test: Repeated rejection above 0.50 shows sellers are still defending this level.
Golden Pocket (0.445–0.475) → the ultimate battleground for buyers vs. sellers.
---
🎯 Key Takeaway
Above 0.475–0.495 = Bullish Bias → targets 0.6266, 0.7148, and beyond.
Below 0.445 = Bearish Bias → targets 0.42, 0.36, even 0.26–0.24.
In other words, this Golden Pocket will act as the gateway to ARB’s next big trend.
---
📝 Final Notes
Wait for 2D/1W closes to avoid false breakouts.
Manage risk wisely → this area is prone to liquidity grabs & fake-outs.
Whichever side wins this zone, momentum could be explosive.
#ARB #Arbitrum #ARBUSDT #CryptoAnalysis #PriceAction #GoldenPocket #SupportResistance #Fibonacci #CryptoTrading

#ARB/USDT – Watching Key Support for Long Entry !#ARB
The price is moving within a descending channel on the 1-hour frame and is expected to break and continue upward.
We have a trend to stabilize above the 100 moving average once again.
We have a downtrend on the RSI indicator that supports the upward move with a breakout.
We have a support area at the lower boundary of the channel at 0.4850, acting as strong support from which the price can rebound.
We have a major support area in green that pushed the price upward at 0.4740.
Entry price: 0.4890.
First target: 0.5100.
Second target: 0.5394.
Third target: 0.5737.
To manage risk, don't forget stop loss and capital management.
When you reach the first target, save some profits and then change the stop order to an entry order.
For inquiries, please comment.
Thank you.

ARB Main Trend 24 04 2025Logarithm. Time frame 1 week.
Previously a very hyped coin, "killer" of something there...
Now - the dominant opinion is that this is a scam, a scam, "whales are selling now", and so on. It's funny to look at all this and how the opinion changes with the price. Crypto is a mess, there are no other words... That is, now is the time to take a closer look at the asset, and the start of the set.
If the price drops to lower values (shown on the chart), from the position of the trend, and potential percentages of the pump, the price is now acceptable, and the profit will be significant, but not "hamster". Set adequate goals, fix in parts as the trend develops, protect your profit. When there is an aggressive pump "with a stick", by a large %, - completely exit the asset, or protect the profit with a stop.
There is a small probability that an asset of such capitalization, and the unrealization of "buy a candy wrapper", will be knocked down in advance before the full 3rd alt season of this cycle, without distributing "prospects" on the "revival of faith".
⚠️ Now the decline from the maximum is -90% . For assets of such liquidity, these are not the lowest values, but perhaps the previous hype played a role in this. Work from the average price, or on a breakthrough and you will not care when the reversal occurs. The main thing is to distribute the entry and exit points after the purchase in advance, that is, distribute the risk and profit. And, after that, no longer be interested in the asset, or opinions, or fictitious positive / negative news to stimulate demand / supply of "stupid money". Do not get stuck in market noise and unnecessary opinions driven by fear or greed.
1️⃣ If this zone of minimums is held — for starters, the potential for a downward trend of the secondary trend (shown with a red line).
2️⃣ Then, when it is broken , — to the channel median (green dotted line).
🟣Local trend At the moment, a wedge-shaped formation has formed in it, there is an attempt to break through it and the price is clamped.

ARB Secondary trend. 24 04 2025Logarithm. Time frame 3 days (less is not necessary).
⚠️ Currently a decline from the maximum of -90% . For assets of such liquidity, these are not the lowest values, but perhaps the previous hype played a role in this. Work from the average price, or on a breakout , and you will not care when the reversal occurs. The main thing is to distribute the entry and exit points after the purchase in advance, that is, distribute the risk and profit. And, after that, no longer be interested in the asset, or opinions, or fictitious positive / negative news to stimulate demand / supply of “stupid money”. Do not get stuck in market noise and unnecessary, fear-driven or greed-driven opinions.
Main trend (the entire history of cryptocurrency trading), for clarity of pricing and the zone for work now, which is discussed.
ARB Main Trend 24 04 2025
🟣 Local trend. At the moment, a wedge-shaped formation has formed in it, there is an attempt to break through it and the price is clamped.
1️⃣ If this zone of minimums is held — for a start, the potential for a downward trend of the secondary trend (shown with a red line).
2️⃣ Then, when it is broken through , — to the channel median (green dotted line).

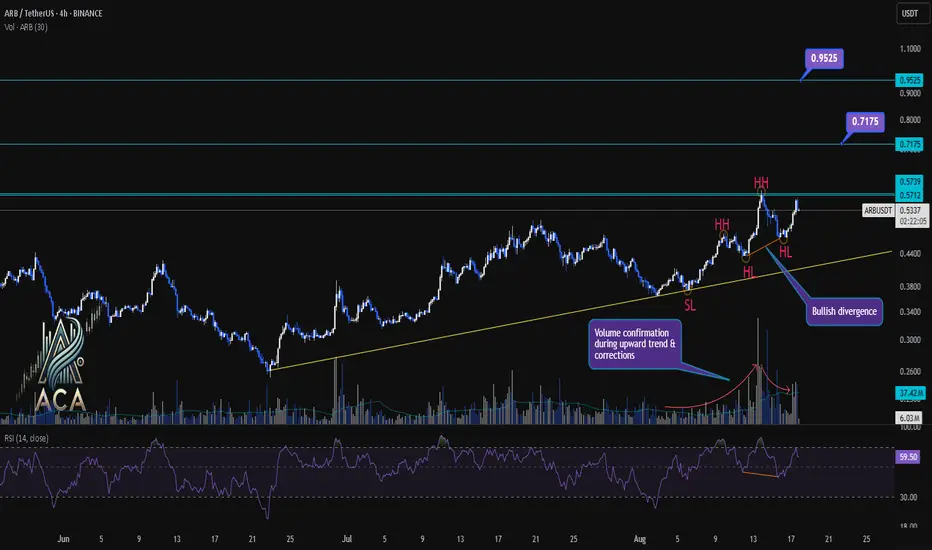
ARBUSDT 4H Chart Analysis | Trendline Integrity & Key TargetsARBUSDT 4H Chart Analysis | Trendline Integrity, Volume, Divergence & Key Targets
🔍 Let’s break down ARBUSDT on the 4-hour chart, spotlighting trend structure, swing plays, volume signatures, and momentum for precise trading setups.
⏳ 4H Overview
The chart shows ARBUSDT maintaining a solid uptrend, respecting its ascending trendline while consistently printing higher highs (HH) and higher lows (HL). This structure underscores ongoing bullish conviction. Price action recently staged a strong bounce off the trendline with marked bullish divergence on RSI, and volume confirmation adds muscle to the move.
🔺 Key Bullish Setup:
- Trendline Continuation: Price respects and bounces off a well-defined yellow trendline, reinforcing the uptrend’s technical foundation and providing a dynamic support reference for traders.
- Swings (HH, HL, SL): The chart highlights multiple Higher Highs (HH) and Higher Lows (HL), validating persistent bullish order flow. A prior same low (SL) remains untouched, further cementing trend integrity.
- Volume Confirmation: Noticeable upticks in volume during upward impulses and corrections confirm genuine momentum and institutional participation. Recent volume surges during corrections point to accumulation.
- RSI & Bullish Divergence: The RSI (14) is currently at 60.51, below typical overbought territory and leaving room for more upside. Significantly, the latest HL forms alongside a bullish RSI divergence—price makes higher lows as RSI also rises—implying underlying buying strength and likely trend continuation.
- New Overbought OB Level: A fresh OB is marked at ~82.40 on the RSI, establishing a clear ceiling should bullish momentum accelerate.
- Resistance & Targets: Key resistance is at 0.5712 — price testing or breaking this level is pivotal. Above, technical targets are projected at 0.7175 and 0.9525, aligning with previous structural pivots and projected breakout extensions.
📊 Supporting Details:
- Trendline & Swings: The consistent pattern of HLs, HHs, and untouched SL demonstrates primary bullish control.
- Volume: Surging volumes during impulse moves and corrections confirm that buyers are driving rallies while also absorbing dips.
- RSI Bullish Divergence: Underlines demand emergence at each corrective phase.
- Order Book Dynamic: Price above 0.5712 faces thinner resistance, offering room for a rapid move toward the upper targets.
🚨 Conclusion:
With trendline support holding, recurring bullish swing patterns, strong volume on breakouts and corrections, and RSI confirming hidden buying pressure, ARBUSDT is positioned for bullish continuation. Watch for confirmed closes above 0.5712; upside expansions to 0.7175 and 0.9525 are highly probable if volume inflow and RSI momentum persist. The defined new RSI OB at 82.40 helps monitor overextension risk.
Stay alert for any trendline or HL breakdowns, but as long as this structure holds with supporting volume and momentum, the bias remains positive. Watch resistance reactions and momentum signals to ride the next wave.
#ARB/USDT – Watching Key Support for Long Entry#ARB
The price is moving within an ascending channel on the 1-hour frame, adhering well to it, and is on track to break it strongly upwards and retest it.
We have support from the lower boundary of the ascending channel, at 0.4500.
We have a downtrend on the RSI indicator that is about to break and retest, supporting the upside.
There is a major support area in green at 0.4420, which represents a strong basis for the upside.
Don't forget a simple thing: ease and capital.
When you reach the first target, save some money and then change your stop-loss order to an entry order.
For inquiries, please leave a comment.
We have a trend to hold above the 100 Moving Average.
Entry price: 0.4580.
First target: 0.4650.
Second target: 0.4810.
Third target: 0.5000.
Don't forget a simple thing: ease and capital.
When you reach the first target, save some money and then change your stop-loss order to an entry order.
For inquiries, please leave a comment.
Thank you.
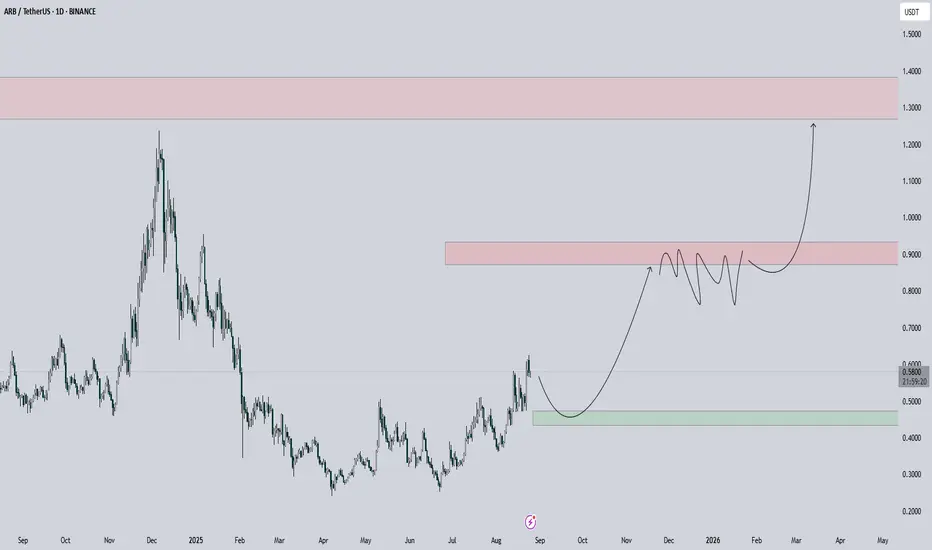
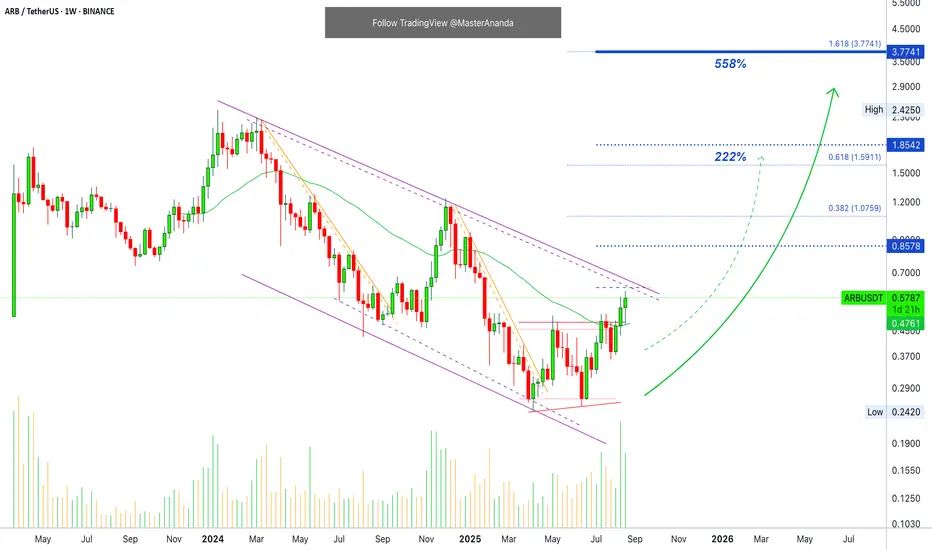
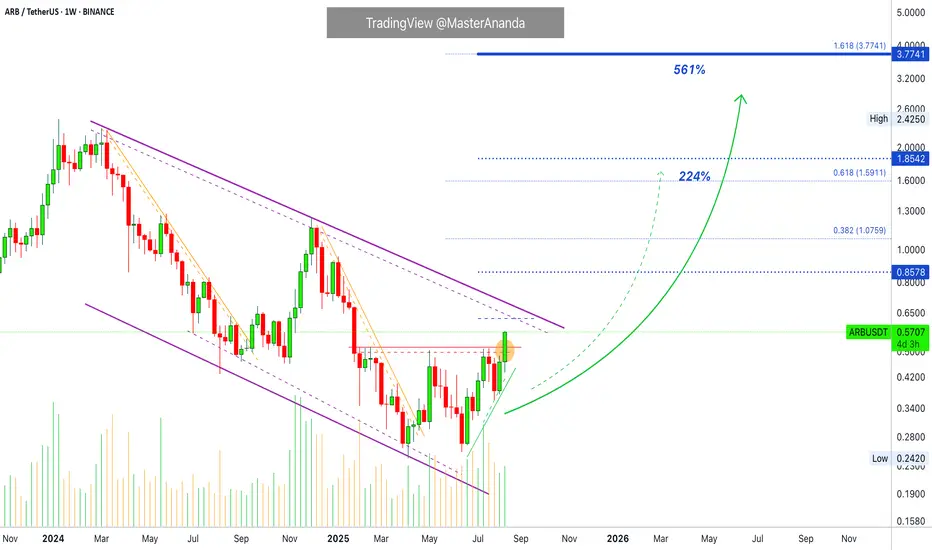
Arbitrum Long-Term vs Daily · Weekly TimeframeI Just showed you recently a chart for ARBUSDT on the daily timeframe. The main target was $1.85 mid-term. This target here shows 224% profits potential and is only a halfway through resistance, not a major point.
When we zoom out, looking here at ARBUSDT on the weekly timeframe, we can see the main target now being $3.77 for this move with a nice 561% total growth potential. More than twice as much as before.
ARBUSDT is now breaking local resistance with a full green candle. The weekly session is trading at the top and the week is only in half, we have many more days that can accommodate additional growth.
The daily timeframe can be used by those trading short to mid-term while the long-term timeframe, this one, can be used for long-term holders, buyers, traders.
My suggestion is to focus on the higher targets, even if just this one time because this is the time that matters and the time that counts. After this bullish cycle, you can secure profits on your trades at 30%, 50% or 100%. Now, you have to aim high because the market will produce the best possible, we have to make the most of this opportunity.
Thank you for reading.
Namaste.
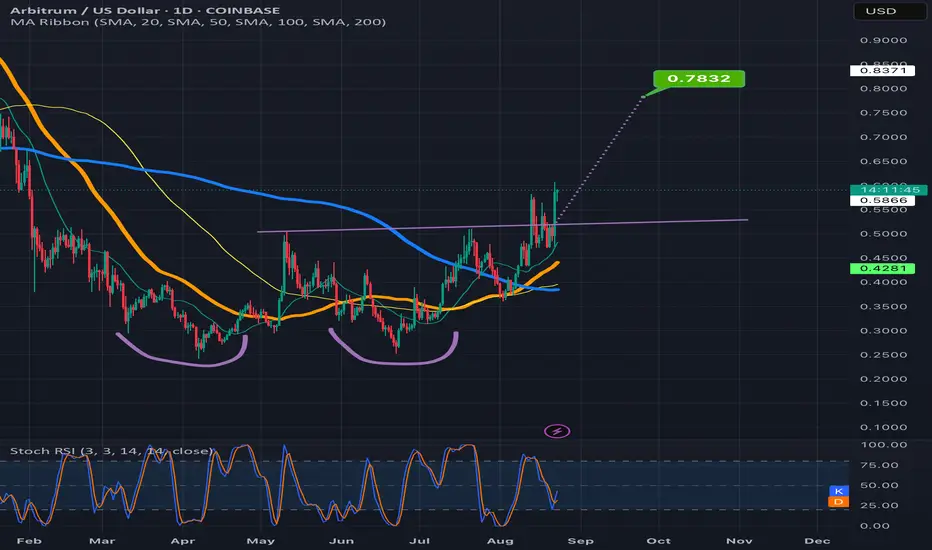
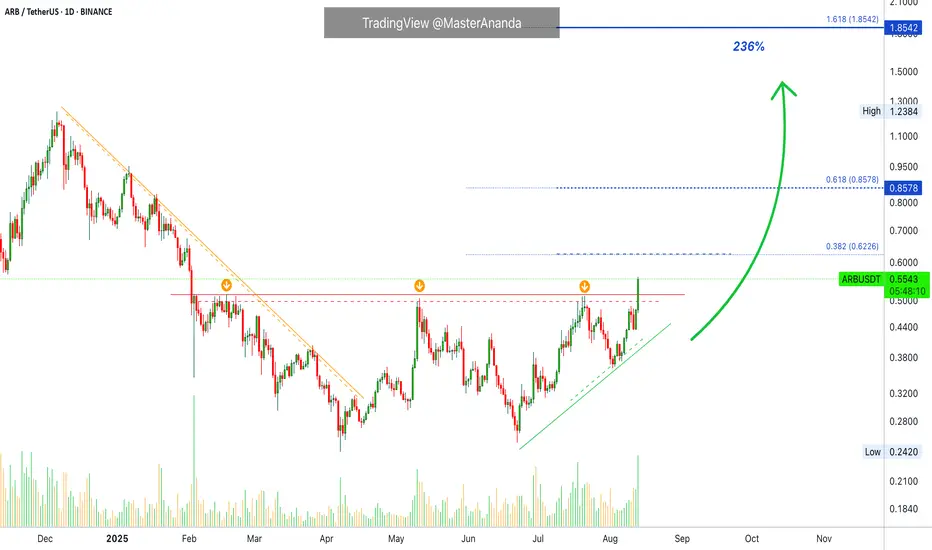
Arbitrum: How to Sell at the TopToday ARB finally broke out of a bottom pattern and trades at the highest price since February 2025, eight months ago.
Here we have a very strong chart and signals. All the signals are very advanced and fully confirmed. For example, today's candle is full green and hitting the highest price in months. Volume is the highest since February.
Here we have a rising trend. Up but not only bullish action. There are always retraces within growing periods. For example, look at July; a retrace but this retrace ends in a higher low followed by additional growth. Present, breaking resistance but once the next resistance level is hit, the possibility always opens for a new retrace. The retrace we know ends in a higher low and additional growth because we are in a bull market.
The current uptrend should go for months.
This is a mid-term chart you are looking at based on the daily timeframe. Targets are likely to hit within 1-3 months.
Arbitrum is rising nicely soon to meet 0.6226 as the first resistance zone for the current advance. Here we can see some minor disturbance followed by additional growth.
The 0.8578 resistance is much stronger than the previous one so profits can be secured around this zone only with the intention of buying everything back lower. Since we are certain—high positivity—that a strong bullish wave follows, we don't want to sell too early. The goal is to sell high.
The main target for this move is 1.85. After this level, we should get some sort of stop. Some pairs stop above the conquered resistance and go sideways for a while. Some produce a strong flush while others start a small correction, invariably, everything leads to additional growth and the market grows.
So, aim high and profit the most. When your pairs start hitting 300% profits start planning your take profits strategy and you can't never go wrong at this point. The most common mistake can be selling too early, not holding long enough. Another mistake is to hold forever and miss the top.
Namaste.
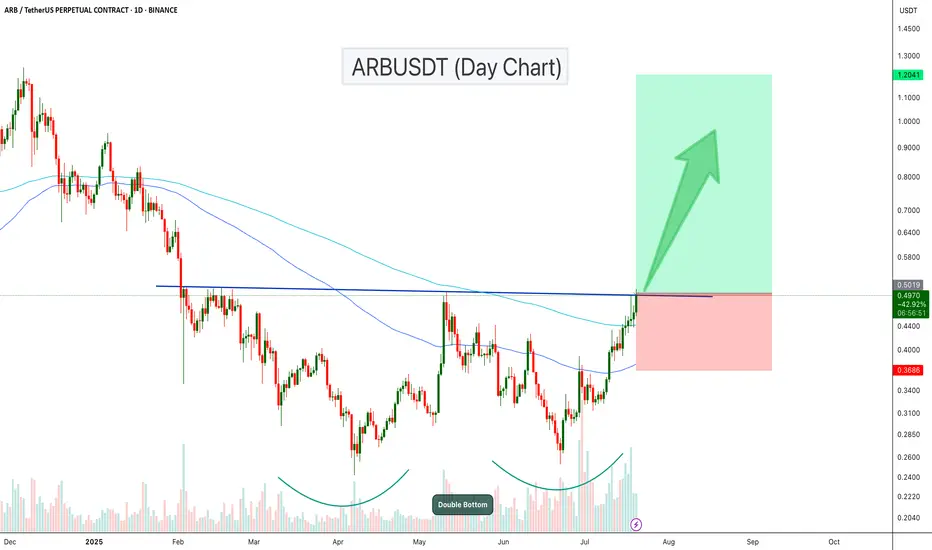
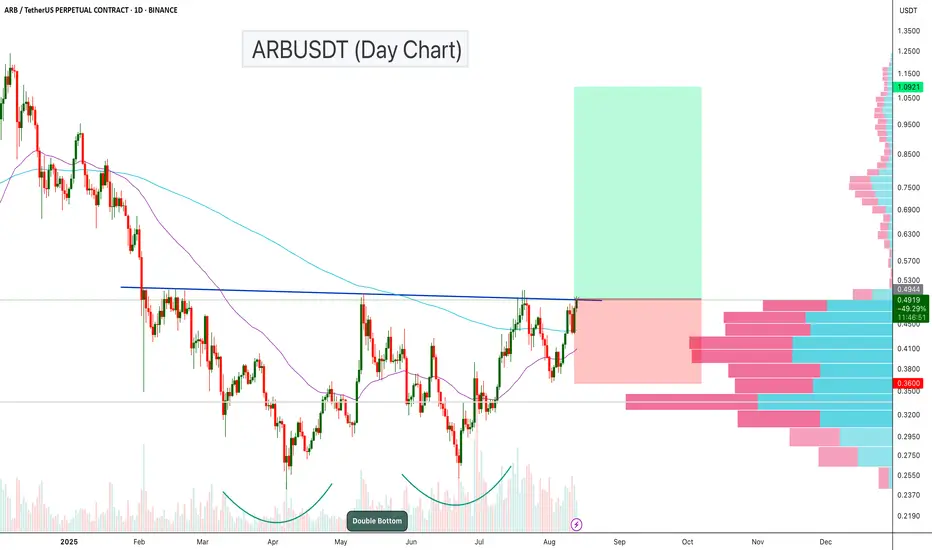
ARBUSDT – Double Bottom Breakout Loading?ARBUSDT is showing a strong bullish structure on the daily chart, with a classic Double Bottom pattern forming over the past few months. Price is now pressing against the neckline resistance, which, if broken, could trigger a powerful upside move.
Key Points:
Double Bottom Formation: The pattern started in April 2025 and completed its second bottom in July, indicating a potential long-term reversal setup.
Neckline Resistance: Price is currently testing the $0.49–$0.50 zone, which aligns with previous swing highs and marks the breakout level for the pattern.
Volume Profile: The visible range volume profile shows low-volume nodes above $0.50, suggesting a potential “thin air” move toward higher targets if the breakout is confirmed.
The chart is setting up for a potential trend reversal. A confirmed breakout from the double bottom neckline could propel ARBUSDT toward the $1+ zone
Cheers
Hexa
#ARB/USDT#ARB
The price is moving within an ascending channel on the 1-hour frame, adhering well to it, and is on track to break it strongly upwards and retest it.
We have support from the lower boundary of the ascending channel, at 0.3735.
We have a downtrend on the RSI indicator that is about to break and retest, supporting the upside.
There is a major support area (in green) at 0.3688, which represents a strong basis for the upside.
Don't forget a simple thing: ease and capital.
When you reach the first target, save some money and then change your stop-loss order to an entry order.
For inquiries, please leave a comment.
We have a trend to hold above the 100 Moving Average.
Entry price: 0.3832.
First target: 0.3913.
Second target: 0.4025.
Third target: 0.4145.
Don't forget a simple thing: ease and capital.
When you reach your first target, save some money and then change your stop-loss order to an entry order.
For inquiries, please leave a comment.
Thank you.

Arbitrum ARB price analysis — Can It Reclaim $1 ?Airdrop history 🪂 left a trail of regret — #ARB was widely distributed near $1, but most holders are still underwater 2 years later 💀
🔹 For recovery to start: break $0.50
🔻 Avoid the death zone: $0.30 must hold
🔄 If momentum returns and GameFi/DeFi reawakens — #ARB could lead.
🎯 If OKX:ARBUSDT price touches $1 again — don’t let greed win this time 😉
________________
📚 Follow us ❤️ for daily crypto insights & updates!
🚀 Don’t miss out on important market moves
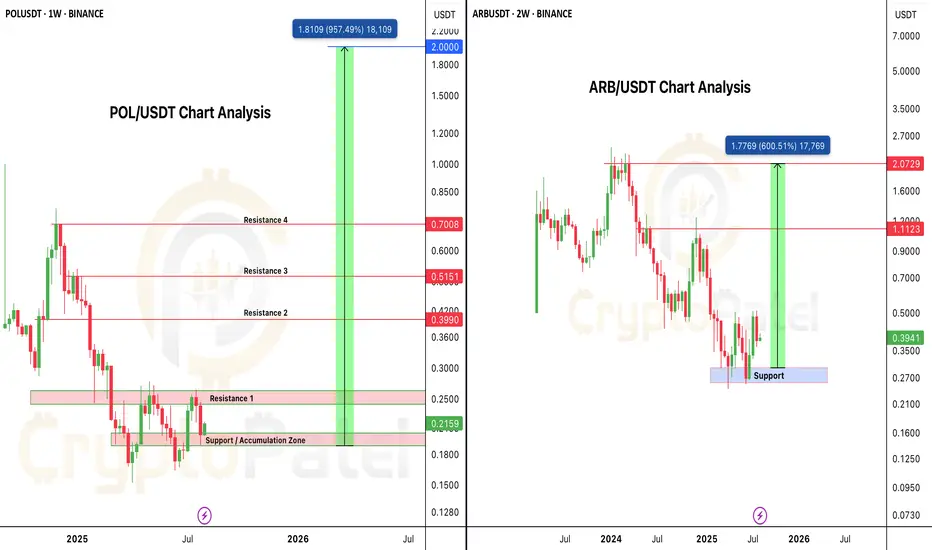
Altseason is Loading... Which One’s Your 10x Pick – $POL or $ARB🚨 BULL MARKET ACCUMULATION ALERT 🚨
Both PSX:POL and AMEX:ARB are currently trading below $0.40, and both charts are showing strong long-term bullish structure.
PSX:POL Analysis:
• Current Price: Under $0.40
• Strong Entry Zone: $0.20 – $0.17
• Bull Run Targets: $2 – $5
• Backed by powerful fundamentals, strong tech, and serious investors.
AMEX:ARB Analysis:
• Current Price: ~$0.40
• Key Accumulation Zone: $0.40 – $0.30
• Bull Run Targets: $2 – $5
• One of the strongest L2 ecosystems with deep liquidity and solid fundamentals.
Both are technically oversold, fundamentally strong, and positioned for major upside in the coming altseason.
Question for the community:
Which one hits $2 first — PSX:POL or AMEX:ARB ?
Drop your pick below 👇
NFA & DYOR
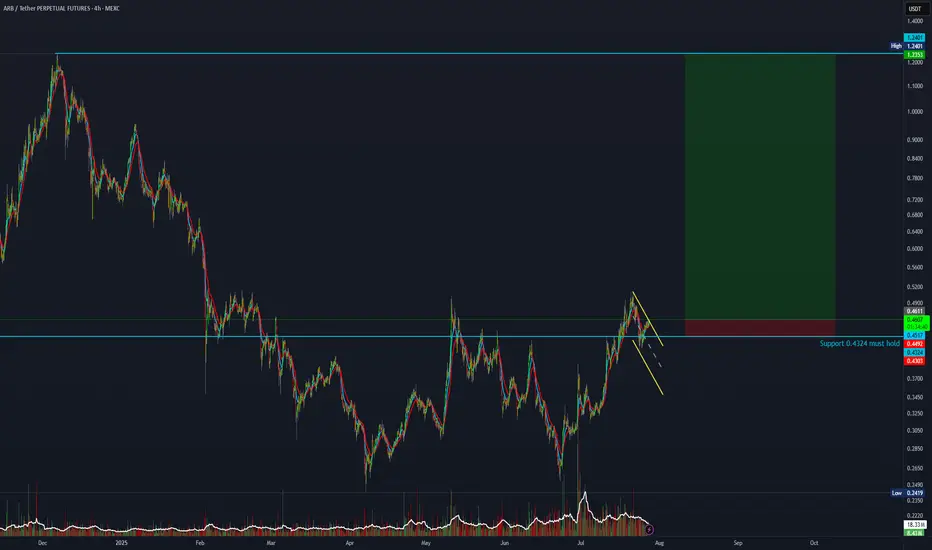
25:1 R:R trade setup on ArbitrumThis is it — a high-risk trade setup with a 25:1 R:R.
Entry: 0.4611
Stop Loss: 0.4303
Target: 1.2300
Not financial advice. Risk only 1% of your portfolio.
#ARB/USDT#ARB
The price is moving within a descending channel on the 1-hour frame, adhering well to it, and is on its way to breaking strongly upwards and retesting it.
We have support from the lower boundary of the descending channel, at 0.4550.
We have a downtrend on the RSI indicator that is about to be broken and retested, supporting the upside.
There is a major support area in green at 0.4520, which represents a strong basis for the upside.
Don't forget a simple thing: ease and capital.
When you reach the first target, save some money and then change your stop-loss order to an entry order.
For inquiries, please leave a comment.
We have a trend to hold above the 100 Moving Average.
Entry price: 0.4616
First target: 0.4751
Second target: 0.4923
Third target: 0.5135
Don't forget a simple thing: ease and capital.
When you reach the first target, save some money and then change your stop-loss order to an entry order.
For inquiries, please leave a comment.
Thank you.

#ARB/USDT Arbitrum scalp long to $ 0.5122#ARB
The price is moving within a descending channel on the 1-hour frame, adhering well to it, and is on its way to breaking strongly upwards and retesting it.
We have support from the lower boundary of the descending channel at 0.4270.
We have a downtrend on the RSI indicator that is about to be broken and retested, supporting the upside.
There is a major support area in green at 0.4300, which represents a strong basis for the upside.
Don't forget a simple thing: ease and capital.
When you reach the first target, save some money and then change your stop-loss order to an entry order.
For inquiries, please leave a comment.
We have a trend to hold above the 100 Moving Average.
Entry price: 0.4720
First target: 0.5554
Second target: 0.4982
Third target: 0.5122
Don't forget a simple thing: ease and capital.
When you reach your first target, save some money and then change your stop-loss order to an entry order.
For inquiries, please leave a comment.
Thank you.

ARBUSDT Breaks Out of Double Bottom!ARB has formed a clear double bottom pattern on the daily chart, signaling a strong reversal structure. After multiple rejections, the price has now broken above the neckline resistance, confirming bullish momentum.
The breakout is also supported by increasing volume and a bullish crossover of the 100 and 200 EMA zones. If the current momentum holds, ARB could reach the target of $0.75- $1.20 level.