#ARB/USDT | Testing Wedge Breakout Amid Key Support#ARB
The price is moving within a descending channel on the hourly timeframe. It has reached the lower boundary and is heading towards a breakout, with a retest of the upper boundary expected.
The Relative Strength Index (RSI) is showing a downward trend, approaching the lower boundary, and an upward bounce is anticipated.
There is a key support zone in green at 0.1066, and the price has bounced from this level several times and is expected to bounce again.
The indicator is showing a trend towards consolidation above the 100-period moving average, which we are approaching, supporting the upward move.
Entry Price: 0.1099
First Target: 0.1139
Second Target: 0.1188
Third Target: 0.1238
Stop Loss: Below the green support zone.
Remember this simple thing: Money management.
For any questions, please leave a comment.
Thank you.
Arbusdtlong

#ARB/USDT | Testing Wedge Breakout Amid Key Support#ARB
The price is moving within a descending channel on the hourly timeframe. It has reached the upper boundary and is heading towards breaking it. A retest of this boundary is expected.
The Relative Strength Index (RSI) is showing an upward trend, as it has approached the upper boundary. A bearish reversal is expected.
There is a key support zone in green at 0.01040. The price has bounced from this zone several times and is expected to bounce again.
A consolidation trend is observed above the 100-period moving average, which we are approaching. This trend supports a decline towards this level.
Entry Price: 0.1111
First Target: 0.1141
Second Target: 0.1189
Third Target: 0.1239
Stop Loss: Above the green support zone.
Don't forget one simple thing: Money Management.
For any questions, please leave a comment.
Thank you.

#ARB/USDT | Testing Wedge Breakout Amid Key Support#ARB
The price is moving within a descending channel on the hourly timeframe. It has reached the lower boundary and is heading towards a breakout, with a retest of the upper boundary expected.
The Relative Strength Index (RSI) is showing a downward trend, approaching the lower boundary, and an upward bounce is anticipated.
There is a key support zone in green at 1333, and the price has bounced from this level several times. Another bounce is expected.
The RSI is showing a trend towards consolidation above the 100-period moving average, which we are approaching, supporting the upward move.
Entry Price: 0.1364
Target 1: 0.1390
Target 2: 0.1427
Target 3: 0.1477
Stop Loss: Below the green support zone.
Remember this simple thing: Money management.
For any questions, please leave a comment.
Thank you.

#ARB/USDT | Testing Wedge Breakout Amid Key Support#ARB
The price is moving within a descending channel on the hourly timeframe. It has reached the lower boundary and is heading towards a breakout, with a retest of the upper boundary expected.
The Relative Strength Index (RSI) is showing a downward trend, approaching the lower boundary, and an upward bounce is anticipated.
There is a key support zone in green at 0.1777. The price has bounced from this level several times and is expected to bounce again.
The RSI is showing a trend towards consolidation above the 100-period moving average, which we are approaching, supporting the upward move.
Entry Price: 0.1817
Target 1: 0.1844
Target 2: 0.1897
Target 3: 0.1964
Stop Loss: Below the green support zone.
Remember this simple thing: Money management.
For any questions, please leave a comment.
Thank you.

#ARB/USDT | Testing Wedge Breakout Amid Key Support#ARB
The price is moving within a descending channel on the hourly timeframe. It has reached the lower boundary and is heading towards a breakout, with a retest of the upper boundary expected.
The Relative Strength Index (RSI) is showing a downward trend, approaching the lower boundary, and an upward bounce is anticipated.
There is a key support zone in green at 0.2100. The price has bounced from this level several times and is expected to bounce again.
The RSI is showing a trend towards consolidation above the 100-period moving average, which we are approaching, supporting the upward move.
Entry Price: 0.2130
First Target: 0.2157
Second Target: 0.2190
Third Target: 0.2234
Stop Loss: Below the green support zone.
Remember this simple thing: Money management.
For any questions, please leave a comment.
Thank you.

#ARB/USDT#ARB
The price is moving within a descending channel on the hourly timeframe. It has reached the upper boundary and is trending downwards, with a retest of this boundary expected.
The Relative Strength Index (RSI) is showing an upward trend, approaching the upper boundary, and a downward reversal is anticipated.
There is a key resistance zone (in green) at 0.2250, and the price has bounced from this zone several times. Another bounce is expected.
The price is showing a consolidation pattern above the 100-period moving average, which we are approaching, supporting the possibility of a downward move towards it.
Entry Price: 0.2120
Target 1: 0.2017
Target 2: 0.1963
Target 3: 0.1887
Stop Loss: Above the green resistance zone.
Don't forget one simple thing: Money Management.
For inquiries, please leave a comment.
Thank you.

ARB/USDT - Falling Wedge: Trend Reversal or Consolidation?ARB/USDT on the 2-Day timeframe is trading within a medium-term corrective structure after a prolonged bearish move from mid-2025. Price action is now compressing inside a Falling Wedge pattern, indicating a gradual reduction in selling pressure.
Currently, price is hovering near the lower boundary of the wedge, a critical zone that often acts as a decision area between a bullish reversal breakout or a bearish continuation if the structure fails.
---
Chart Pattern Explanation
Falling Wedge (Bullish Reversal Pattern)
Formed by lower highs and lower lows with contracting price range
The upper trendline slopes downward with decreasing momentum
The lower trendline also slopes downward but with weaker selling pressure
This pattern often appears at the end of a downtrend
A confirmed breakout above the upper wedge trendline usually signals a trend reversal or strong bullish retracement.
---
Key Levels
Resistance Levels:
0.2450 → Key breakout resistance (wedge invalidation level)
0.3050 → Major resistance / mid-range supply zone
0.3600 – 0.4560 → Strong distribution area
0.5850 → Upper structure / extreme bullish target
Support Levels:
0.2180 – 0.2000 → Current short-term support inside the wedge
0.1600 – 0.1350 → Structural support zone
0.1049 → Historical low / last strong demand area
---
Bullish Scenario
Price holds above the 0.20 support zone
Clear breakout above the Falling Wedge upper trendline
Strong candle close above 0.2450
Bullish Targets:
1. 0.3050
2. 0.3600
3. 0.4560
4. Maximum extension: 0.5850
➡️ This scenario confirms a bullish reversal from the Falling Wedge, especially if supported by increasing volume.
---
Bearish Scenario
Price fails to hold the 0.20 support
Breakdown below the lower wedge support
Strong candle close below 0.1600
Bearish Targets:
1. 0.1350
2. 0.1150
3. 0.1049 (previous low)
➡️ This indicates pattern failure, opening the door for bearish continuation toward historical demand zones.
---
Conclusion
ARB/USDT is currently trading at a critical structural zone.
A confirmed breakout from the Falling Wedge favors a bullish reversal or strong recovery move
Failure to hold key supports would invalidate the pattern and resume the dominant downtrend
Waiting for a confirmed breakout or breakdown is crucial for risk management.
---
#ARBUSDT #ARBITRUM #CryptoAnalysis #TechnicalAnalysis #FallingWedge
#AltcoinTrading #MarketStructure #SupportResistance

#ARB/USDT | Testing Wedge Breakout Amid Key Support#ARB
The price is moving in a descending channel on the 1-hour timeframe. It has reached the lower boundary and is heading towards a breakout, with a retest of the upper boundary expected.
We are seeing a bearish trend in the Relative Strength Index (RSI), which has reached near the lower boundary, and an upward bounce is expected.
There is a key support zone in green at 0.1840, and the price has bounced from this level several times. Another bounce is expected.
We are seeing a trend towards stabilizing above the 100-period moving average, which we are approaching, supporting the upward trend.
Entry Price: 0.1900
First Target: 0.1924
Second Target: 0.1958
Third Target: 0.1995
Remember a simple principle: Money Management.
Place your stop-loss order below the green support zone.
For any questions, please leave a comment.
Thank you.

#ARB/USDT | Testing Wedge Breakout Amid Key Support#ARB
The price is moving in a descending channel on the 1-hour timeframe. It has reached the lower boundary and is heading towards breaking above it, with a retest of the upper boundary expected.
We have a downtrend on the RSI indicator, which has reached near the lower boundary, and an upward rebound is expected.
There is a key support zone in green at 0.1850. The price has bounced from this zone multiple times and is expected to bounce again.
We have a trend towards consolidation above the 100-period moving average, as we are moving close to it, which supports the upward movement.
Entry price: 0.1900
First target: 0.1931
Second target: 0.1984
Third target: 0.2044
Don't forget a simple principle: money management.
Place your stop-loss order below the support zone in green.
For any questions, please leave a comment.
Thank you.

Arbitrum (ARB) - scalp ideaThis is not a setup. These are just sketches and ideas. We need to closely monitor the reaction in the long FVG. The targets are indicated on the chart.
This is a risky idea. BINANCE:ARBUSDT.P

#ARB/USDT | Testing Wedge Breakout Amid Key Support#ARB
The price is moving in a descending channel on the 1-hour timeframe. It has reached the lower boundary and is heading towards breaking above it, with a retest of the upper boundary expected.
We have a downtrend on the RSI indicator, which has reached near the lower boundary, and an upward rebound is expected.
There is a key support zone in green at 0.2000. The price has bounced from this level multiple times and is expected to bounce again.
We have a trend towards consolidation above the 100-period moving average, as we are moving close to it, which supports the upward movement.
Entry price: 0.2142
First target: 0.2170
Second target: 0.2219
Third target: 0.2280
Don't forget a simple principle: money management.
Place your stop-loss order below the support zone in green.
For any questions, please leave a comment.
Thank you.

#ARB/USDT | Testing Wedge Breakout Amid Key Support#ARB
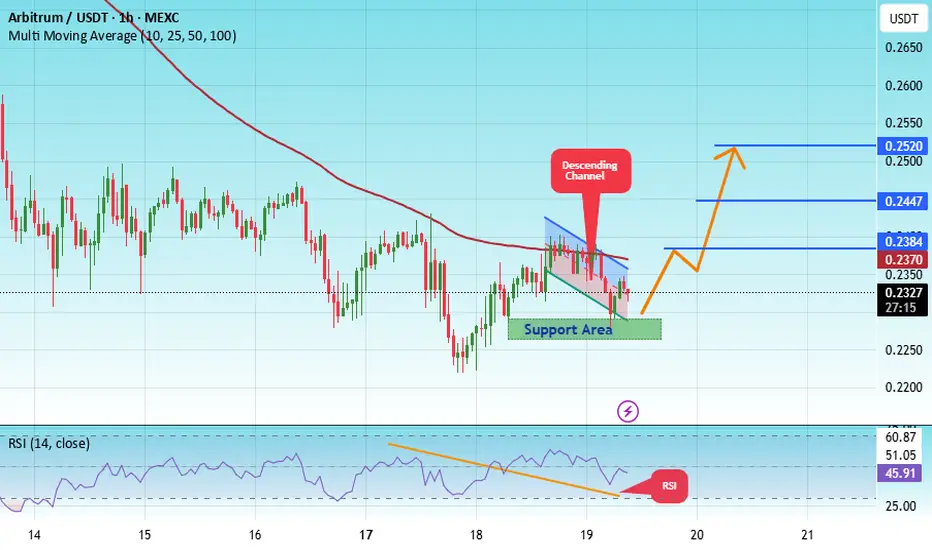
The price is moving within an ascending channel on the 1-hour timeframe and is adhering to it well. It is poised to break out strongly and retest the channel.
We have a downtrend line on the RSI indicator that is about to break and retest, which supports the upward move.
There is a key support zone in green at 0.2276, representing a strong support point.
We have a trend of consolidation above the 100-period moving average.
Entry price: 0.2318
First target: 0.2384
Second target: 0.2447
Third target: 0.2520
Don't forget a simple money management rule:
Place your stop-loss order below the green support zone.
Once you reach the first target, save some money and then change your stop-loss order to an entry order.
For any questions, please leave a comment.
Thank you.
#ARB/USDT — Last Line of Defense: Reversal Incoming or Breakdo#ARB
The price is moving within an ascending channel on the 1-hour timeframe and is adhering to it well. It is poised to break out strongly and retest the channel.
We have a downtrend line on the RSI indicator that is about to break and retest, which supports the upward move.
There is a key support zone in green at 0.2517, representing a strong support point.
We have a trend of consolidation above the 100-period moving average.
Entry price: 0.2619
First target: 0.2693
Second target: 0.2776
Third target: 0.2883
Don't forget a simple money management rule:
Place your stop-loss order below the green support zone.
Once you reach the first target, save some money and then change your stop-loss order to an entry order.
For any questions, please leave a comment.
Thank you.

#ARB/USDT#ARB
The price is moving within an ascending channel on the 1-hour frame, adhering well to it, and is heading for a strong breakout and retest.
We have a bearish trend on the RSI indicator that is about to be broken and retested, which supports the upward breakout.
There is a major support area in green at 0.3200, which represents a strong support point.
We are heading for stability above the 100 moving average.
Entry price: 0.3307
First target: 0.3363
Second target: 0.3470
Third target: 0.3618
Don't forget a simple matter: capital management.
When you reach the first target, save some money and then change your stop-loss order to an entry order.
For inquiries, please leave a comment.
Thank you.

ARB/USDT — Last Line of Defense: Reversal Incoming or Breakdown?ARB is now standing at a critical confluence zone between $0.305 and $0.270 — a major demand area that has repeatedly acted as the final support since early 2025.
The broader structure remains bearish under a descending resistance line, yet the price reaction near the lower boundary suggests the potential formation of a falling wedge, a classic reversal pattern.
The recent long lower wick shows a liquidity sweep — likely a stop-hunt phase where weak longs are shaken out before a potential trend reversal. If buyers manage to defend this zone, a powerful rebound could emerge.
---
Technical Structure & Pattern
Key Demand Zone (Yellow Block):
$0.305 – $0.270 → strong historical demand zone and current buyer defense line.
Descending Resistance Line:
Continues to suppress every bullish attempt since December 2024.
A confirmed breakout and close above it would mark the first structural shift toward bullish momentum.
Ascending Support Line:
Connects recent higher lows, forming a converging wedge structure — often a precursor to a breakout.
Main Resistance Levels:
$0.4809 → $0.5889 → $0.9187 → $1.1646 (progressive upside targets).
---
Bullish Scenario
Confirmation Signs:
Strong rejection and candle close above $0.305 with rising volume.
Breakout and close above the descending trendline resistance.
Upside Targets:
TP1: $0.4809
TP2: $0.5889
TP3: $0.9187 (extended target if momentum builds)
Market Narrative:
Buyers reclaim control from a deep accumulation zone, signaling the first real chance of a structural reversal. A successful breakout could trigger a mid-term recovery trend toward $0.50 and beyond.
---
Bearish Scenario
Confirmation Signs:
2D candle closes below $0.270 with strong follow-through selling pressure.
Failed rebound from the demand zone.
Downside Targets:
TP1: $0.220
TP2: $0.165 (historical capitulation zone)
Market Narrative:
If this demand zone breaks, sellers will likely dominate, pushing ARB into a deeper distribution phase. This would confirm the continuation of the broader bearish structure.
---
Conclusion: The Make-or-Break Zone
ARB is currently at a critical inflection point.
The $0.305–$0.270 zone is the last stronghold for bulls — a decisive rejection here could mark the beginning of a major reversal.
But if it fails, ARB could slide toward $0.22 or even $0.16, signaling a deeper leg down in the market cycle.
This is a make-or-break moment for ARB — the next move will define its medium-term trend direction.
---
#ARB #ARBUSDT #CryptoAnalysis #TechnicalAnalysis #FallingWedge #DemandZone #SupplyDemand #CryptoTrading #PriceAction #SwingTrade #MakeOrBreak #ReversalSetup #ChartAnalysis #CryptoMarket

#ARB/USDT Analysis: Breakout Potential with Overbought RSI !#ARB
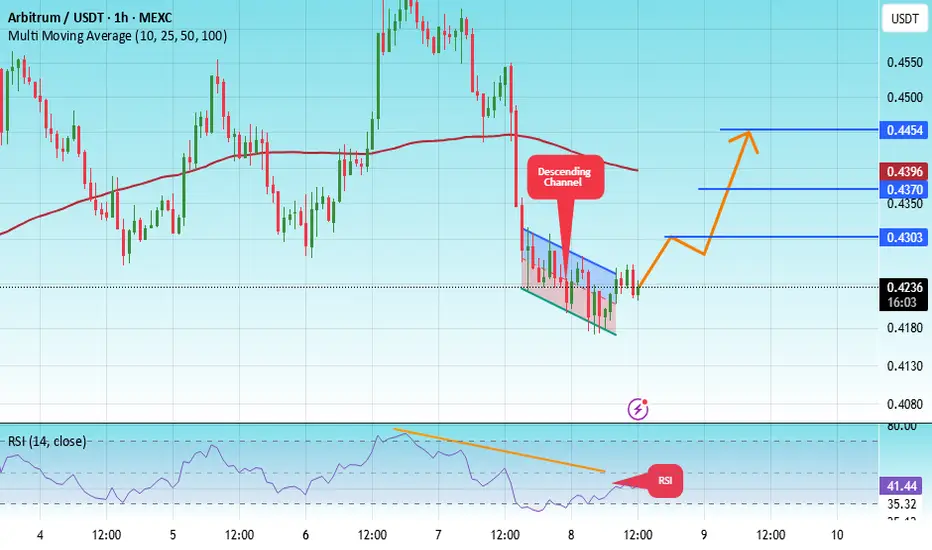
The price is moving within a descending channel on the 1-hour frame, adhering well to it, and is heading for a strong breakout and retest.
We have a bearish trend on the RSI indicator that is about to be broken and retested, which supports the upward breakout.
There is a major support area in green at 0.4180, which represents a strong support point.
We are heading for consolidation above the 100 moving average.
Entry price: 0.4229
First target: 0.4303
Second target: 0.4370
Third target: 0.4454
Don't forget a simple matter: capital management.
When you reach the first target, save some money and then change your stop-loss order to an entry order.
For inquiries, please leave a comment.
Thank you.
#ARB/USDT (ARB): Looking For Buy Entry | 2 Zones To Keep an Ey#ARB
The price is moving within a descending channel on the 1-hour frame, adhering well to it, and heading for a strong breakout and retest.
We have a bearish trend on the RSI indicator that is about to be broken and retested, which supports the upward breakout.
There is a major support area in green at 0.4140, which represents a strong support point.
We are heading for consolidation above the 100 moving average.
Entry price: 0.4160
First target: 0.4215
Second target: 0.4264
Third target: 0.4325
Don't forget a simple matter: capital management.
When you reach the first target, save some money and then change your stop-loss order to an entry order.
For inquiries, please leave a comment.
Thank you.

BUY AND HOLDHello friends
Given the price reaching the bottom and the floor that this currency has made, we can expect its price to grow because the buyers at the bottom pushed the price up and now we are in a correction, which is a good opportunity to buy with capital and risk management and in steps and move with it to the specified goals.
Note that the holding period is at least 3 months, so be patient and observe capital management.
*Trade safely with us*

#ARB/USDT (ARB): Strong Liquidity Grab | Expecting Quick Recov#ARB
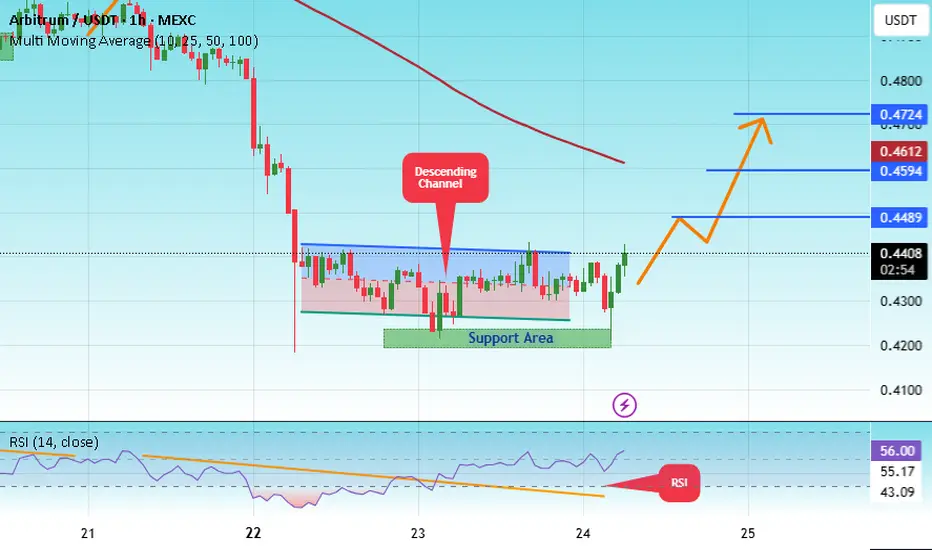
The price is moving within a descending channel on the 1-hour frame, adhering well to it, and is heading for a strong breakout and retest.
We have a bearish trend on the RSI indicator that is about to be broken and retested, which supports the upward breakout.
There is a major support area in green at 0.4200, which represents a strong support point.
We are heading for stability above the 100 moving average.
Entry price: 0.4400
First target: 0.4490
Second target: 0.4590
Third target: 0.4720
Don't forget a simple matter: capital management.
When you reach the first target, save some money and then change your stop-loss order to an entry order.
For inquiries, please leave a comment.
Thank you.
#ARB/USDT | TON Testing Wedge Breakout Amid Key Support#ARB
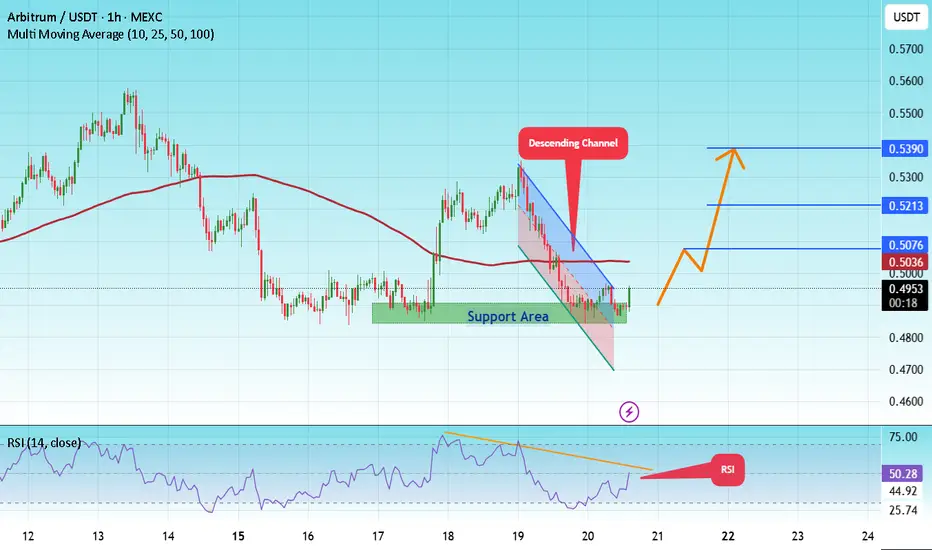
The price is moving in a descending channel on the 1-hour frame and is expected to break and continue upward.
We have a trend to stabilize above the 100 moving average once again.
We have a downtrend on the RSI indicator that supports the upward move with a breakout.
We have a major support area in green that pushed the price higher at 0.4858.
Entry price: 0.4940.
First target: 0.5076.
Second target: 0.5213.
Third target: 0.5390.
To manage risk, don't forget stop loss and capital management.
When you reach the first target, save some profits and then change the stop order to an entry order.
For inquiries, please comment.
Thank you.
#ARB/USDT Pro | ARB Set for Pump After Pullback to Support#ARB
The price is moving within a descending channel on the 1-hour frame, adhering well to it, and is heading for a strong breakout and retest.
We have a bearish trend on the RSI indicator that is about to be broken and retested, which supports the upward breakout.
There is a major support area in green at 0.4890, which represents a strong support point.
For inquiries, please leave a comment.
We are in a consolidation trend above the 100 moving average.
Entry price: 0.4942
First target: 0.5085
Second target: 0.5216
Third target: 0.5400
Don't forget a simple matter: capital management.
When you reach the first target, save some money and then change your stop-loss order to an entry order.
For inquiries, please leave a comment.
Thank you.

#ARB/USDT | ARB Set for Pump After Pullback to Support#ARB
The price is moving within a descending channel on the 1-hour frame, adhering well to it, and is heading for a strong breakout and retest.
We have a bearish trend on the RSI indicator that is about to be broken and retested, which supports the upward breakout.
There is a major support area in green at 0.4950, which represents a strong support point.
For inquiries, please leave a comment.
We are in a consolidation trend above the 100 moving average.
Entry price: 0.5083
First target: 0.5158
Second target: 0.5262
Third target: 0.5388
Don't forget a simple matter: capital management.
When you reach the first target, save some money and then change your stop-loss order to an entry order.
For inquiries, please leave a comment.
Thank you.

#ARB/USDT possible resistance/support flip happening#ARB
The price is moving within a descending channel on the 1-hour frame and is expected to break and continue upward.
We have a trend to stabilize above the 100 Moving Average once again.
We have a bearish trend on the RSI indicator, supporting the upward break.
We have a support area at the lower boundary of the channel at 0.4900, acting as strong support from which the price can rebound.
We have a major support area in green that pushed the price upward at 0.4860.
Entry price: 0.4940.
First target: 0.5008.
Second target: 0.5085.
Third target: 0.5180.
To manage risk, don't forget stop loss and capital management.
When you reach the first target, save some profits and then change your stop order to an entry order.
For inquiries, please comment.
Thank you.
