ARB/USDT — Last Line of Defense: Reversal Incoming or Breakdown?ARB is now standing at a critical confluence zone between $0.305 and $0.270 — a major demand area that has repeatedly acted as the final support since early 2025.
The broader structure remains bearish under a descending resistance line, yet the price reaction near the lower boundary suggests the potential formation of a falling wedge, a classic reversal pattern.
The recent long lower wick shows a liquidity sweep — likely a stop-hunt phase where weak longs are shaken out before a potential trend reversal. If buyers manage to defend this zone, a powerful rebound could emerge.
---
Technical Structure & Pattern
Key Demand Zone (Yellow Block):
$0.305 – $0.270 → strong historical demand zone and current buyer defense line.
Descending Resistance Line:
Continues to suppress every bullish attempt since December 2024.
A confirmed breakout and close above it would mark the first structural shift toward bullish momentum.
Ascending Support Line:
Connects recent higher lows, forming a converging wedge structure — often a precursor to a breakout.
Main Resistance Levels:
$0.4809 → $0.5889 → $0.9187 → $1.1646 (progressive upside targets).
---
Bullish Scenario
Confirmation Signs:
Strong rejection and candle close above $0.305 with rising volume.
Breakout and close above the descending trendline resistance.
Upside Targets:
TP1: $0.4809
TP2: $0.5889
TP3: $0.9187 (extended target if momentum builds)
Market Narrative:
Buyers reclaim control from a deep accumulation zone, signaling the first real chance of a structural reversal. A successful breakout could trigger a mid-term recovery trend toward $0.50 and beyond.
---
Bearish Scenario
Confirmation Signs:
2D candle closes below $0.270 with strong follow-through selling pressure.
Failed rebound from the demand zone.
Downside Targets:
TP1: $0.220
TP2: $0.165 (historical capitulation zone)
Market Narrative:
If this demand zone breaks, sellers will likely dominate, pushing ARB into a deeper distribution phase. This would confirm the continuation of the broader bearish structure.
---
Conclusion: The Make-or-Break Zone
ARB is currently at a critical inflection point.
The $0.305–$0.270 zone is the last stronghold for bulls — a decisive rejection here could mark the beginning of a major reversal.
But if it fails, ARB could slide toward $0.22 or even $0.16, signaling a deeper leg down in the market cycle.
This is a make-or-break moment for ARB — the next move will define its medium-term trend direction.
---
#ARB #ARBUSDT #CryptoAnalysis #TechnicalAnalysis #FallingWedge #DemandZone #SupplyDemand #CryptoTrading #PriceAction #SwingTrade #MakeOrBreak #ReversalSetup #ChartAnalysis #CryptoMarket
Arbusdtsignal

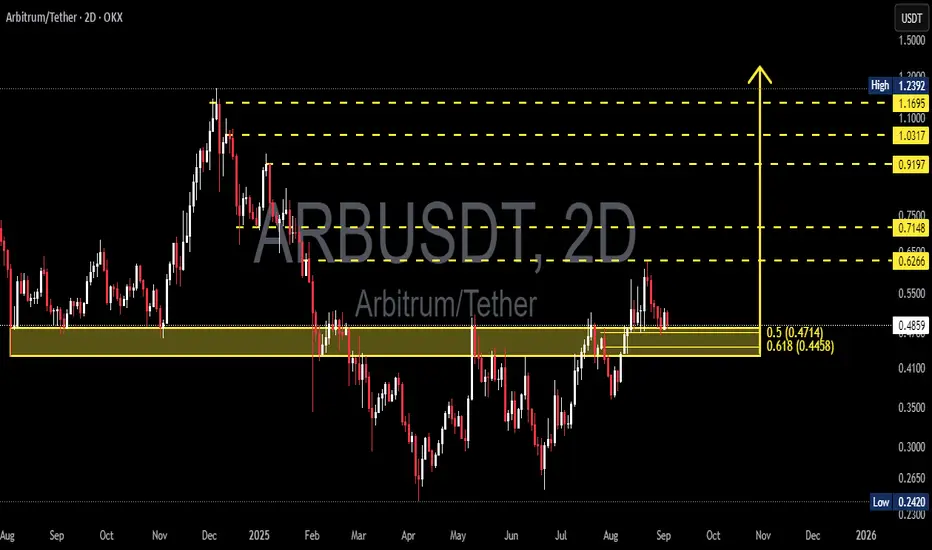
ARB/USDT — Retesting the Golden Pocket Before the Next Big Move?
📝 Key Summary:
Arbitrum (ARB) is currently consolidating within the Fibonacci golden pocket (0.445–0.471), which also acts as a major demand zone. This area will decide whether ARB can continue its bullish phase toward the psychological $1+ levels, or fail to hold and revisit deeper supports.
---
🔍 Price Structure & Key Patterns
1. Accumulation / Demand Zone (0.445–0.471):
This zone is a confluence of Fibonacci 0.5–0.618 and a strong historical support-resistance flip. Holding this level keeps the mid-term bullish case alive.
2. Higher Low Formation Since June:
From the 0.242 bottom, ARB has started forming higher lows, suggesting a potential transition toward a healthier uptrend.
3. Rejection at Supply Zone (0.62–0.63):
The latest rally was rejected here, confirming strong selling pressure. A clean breakout above this zone will be a key signal for a larger rally.
4. Wide Trading Range:
ARB is still ranging between 0.24 (low) and 1.23 (high). The current price sits in the lower-mid range, making this a high-interest zone for medium-term investors.
---
📈 Bullish Scenario
✅ Conditions: Price holds above 0.445–0.471 (2D bullish close + volume confirmation).
➡️ Upside targets:
First resistance: 0.6266
Next: 0.7148 → 0.9197 → 1.0317 → 1.1695 → 1.2392 (previous high)
📌 Note: A breakout above 0.63 with strong volume could trigger a multi-week swing rally.
---
📉 Bearish Scenario
❌ Conditions: 2D close below 0.4458 + strong selling volume.
➡️ Downside targets:
0.35 (intermediate support)
0.2420 (multi-month low / extreme demand zone)
📌 Note: Losing the golden pocket usually signals that the market isn’t ready for a bullish trend, raising the risk of retesting previous lows.
---
🧭 Trading Approach
Conservative: Wait for a 2D bullish rejection above 0.47 → long entry, stop below 0.445, first target 0.6266+.
Aggressive: Partial long entries at current levels, adding more upon bullish confirmation.
Short setup: Valid on breakdown below 0.445 → target 0.35, extension to 0.24 if selling persists.
Always apply risk management (RR ≥ 1:2), scale out at resistance levels.
---
📌 Conclusion
ARB is currently sitting at the key decision zone (Fibonacci golden pocket 0.445–0.471).
If this zone holds → bullish bias toward 0.63 up to 0.92+.
If this zone breaks → bearish bias toward 0.35 and potentially 0.24.
Traders should wait for candle + volume confirmation before committing, as this level could mark a major turning point in ARB’s mid-term trend.
---
#ARB #ARBUSDT #Arbitrum #CryptoAnalysis #PriceAction #SupportResistance #Fibonacci #CryptoTrading #Altcoins #SwingTrade
#ARB/USDT#ARB
The price is moving within a descending channel on the 1-hour frame and is expected to break and continue upward.
We have a trend to stabilize above the 100 moving average once again.
We have a downtrend on the RSI indicator that supports the upward break.
We have a support area at the lower boundary of the channel at 0.4900, acting as strong support from which the price can rebound.
We have a major support area in green that pushed the price upward at 0.5000.
Entry price: 0.5314.
First target: 0.5578.
Second target: 0.5955.
Third target: 0.6341.
To manage risk, don't forget stop loss and capital management.
When you reach the first target, save some profits and then change your stop order to an entry order.
For inquiries, please comment.
Thank you.

ARB/USDT — Golden Pocket Re-Test: Big Momentum Ahead?🔎 Chart Overview
ARB/USDT (2D - OKX) is now at a critical decision point. The price is currently testing the Golden Pocket Fibonacci 0.5–0.618 (0.445–0.475 USDT), which also aligns with a Support-Resistance Flip (S/R Flip) from previous structure.
This area is not just another technical level; it’s the “battlefield” that will define whether ARB enters a new bullish trend or slips back into a deeper correction.
---
📈 Bullish Scenario (Trend Continuation)
If ARB can close above 0.495–0.505 (2D candle confirmation), the Golden Pocket re-test will be validated. This could trigger a progressive bullish wave with targets as follows:
1️⃣ 0.6266 → first resistance checkpoint
2️⃣ 0.7148 → key psychological + structural resistance
3️⃣ 0.8500 → mid-range target
4️⃣ 0.9197 → prior supply zone
5️⃣ 1.0317 → strong historical resistance
6️⃣ 1.1695–1.2392 → major supply zone / previous swing high
👉 If this scenario plays out, we could see +20% to +120% upside from current levels.
---
📉 Bearish Scenario (Failed Re-Test)
On the flip side, if ARB fails to hold above 0.445, the Golden Pocket will flip into a strong sell zone. That could send the price into deeper levels:
0.420 → immediate minor support
0.360 → important support floor
0.310 → old consolidation base
0.260 – 0.2420 → extreme demand zone & structural low
👉 This scenario would expose ARB to a potential -30% to -50% downside.
---
🌀 Structure & Pattern Insight
Accumulation Signs: Since June 2025, ARB has been forming Higher Lows, hinting at steady accumulation.
Supply Test: Repeated rejection above 0.50 shows sellers are still defending this level.
Golden Pocket (0.445–0.475) → the ultimate battleground for buyers vs. sellers.
---
🎯 Key Takeaway
Above 0.475–0.495 = Bullish Bias → targets 0.6266, 0.7148, and beyond.
Below 0.445 = Bearish Bias → targets 0.42, 0.36, even 0.26–0.24.
In other words, this Golden Pocket will act as the gateway to ARB’s next big trend.
---
📝 Final Notes
Wait for 2D/1W closes to avoid false breakouts.
Manage risk wisely → this area is prone to liquidity grabs & fake-outs.
Whichever side wins this zone, momentum could be explosive.
#ARB #Arbitrum #ARBUSDT #CryptoAnalysis #PriceAction #GoldenPocket #SupportResistance #Fibonacci #CryptoTrading

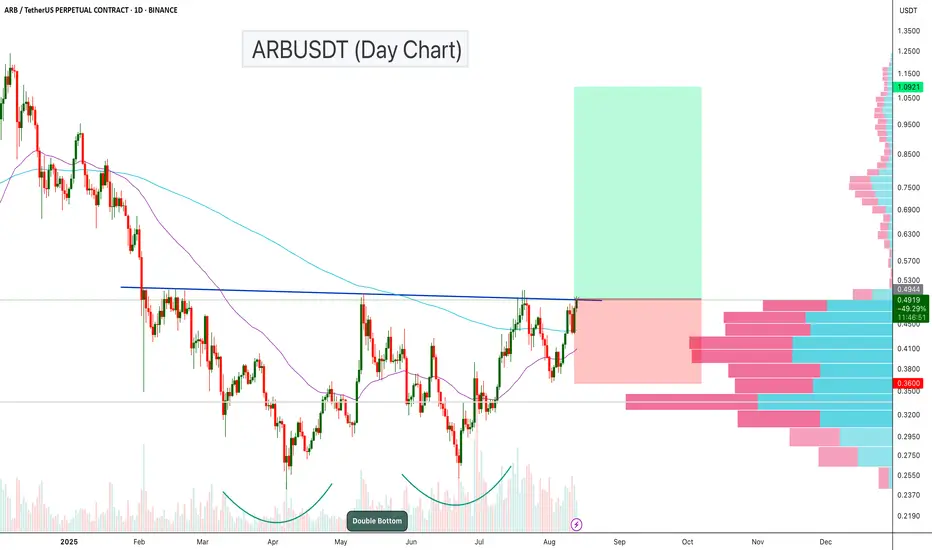
ARBUSDT – Double Bottom Breakout Loading?ARBUSDT is showing a strong bullish structure on the daily chart, with a classic Double Bottom pattern forming over the past few months. Price is now pressing against the neckline resistance, which, if broken, could trigger a powerful upside move.
Key Points:
Double Bottom Formation: The pattern started in April 2025 and completed its second bottom in July, indicating a potential long-term reversal setup.
Neckline Resistance: Price is currently testing the $0.49–$0.50 zone, which aligns with previous swing highs and marks the breakout level for the pattern.
Volume Profile: The visible range volume profile shows low-volume nodes above $0.50, suggesting a potential “thin air” move toward higher targets if the breakout is confirmed.
The chart is setting up for a potential trend reversal. A confirmed breakout from the double bottom neckline could propel ARBUSDT toward the $1+ zone
Cheers
Hexa
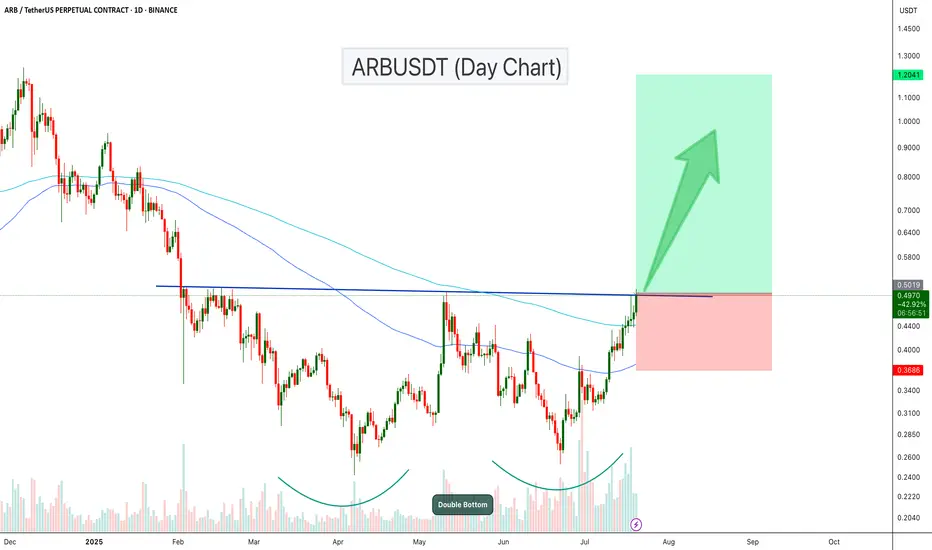
ARBUSDT Breaks Out of Double Bottom!ARB has formed a clear double bottom pattern on the daily chart, signaling a strong reversal structure. After multiple rejections, the price has now broken above the neckline resistance, confirming bullish momentum.
The breakout is also supported by increasing volume and a bullish crossover of the 100 and 200 EMA zones. If the current momentum holds, ARB could reach the target of $0.75- $1.20 level.
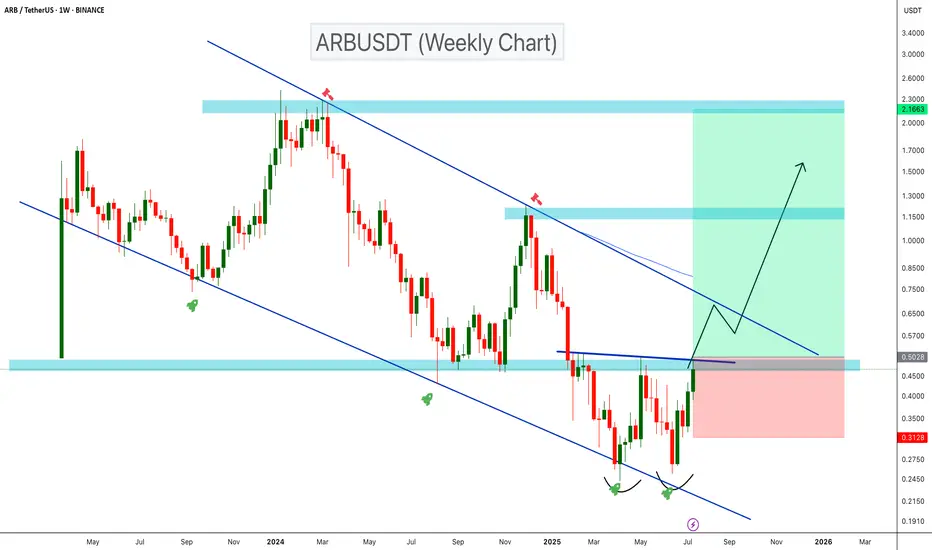
ARBUSDT Double Bottom Signals Bullish Reversal!ARBUSDT is showing a bullish reversal setup on the weekly timeframe after trading within a descending channel for over a year. A clear double bottom has formed near the channel’s lower support, and the price is now breaking above key resistance around $0.50. If this breakout holds, a move toward the upper resistance of the channel and potentially reach the ATH end of this bull run.
Cheers
Hexa
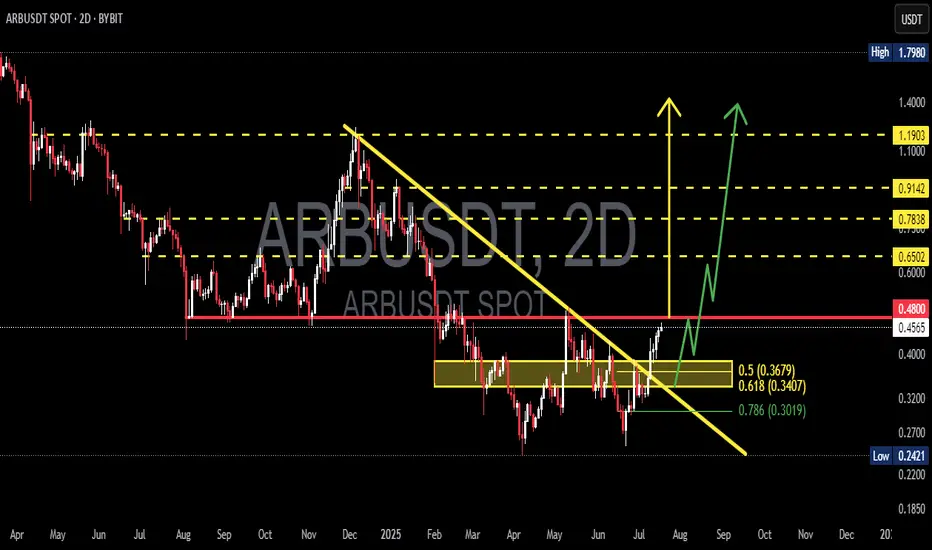
ARBUSDT Ready to Fly? Strong BreakoutARBUSDT has just completed one of its most critical technical phases in recent months — a clean breakout from a medium-term descending trendline that has been suppressing price since December 2024.
📌 Pattern and Price Structure Analysis:
🔹 Descending Trendline Breakout:
After months of downward pressure, ARBUSDT has finally broken above a long-standing trendline. This isn't just another breakout — it's a strong structural signal indicating a potential trend reversal.
🔹 Well-Defined Accumulation Zone:
A solid consolidation base formed between $0.30 - $0.37, highlighted in yellow, serving as a key demand zone. This area aligns perfectly with the Fibonacci retracement levels:
0.5 = $0.3679
0.618 = $0.3407
0.786 = $0.3019
This confluence of support suggests smart money accumulation before the breakout.
📈 Bullish Scenario (High Probability):
If price holds above the recent breakout zone ($0.45–$0.48), the bullish structure remains intact and a multi-level rally may unfold.
🎯 Bullish Targets:
1. First Target: $0.6502 — immediate horizontal resistance.
2. Key Target: $0.7838 — major resistance and previous rejection level.
3. Psychological Level: $0.9142 — pre-breakdown price zone.
4. Maximum Extension: $1.1903 — a potential target if a macro bullish wave develops.
📌 Look for higher lows (HL) and higher highs (HH) structure to confirm sustained bullish momentum.
📉 Bearish Scenario (If Breakout Fails):
A drop back below $0.45 would weaken the bullish outlook.
If the price slips below $0.3679 and loses the 0.618 Fib level at $0.3407, expect a deeper retracement toward:
$0.3019 (0.786 Fib level)
$0.2421 (previous macro low and key support)
🚨 Failure to hold the breakout level could trigger a bull trap, especially if accompanied by declining volume.
🧠 Additional Technical Notes:
Volume increased during the breakout, adding reliability to the move.
Potential formation of an inverse head and shoulders pattern within the base (still early but worth watching).
Momentum indicators like RSI and MACD (not shown) are likely to support the bullish breakout — watch for divergence confirmation.
🧭 Conclusion:
ARBUSDT stands at a critical juncture. The breakout from a long-standing downtrend coupled with a strong accumulation structure gives bulls a tactical edge. However, it must hold above key levels to sustain the momentum.
Smart traders may consider strategic entries on minor retracements while keeping risk in check below the golden pocket zone.
#ARBUSDT #CryptoBreakout #AltcoinReversal #TechnicalAnalysis
#BullishSetup #TrendlineBreakout #FibonacciLevels #CryptoTrading
#Altseason #CryptoSignals
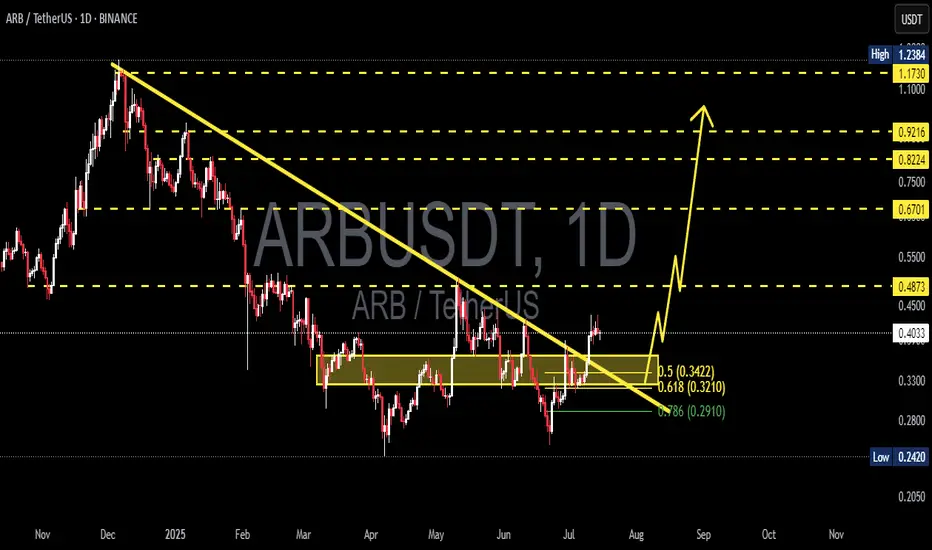
ARB/USDT Breaks Downtrend – Major Bullish Reversal in Play!📊 Technical Analysis (Daily Timeframe)
ARB has officially broken out of a long-standing descending trendline that has defined its downtrend since late 2024. This breakout, supported by strong demand at key Fibonacci levels, could be the start of a major bullish reversal.
🧠 Key Chart Patterns & Structure:
🔸 Descending Triangle Breakout
Originally viewed as bearish, this triangle has instead resolved to the upside — a rare but powerful bullish reversal signal when paired with growing volume and price compression near the breakout.
🔸 Fib Retracement Bounce
Price rebounded precisely from the 0.618 (0.3210) and 0.786 (0.2910) levels, confirming these zones as strong accumulation and liquidity areas.
🔸 Break & Retest Zone at 0.3422 – 0.3210
This golden zone will be key for confirming the breakout. A successful retest here sets the stage for the next leg up.
🔸 Bullish Price Structure Formation
A potential higher low and higher high formation is beginning, which would fully confirm the shift from bearish to bullish market structure.
🟢 Bullish Scenario (High Probability)
If the breakout is validated with a successful retest of the zone:
✅ Short-term Targets:
0.4873 — First major resistance
0.6701 — Mid-range zone with historical confluence
🚀 Mid to Long-Term Targets:
0.8224
0.9216
1.1730
1.2384 — Full recovery back to former highs
🔼 These zones align with Fibonacci extensions and historical resistance areas. Bull momentum can accelerate quickly due to short covering and new buyers entering.
🔴 Bearish Scenario (Invalidation Level)
If price fails to hold above 0.3210, the bullish setup is invalidated short-term:
Breakdown could revisit 0.2910 (Fib 0.786 support)
Below that: full retrace to the December–March demand base at 0.2420
🛑 Key Invalidation Level: Break below 0.3210 with strong selling pressure.
📌 Strategic Summary
ARB has broken its macro downtrend, signaling the start of a new phase.
Holding above the golden pocket zone (0.3210–0.3422) is critical for continuation.
Targets above 0.9–1.2 are realistic if the market sustains its momentum.
Monitor volume and RSI for further confirmation of bullish strength.
🔍 Traders Note:
This setup reflects an ideal blend of trend reversal, Fibonacci support, and breakout confirmation — a textbook setup for swing and positional traders aiming for medium-term upside.
#ARB #ARBUSDT #BreakoutAlert #CryptoTA #TrendReversal #BullishSetup #TechnicalAnalysis #CryptoTrading #FibonacciLevels #DescendingTriangle #AltcoinBreakoutl
ARB/USDT Ready for a Major Breakout! Accumulation1. Downtrend Line:
ARB has been in a sustained downtrend since late 2024, marked by a descending trendline from previous highs. The current price is testing this resistance line, hinting at a possible breakout.
2. Strong Support Zone (Demand Area):
A clear accumulation zone is observed between $0.28–$0.30, where the price has consistently bounced back. This indicates solid buying pressure and strong investor interest at this level.
3. Potential Breakout Signal:
The price is now compressing near the end of the descending triangle and is forming higher lows, suggesting a breakout setup is forming.
4. Projected Price Targets (If Breakout Confirmed):
Upon successful breakout and retest confirmation, ARB may rally toward the following resistance levels:
$0.3586
$0.3930
$0.4131
$0.4887
$0.6400
Ultimate targets could reach as high as $0.7148–$0.9197, depending on market momentum.
5. Risk & Invalidations:
A failure to hold the $0.28–$0.30 support zone and a breakdown below may invalidate the bullish structure, potentially retesting the low near $0.2420.
Conclusion:
This chart presents a high-potential breakout opportunity for ARB/USDT. Strong accumulation at key support, along with building pressure against the descending trendline, suggests a significant reversal could be underway. A great setup for swing traders and medium-term investors to monitor closely.

ARBUSDT 1D Analysis ARB ~ 1D Analysis
#ARB Buy back gradually from here if you still have confidence in this coin with a short term target of at least 15%++ from here.

ARBUSDT 1DARB ~ 1D Analysis
#ARB Buy gradually after successfully penetrating this resistant line with a short -term target of at least 10%+.

ARBUSDT Potentially BullishBINANCE:ARBUSDT hits its lowest support area at the 0.4605 area creating a double bottom around the lowest support and a neckline at the 0.6537 level. We have seen the neckline broken and retested almost immediately however, price has come back to same area for a major structural retest. If this holds as a new found support, we just might see price going higher and a 10x is highly possible.
Potential buying areas:
0.6537
0.7393
0.8228
I will not just buy at these areas without seeing price action setup indicating the buy opportunity, hence do your due diligence before taking any trade idea
Past results does not guarantee future results
#ARBUSDT

ARBUSDT 4DARB Update ~ 4D
#ARB So far it still maintains its bullish structure. This is a very good Support Block for your next purchase. Minimum target 20%++

ARBUSDT Double Bottom Breakout Confirmed!BINANCE:ARBUSDT Technical analsysi update
ARB's price broke above the double bottom neckline resistance on the daily chart with high volume and has since retested this resistance level. A bullish move can now be expected from the current level. The price has also crossed above the 100 EMA on the daily chart, which is another bullish sign for ARB

ARB Long Setup Setting / Targets and PlansBINANCE:ARBUSDT
COINBASE:ARBUSD
📈Which side you pick?
Bull or Bear
SL1 ---> Low-risk status: 1x-2x Leverage
SL2 ---> Mid-risk status: 3x-4x Leverage
(If there is just one SL on the chart, I suggest, low risk status)
👾Note: The setup is active but expect the uncertain phase as well.
➡️Entry Area:
Yellow zone
⚡️TP:
0.6409
0.6505
0.6605
0.6726
🔴SL:
0.5917
🧐The Alternate scenario:
If the price stabilize against the direction of the position, below or above the trigger zone, the setup will be canceled.

ARBUSDTARB ~ 2D
#ARB Do you still have Conviction on this coin? If yes,. perhaps this support block will be an interesting purchase for now.

ARBUSDT Long Setup Setting / Layer2BINANCE:ARBUSDT
COINBASE:ARBUSD
📈Which side you pick?
Bull or Bear
SL1 ---> Low-risk status: 3x-4x Leverage
SL2 ---> Mid-risk status: 5x-8x Leverage
(If there is just one SL on the chart, I suggest, low risk status)
👾Note: The setup is active but expect the uncertain phase as well.
➡️Entry Area:
Yellow zone
⚡️TP:
0.5415
0.5519
0.5612
0.5732
🔴SL:
0.5022
🧐The Alternate scenario:
If the price stabilize against the direction of the position, below or above the trigger zone, the setup will be canceled.

ARBUSDTARB ~ 2D
#ARB Do you still have Conviction on this coin? If yes,. perhaps this support block will be an interesting purchase for now.

ARBUSDTARB ~ 2D ✅
#ARB Do you still have Conviction on this coin? If yes,. perhaps this support block will be an interesting purchase for now.

ARBUSDTARB ~ Update
#ARB It finally broke through the resistance line of this descending pattern. Bulls should start to take control from here.

ARBUSDT 1WARB ~ 1D
#ARB Make purchases gradually in this descending pattern. it is only a matter of time that this descending pattern will be broken.

ARBUSD 1WARB ~ 1W
#ARB This Support Block will be our first purchase. with a short term target of at least 20%+. We are still bullish on this token.
We will continue to accumulate these tokens despite the terrible possibility of losing this support block.
