ARPA Chain Target Hits Perfect, Will It Happen Again?My friends, we hit it perfectly with ARPA Chain last time, 90% profits in one jump, but will this happen again?
See it here:
ARPA Chain Chart Analysis by Alan Masters
After the last bullish wave, prices for ARPABTC retraced by 100%+, giving us a new low... This is good news.
Now that all gains were removed, the sellers are exhausted so we have a good place to buy.
Prices for ARPABTC are now moving above EMA10 (0.00000101), a close above this level and the bulls start to shine, meaning, the potential goes towards the upside.
We have bullish divergence with the MACD and RSI.
Recently ARPABTC hit a new low but the RSI and MACD hit a higher low, compared to Jan. and Dec. '19. This is a strong bullish signal.
As shown by the green arrow, ARPA Chain can easily grow here.
Remember to have a plan if you decide to trade.
Make sure to hit like to show your support.
This is Alan Masters.
Namaste.
ARPABTC

ARPA Chain Looking Better (113%)We are active with ARPABTC (ARPA Chain) since our last analysis and this new one is just a friendly reminder...
Reminding you that prices are very likely to gain momentum while going higher.
We have bullish indicators, MACD and RSI, and prices now breaking above EMA50... These are bullish signals.
Additional details on the chart.
Namaste.

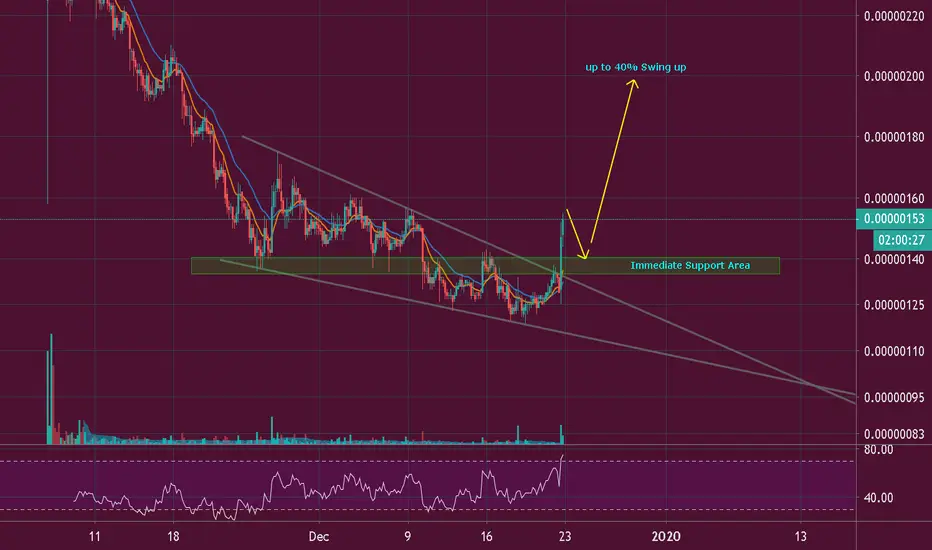
ARPA/BTC (Bull break?: up to 40% profit)ARPA/BTC
ARPA is holding the 50MA on the 12H chart for almost 24hours now if this level can hold strong for more than 48hours.
There is a high chance this coin will break to the upside in the coming days.
Our upside target is up to 144 sats and stop-loss below 94 sats.

ARPA BTC Might Bounce Soon BINANCE:ARPABTC is Currently Facing resistance at 200EMA level and good support at 50EMA level (next daily support at 99 sats, will upload daily chart )
we are expecting a huge bounce towards 170 sats level if it breaks above the resistance levels.
Decline in volume and consolidation below resistance+Macd potential bullish crossover is already in play.
Idea is invalid below 126 sat levels. Plz use stop loss to avoid losses since bitcoin can always destroy your alt positions
Good Luck with trade.

ARPA/BTC, BULL DIV (4HR), BEARISH CYPHER LEG UP, 18% +MOVETitle says it all. I AM NOT A FINANCIAL ADVISER, DO YOUR OWN RESEARCH!

ARPABTCGuys, if you like the idea please put like button, this will be the best thanks. Thank you for your support, I appreciate it.

ARPA - I smell a pump here..!!After the fun and subsequent dump, ARPA is fighting back and i expect a pump.
Technical setup is also good. price bouncing of the fib level.
Volume is good, 500+ BTC.
I am in.

ARPABTCGuys, if you like the idea please put like button, this will be the best thanks. Thank you for your support, I appreciate it.

$ARPA - Triangle on watchlist$ARPA is drawing a triangle ?
Waiting to breaking up or just playing support with tight SL
Not A Financial Advice

ARPA Chain Challenged EMA50 | 90.09% Targets MappedHere we have ARPA Chain (ARPABTC) which is now trending on Binance...
We can see a strong break of EMA10 at 0.00000106 on low volume and EMA50 at 0.00000124 now being challenged... This is now a bullish setup.
ARPABTC is showing a strong RSI and a broken trendline (in blue). This means that prices can easily continue moving higher.
The fact that EMA50 is being challenged on low volume, can signal that either ARPABTC will move much higher in the coming days/weeks, or that this move is weak and is likely to retrace... In my view, the first one is the case.
ARPA Chain is ready to grow.
Namaste.


ARPABTC: interesting project to watch #5Another interesting project added to my watchlist
China's top 10 innovative blockchain company along with Tencent Blockchain, Baidu Xuperchain, Wanxiang Blockchain, JD Blockchain and others.

APRA Chain (Jan 13) - 41% in 15 Days#APRA/BTC (Binance)
Buy : 105 - 110
Sell : 115 - 120 - 130 - 140 - 150
Stop : 98
#APRA $APRA #APRABTC

#ARPA CHAIN A Positive Move Entry : 0.00000147 - 0.00000136 - 0.00000128
Target 1 : 0.00000168
Target 2 : 0.00000190
Target 3 : 0.00000210
Target 4 : 0.00000258
Target 5 : 0.00000311
Stop loss : 0.00000112
Risk/Reward : 17%/120%
Do not hurry to buy, the price may go down to good places
Please share your opinion in the comments box and do not forget to press the like button

ARPA/BTC TA Update (Retest Bottom Trend-line?)ARPA/BTC
ARPA is forming a beautiful bullish descending channel on the 12-hour time-frame.
Though I'm not confident the 114 sats area will hold as the RSI is likely to enter the oversold territory again in the coming days.
The price could drop to the bottom trend-line at around 110 - 101 sats levels before we could see some potential buyers to step-in.
If ARPA hits my buy zone area, I'm expecting the price to consolidate in those regions for at least a week before it will try to push Higher.
It is a long process but that's how the market cycle goes.

ARPA / BTC A symmetrical triangle has formed in the channel.A symmetrical triangle has formed in the downward channel. The price is clamped to the very corner of the formation. There will be a denouement soon. Symmetrical triangle figure of uncertainty. The full working out of the triangle is 38%. Perhaps it will stop the boundaries of the trend line of the downward channel.
ENTRANCE
1) On a breakthrough or rollback after breaking a triangle.
2) Entrance from the bottom of the channel, when confirming the support of the channel.
Zones (points) of the pivot and the purpose of certain movements I showed on the chart.
Stop loss
Under key support levels during your entry into the market.
Do not forget to move Stop Loss during the price increase, but take into account the volatility of the coin.

ARPABTC 2HARPA about to do Breakout, there is H&S and probable of the Bat Pattern and CUP. Bullish is soon, Good luck!

ARPA Chain (ARPA) Pump coin. Important area. Pivot points.Young coin. It was created in July. Satoshi price, therefore it is easy to pump up and keep the price, a lot of coins. People are not afraid to buy cheap even on "X")) The coin was made only to earn real money temporarily, on those people who believe in legend and perspectives.
The legend of the project is a confidential computing network. Traded on the HUOBI exchange. After the pump, + 270% was added to the Binance exchange. The chart on the Binance exchange gives users the impression that the coin is new and has not yet been pumped. Therefore, they are not afraid to buy.
Now an important area for observation, the price is near the local downtrend (yellow line). If the price breaks it and fixes above it, the “Dragon” figure can work out at a local level. Potential from +25 to + 85%. That is, the length of the Dragon Tail. Pay attention to the uptrend line (yellow); in our case, it also acts as a support. Further price movement depends on the reaction of the price to this trend line.
Also, from the zone that I specially singled out, the figure "Head and shoulders" can be formed . But even in this case, you can snatch + 25%. But in any case, be careful.
Entrance when the price fixes above the local downtrend . All pivot points of prices and targets are shown on the chart.
Target are shown on the chart with various potential movements.
Stop loss
Under key support levels during your entry into the market.

ARPA/BTC TA Update (Bullish Pattern Confirmed)ARPA/BTC
ARPA broke bullish on this falling wedge pattern and setting up a Higher High. RSI is a bit extended on the overbought condition, the price might pullback to cool everything off before it continues another uptrend.
ARPA | Looks Juicy..!!ARPA (ARPA Chain)
Forming Bullish Divergence Pattern in USDT Pair & Falling Wedge Pattern in BTC Pair..!!
Volume is Increasing So Keep Your Eyes on it..
What is ARPA Chain?
ARPA is the world’s first privacy-preserving computation network that’s based on MPC. ARPA enables private smart contracts on blockchains acting as a layer 2. ARPA is committed to providing secure data transferring, sharing, and joint-analysis solutions based on cryptographic operations and blockchain for businesses and individuals.
Please like, subscribe and share your ideas and charts with the community!

ARPA/BTC TA Update (Sideways Action?)ARPA/BTC
ARPA is still trapped inside this descending channel as the price keeps making lower highs. The next immediate support below is 120 sats and top resistance is 140 sats.
Until this pattern is broken, price action will just move sideways within a week. In the short term, Bears have control of this market situation.


ARPA/BTC - Local bottom (74%+ Potential Profit)Great area for buying.
My reasoning:
Location: Reload zone within a reload zone.
Structure: Double bottom (previous week's open acting as support)
Divergence: Healthy OBV, Willy coming out of stupid, histogram divergence has been confirmed on the 12HR.
I will target the Kill zone (red box) of the recent range. If price reaches the top of the box, it will be a 100% trade.
4HR:
1HR:
